- The paper presents a medhub platform that integrates clinical and omics data to enable rapid, interdisciplinary decision-making.
- It employs a user-centered, drag-and-drop design with dynamic dashboards to facilitate cohort creation and interactive data visualization.
- The study highlights the platform’s deployment through interdisciplinary workshops to refine data-driven discussions and enhance biomarker discovery.
Introduction
The paper "Towards medhub: A Self-Service Platform for Analysts and Physicians" (2309.11234) presents an interdisciplinary approach to biomarker identification that integrates clinical and omics data to enhance healthcare diagnostic processes. By deploying a user-centered design, the research emphasizes optimizing the interaction between analysts and physicians through dynamic, personalized dashboards to address the complexity and heterogeneity of medical data. The platform showcased aims to bridge the technical expertise of analysts with the domain knowledge of physicians, facilitating faster decision-making processes in clinical environments.
The study builds on prior research by Aigner and Miksch [aigner2006CareVis], who demonstrated the significance of visualizing treatment data alongside classical data visualization to better understand patient phenomena. Additionally, Burmeister et al. explored the efficacy of self-service tools, albeit focusing primarily on medical researchers without distinctly separating the roles of analysts and physicians [burmeisterSelfServiceDataPreprocessing2019]. The presented platform advances these foundations by offering interactive solutions tailored to specific stakeholder requirements in the biomarker discovery process and facilitating direct communication between roles.
Approach
The self-service platform leverages a data-user-task model previously introduced by Miksch et al. [miksch2014matter], configuring a flexible ecosystem for cohort creation, exploration, and visualization. Analysts prepare interactive dashboards that can adapt in real-time during discussions with physicians, thereby optimizing meeting efficiency and interdisciplinary collaboration.
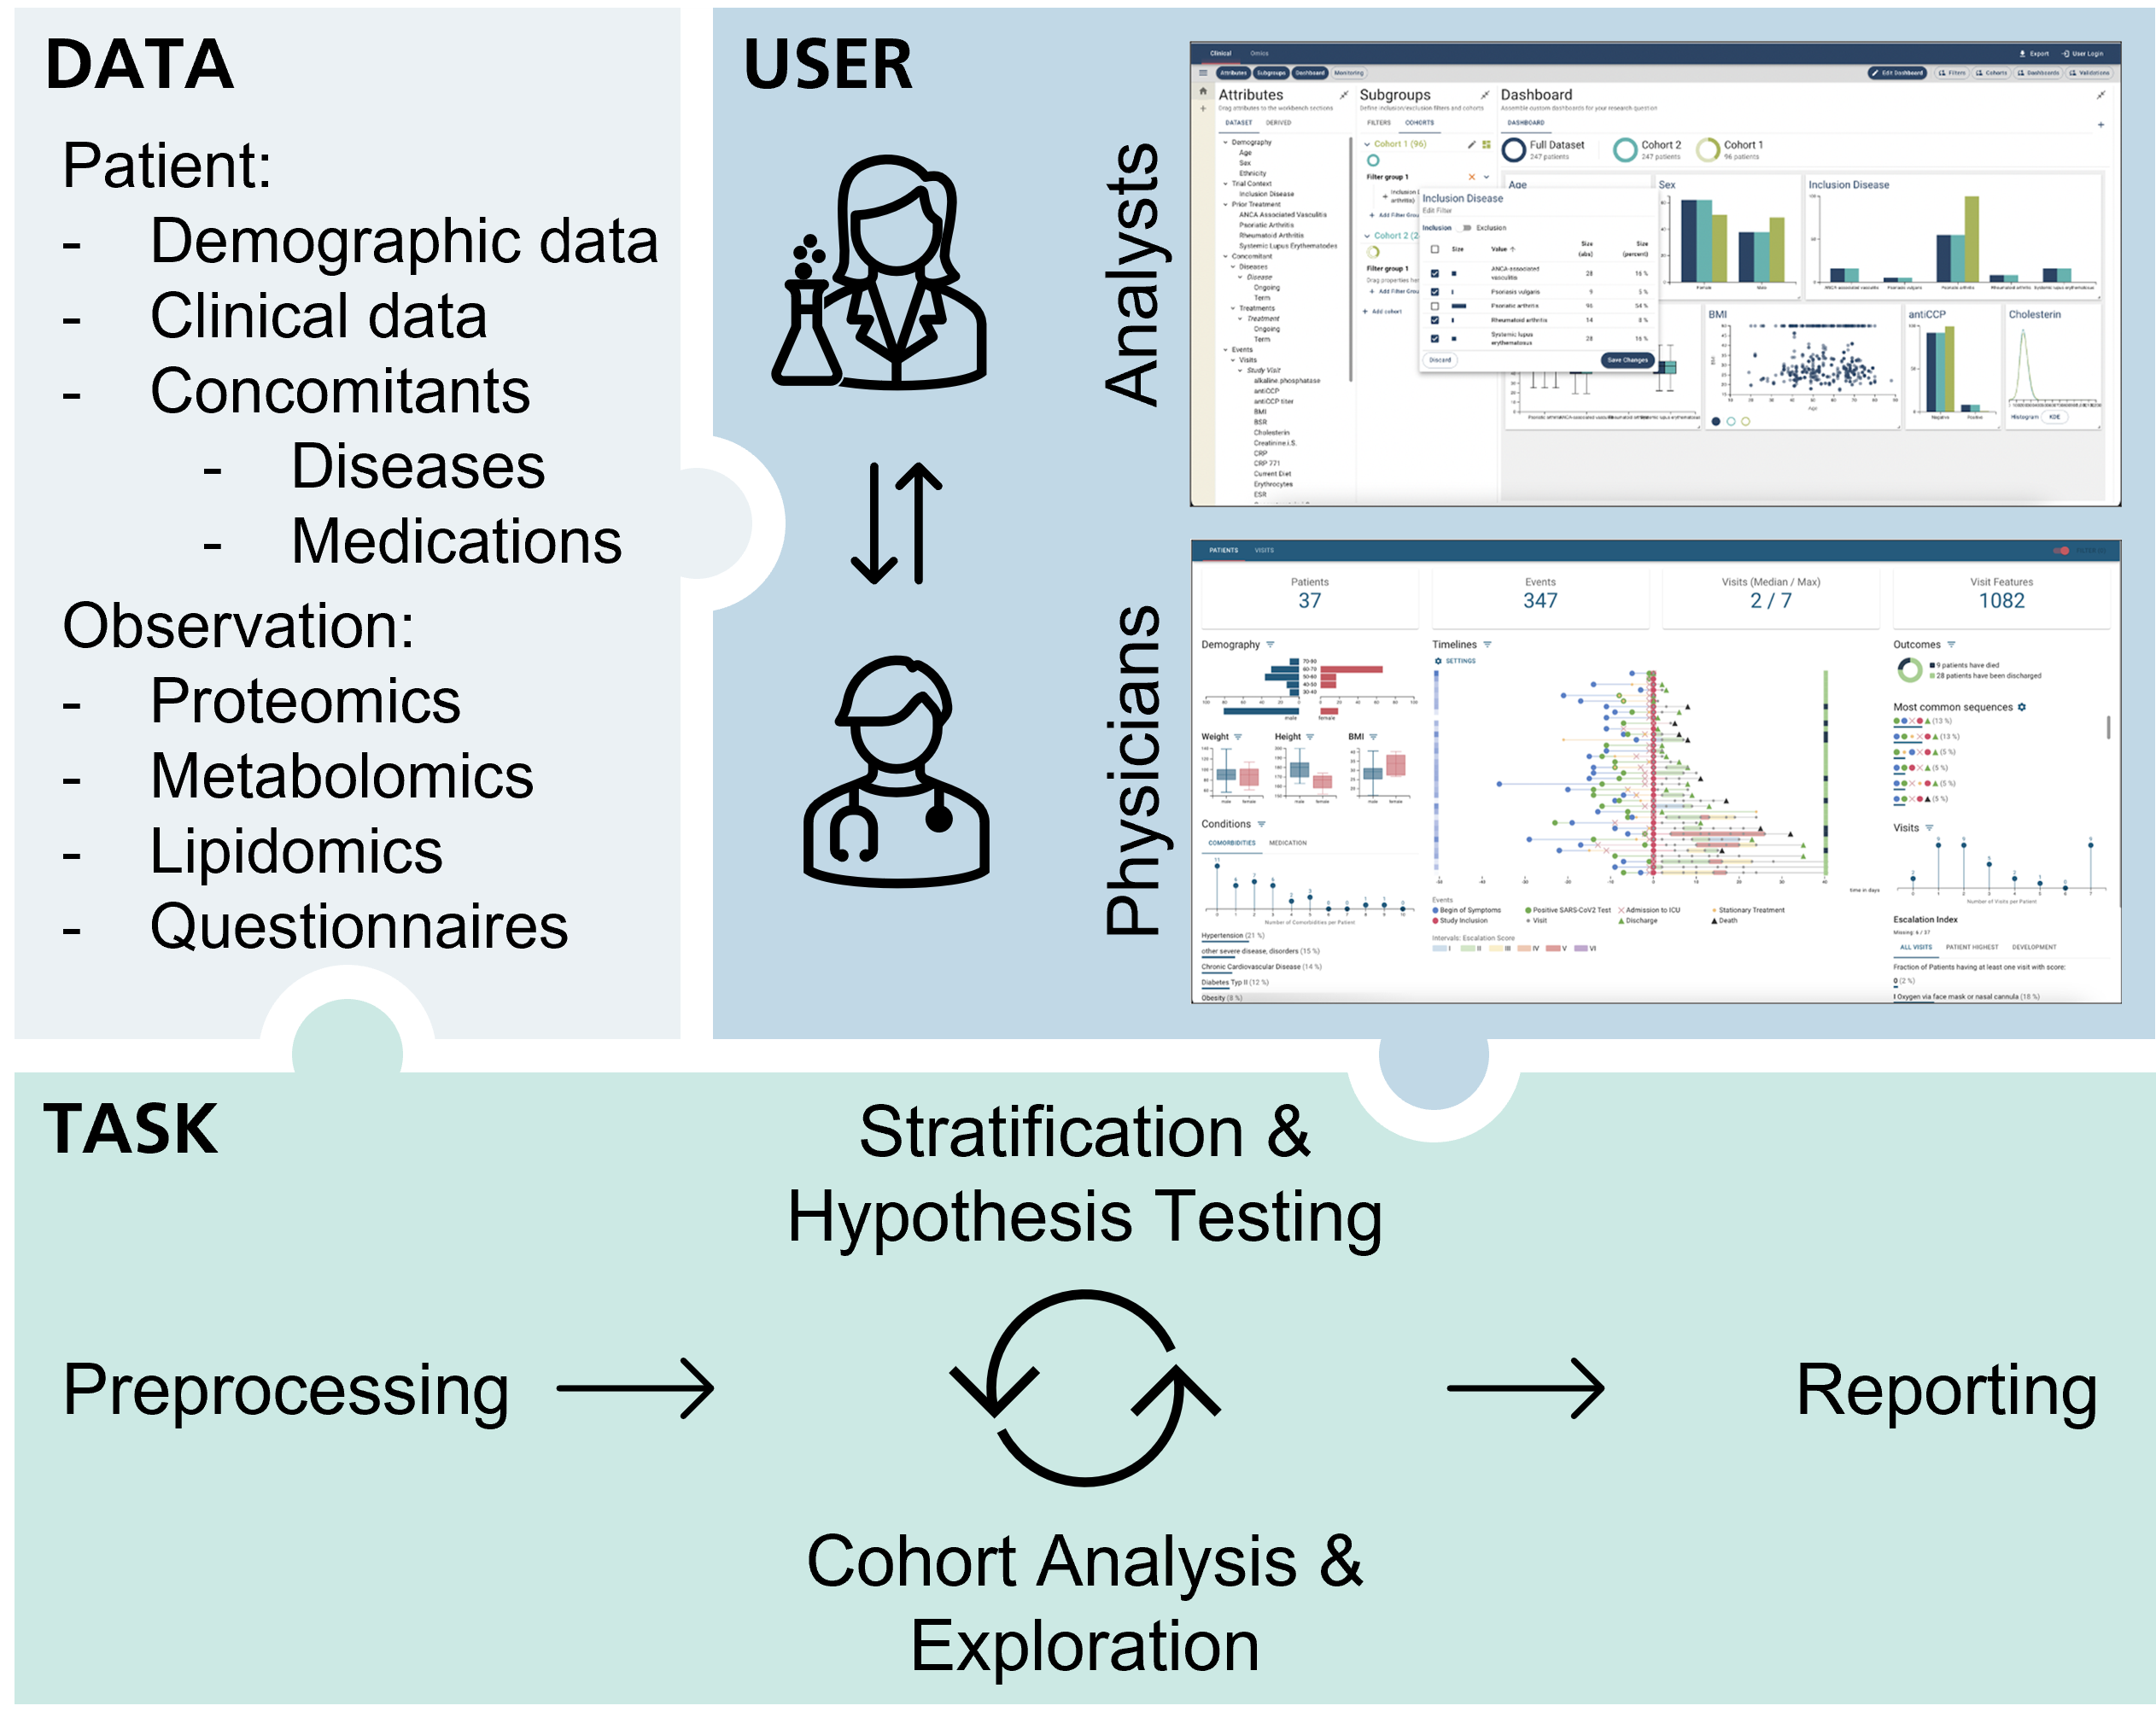
Figure 1: The concept of our approach uses the data-user-task triangle by Miksch et al.
Visualizations such as line plots, scatter plots, and aggregate data presentations are utilized to provide comprehensive insights into complex datasets. By allowing ad-hoc modifications and interactive filtering, the platform supports real-time decision-making tailored to the specific needs of both analysts and clinicians.
Workflow and Usage Scenario
Within the proposed platform, users can build cohorts and apply various analytical tools to visualize demographic and clinical data efficiently. The drag-and-drop interface facilitates dynamic data exploration, ensuring that the evolving questions during interdisciplinary discussions can be addressed without the need for subsequent meetings. This adaptability enhances collaboration, enabling analysts to cater to physicians' requirements instantaneously, thus maximizing the informative value derived from data.
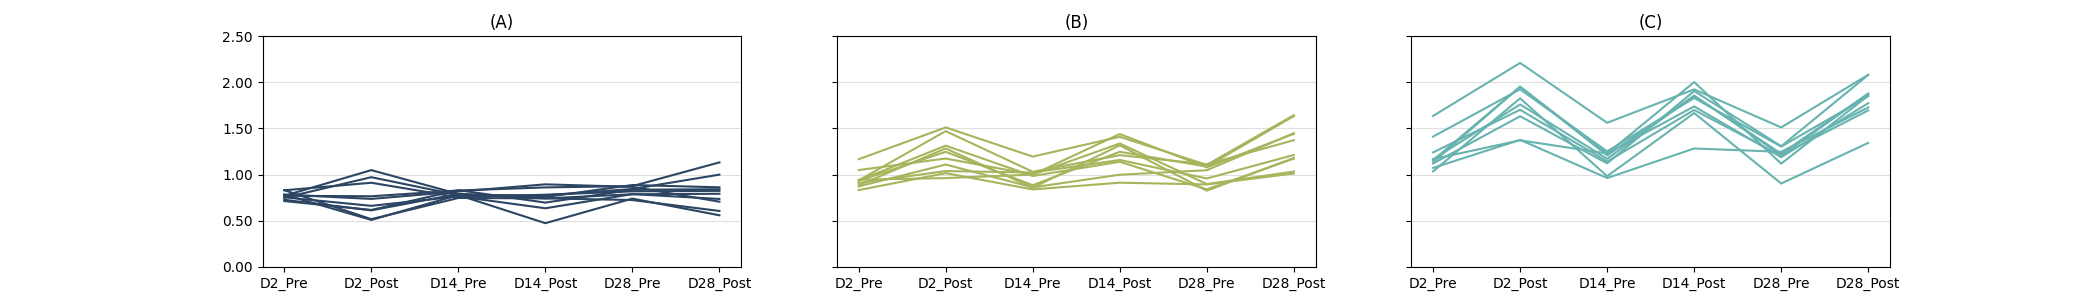
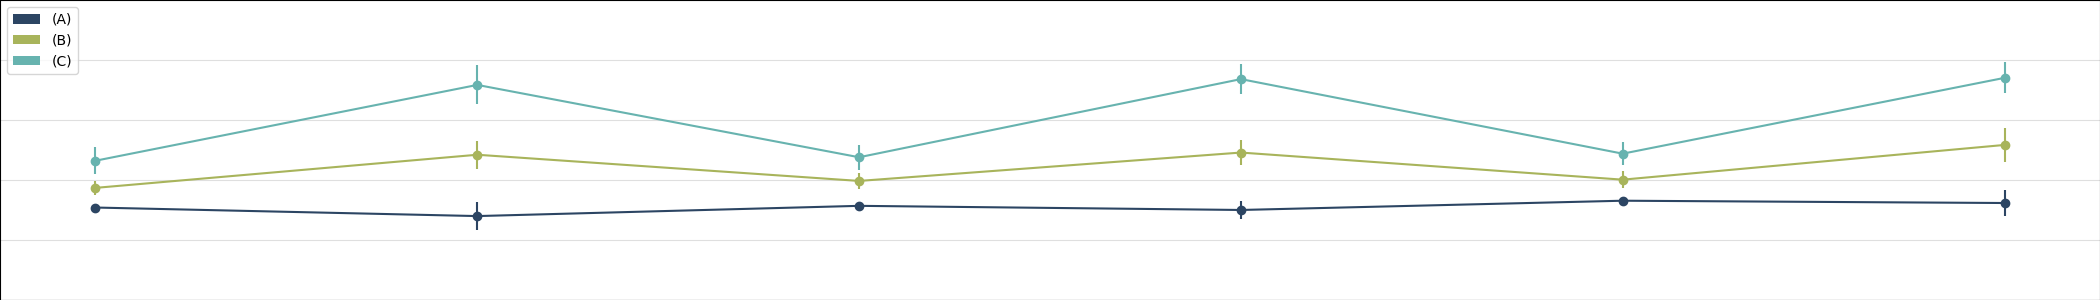
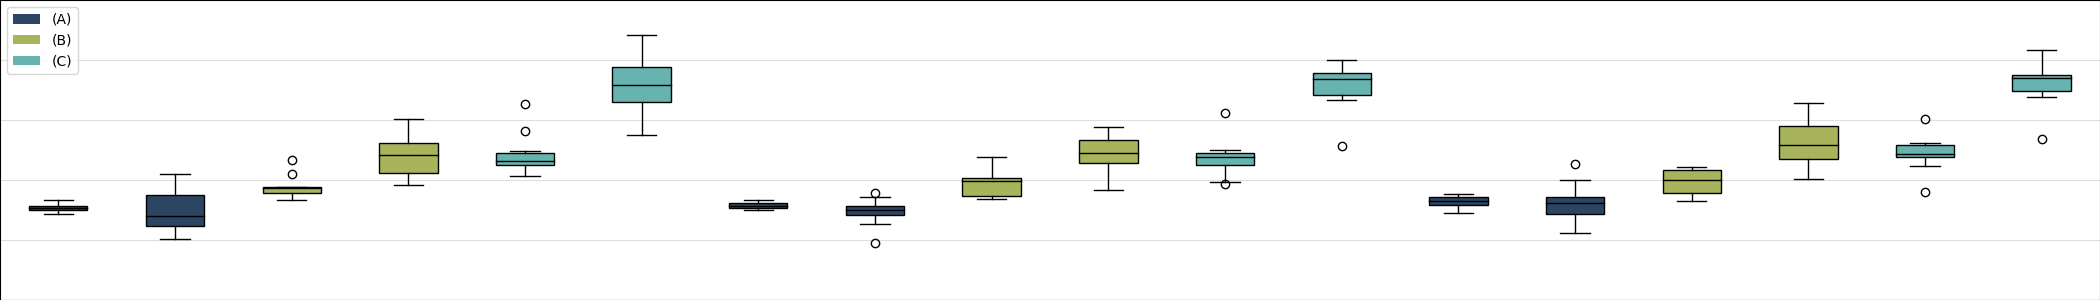
Figure 2: Data consist of three cohorts (A), (B), and (C), each with ten patients times six time points. The top row shows multi-line plots for each cohort. The middle row shows a line for each cohort aggregated for each time point and enriched with a 95% confidence interval. The bottom row shows the same data aggregated into box plots to visualize the distribution per cohort at the given time points.
Discussion and Future Work
The platform's immediate deployment is contingent on acquiring formative feedback through interdisciplinary workshops, aimed at fine-tuning user interactions to improve collaborative efficiency. Future research endeavors will explore enhanced visualization recommendations to detect correlations, integration of pathway information for robust phenotype analysis, and spatialization techniques for comprehensive cohort assessment.
The platform's continued development will adhere to the feedback from initial user workshops, potentially incorporating methodologies for advanced data visualization and sensemaking tools to facilitate deeper insights into complex medical data relationships.
Conclusion
The medhub platform represents a significant step towards enhancing interdisciplinary collaboration in medical settings by integrating omics data and clinical insights through interactive dashboards. By improving the efficiency of data-driven discussions between analysts and physicians, the platform seeks to alleviate the constraints of static, traditional medical analyses. Future enhancements promise to further cement this self-service tool as an integral component of modern medical research and practice, with pathways to refined biomarker discovery and patient care optimization.