- The paper presents ChartLlama, a multimodal LLM that improves chart comprehension and generation through a novel GPT-4 based data generation pipeline.
- It leverages synthesized tabular datasets, automated chart figure generation via Matplotlib, and structured instruction-answer pairs to enhance performance on tasks like ChartQA and Chart-to-text.
- Experiments show ChartLlama's superior performance over previous models, offering a scalable framework adaptable to new chart types and complex data visualization tasks.
ChartLlama: A Multimodal LLM for Chart Understanding and Generation
The paper "ChartLlama: A Multimodal LLM for Chart Understanding and Generation" presents a novel approach to enhancing chart comprehension and generation by harnessing the strengths of multimodal LLMs. The core of the research involves creating a high-quality instruction-tuning dataset leveraging GPT-4, which forms the basis for training the proposed model, ChartLlama.
Introduction
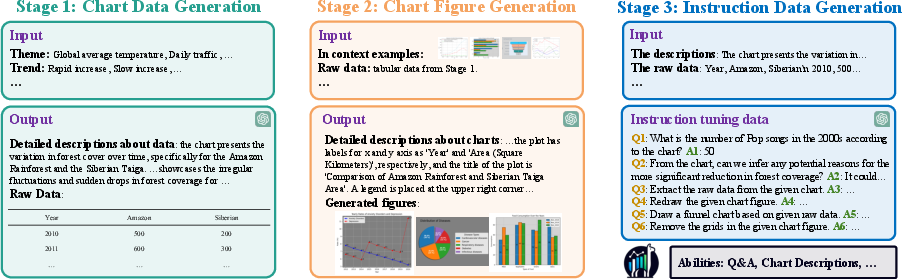
The authors address a notable gap in the ability of contemporary multimodal LLMs, such as GPT-4V, to interpret and generate specific domain data, particularly chart figures. This limitation is attributed to the dearth of relevant instruction-tuning datasets. To overcome these challenges, the paper introduces an innovative data generation pipeline that consists of three critical stages:
- Chart Data Generation: Using GPT-4, the authors synthesized tabular data by guiding it with specific characteristics such as topics, distributions, and trends.
- Chart Figure Generation: The model employs coding skills to create visual representations of the synthesized data using libraries like Matplotlib.
- Instruction Data Generation: GPT-4 further constructs instruction-answer pairs to enhance the model's chart comprehension abilities.
This comprehensive methodology allows the authors to generate diverse, high-quality datasets efficiently, which are then utilized to train ChartLlama, a multimodal LLM that showcases improved capabilities across several chart-related tasks.
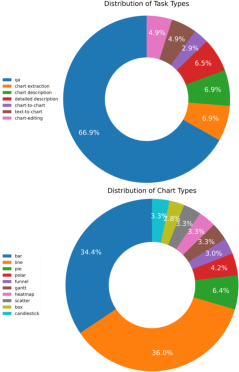
Figure 1: Distributions of different types of data in our dataset. The top and bottom pie charts show the distribution of task types and chart types, respectively.
Methodology
Chart Data Generation
This phase emphasizes the creation of diverse and meaningful tabular data using GPT-4. To ensure meaningful data generation, the authors focus on:
Utilizing GPT-4's coding abilities, the synthesized data is converted into visually appealing charts. By integrating in-context examples and comprehensive function documentation, the authors enhance the diversity and accuracy of the generated charts. This approach outperforms previous automated efforts by avoiding template-driven limitations.
Instruction Data Generation
With the structured chart data, the model constructs diverse instruction-answer pairs across several complex tasks, ensuring high-quality training data that enhances the understanding capabilities of models trained on this dataset.
Experimental Setup
The evaluation of ChartLlama involved traditional tasks like ChartQA and Chart-to-text, along with novel tasks such as chart generation and editing. The datasets used in training and evaluation underscore ChartLlama's superiority in understanding and generating charts in various forms and complexities.
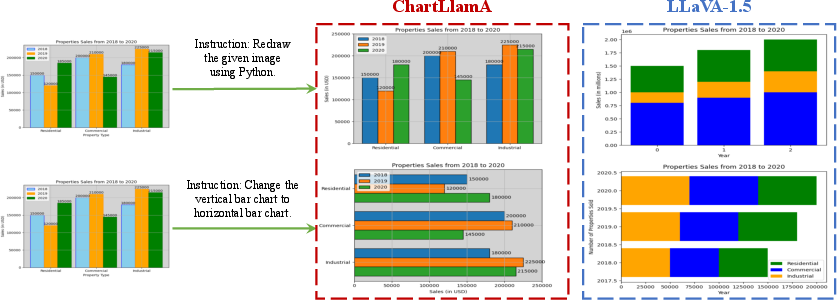
Figure 3: Qualitative comparison for Chart-to-chart and Chart editing tasks.
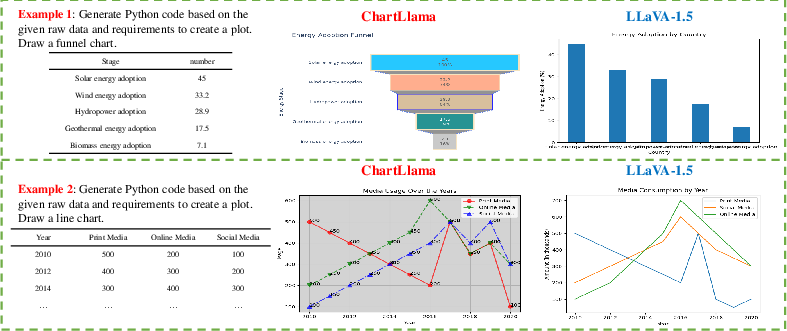
Figure 4: Qualitative comparison for Text-to-chart task.
Results
ChartLlama demonstrates significant improvement over prior models across various benchmarks. Notably, it achieves the best performance on ChartQA and Chart-to-text tasks. Its ability to handle long texts and generate accurate chart figures highlights its enhanced capabilities. The flexibility of the data generation approach allows for adaptation to novel chart types and tasks, showcasing the robustness and scalability of the methodology.
Conclusion
The proposed data generation methodology and ChartLlama model offer substantial advancements in the domain of chart understanding and generation. The flexibility and scalability of the data generation process ensure that the model can efficiently extend to new types of charts and tasks. The research contributes significantly to multimodal LLMs, setting a new standard in chart comprehension.
While the current vision encoder has limitations in multilingual OCR tasks, future developments could focus on implementing improvements to address this and further enhance the model's utility.
This paper serves as a valuable resource for researchers and practitioners interested in advancing multimodal AI capabilities in specific domains such as chart understanding.