- The paper demonstrates that soil warming advances the start (SOS) and peak (POS) of vegetation by approximately 1.5 days per °C using MLP regression and SHAP analysis.
- The integration of multilayer perceptron models with aggregated meteorological data significantly outperforms linear regression in predicting key NDVI metrics.
- The study reveals that while soil temperature drives intra-annual phenological shifts, aggregated meteorological factors predominantly explain inter-annual variability.
Inferring the Relationship Between Soil Temperature and NDVI with Machine Learning: An Expert Synthesis
Introduction and Context
The study titled "Inferring the relationship between soil temperature and the normalized difference vegetation index with machine learning" (2312.12258) investigates the influence of soil temperature and other meteorological variables on vegetation phenology in subarctic grasslands, leveraging ML regression and explainable artificial intelligence (xAI) methods. The normalized difference vegetation index (NDVI) serves as a proxy for plant growth and seasonal activity, with the research focusing on three key phenological parameters: start of season (SOS), peak of season (POS), and peak NDVI value (PEAK).
The experimental context is Icelandic grasslands exposed to varying soil temperature regimes arising from geothermal warming. The study systematically collects NDVI, soil temperature, and meteorological variables over six consecutive years across fifty plots, forming a robust dataset for intra- and inter-annual phenological analysis.
Methodological Approach
The analysis initially employs double logistic curve fitting for NDVI time series to estimate seasonal phenological metrics, ensuring differentiability and robust extraction of SOS, POS, and PEAK. Linear regression models are applied to relate soil temperature to these metrics, but they exhibit considerable unexplained variance.
To address this, the central methodological innovation is the application of multilayer perceptrons (MLPs) integrating soil temperature and 26-week aggregated meteorological variables as inputs. Hyperparameter optimization is performed via grid search and cross-validation, yielding predictive models for SOS, POS, and PEAK. Model interpretability is achieved through Kernel SHAP values, allowing granular attribution of feature contributions at the model and sample levels.
Key Findings
The study reports statistically significant associations between average soil temperature and the timing of SOS and POS, as well as a slight but consistent increase in PEAK NDVI values with increased soil temperature. Empirically, SOS advances by 1.52 days per °C soil warming, and POS by 1.65 days per °C, indicating a synchrony in phenological advancement due to soil temperature. PEAK NDVI values exhibit only marginal increases per degree, corroborating evidence from prior studies on biomass invariance across warming gradients.
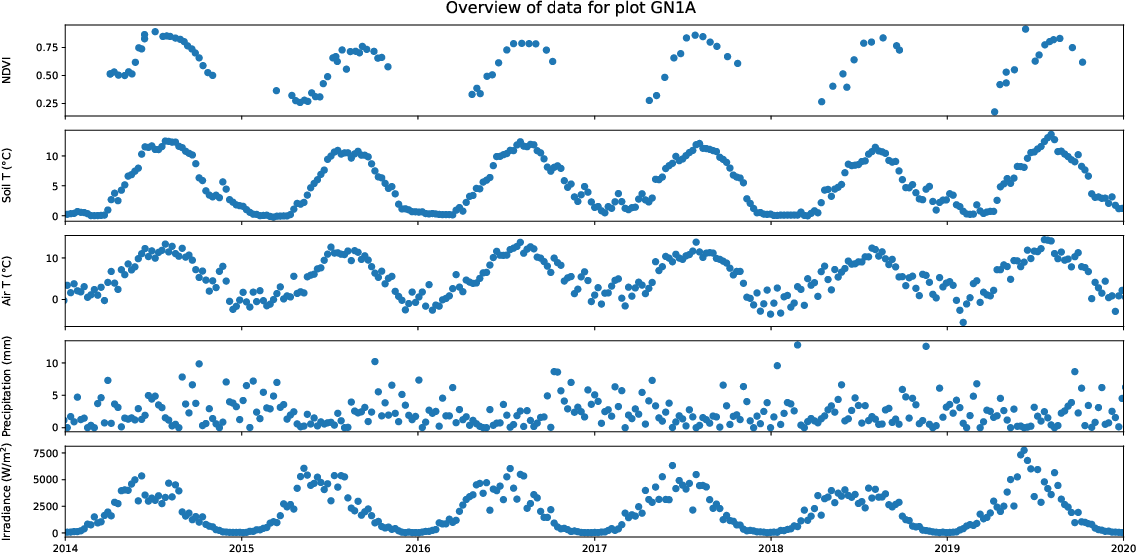
Figure 1: Overview of all available variables for a representative unwarmed control plot (GN1A), showing seasonal NDVI, soil temperature, and meteorological time series.
The application of MLPs with integrated meteorological data results in improved explanatory power over linear models (rSOS2=0.322, rPOS2=0.192, rPEAK2=0.248), demonstrating the capacity of ML models to capture nonlinear and multifactorial influences.
Linear modeling results for soil temperature are visualized below.
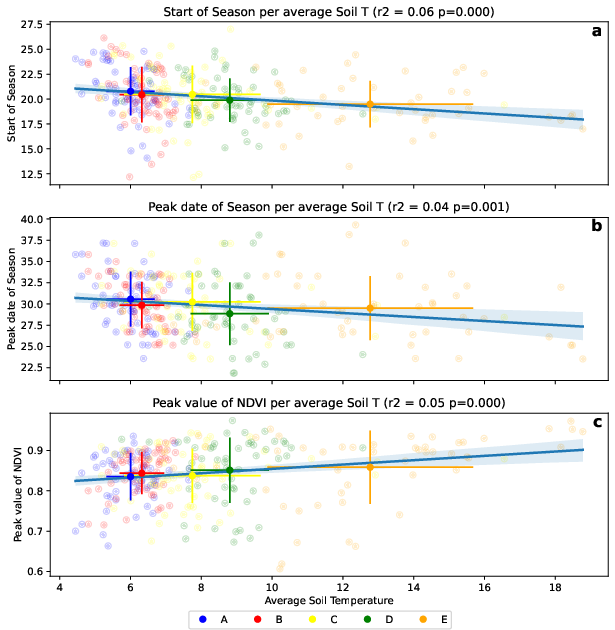
Figure 2: Linear models relate average annual soil temperature to SOS, POS, and PEAK, with warming plot categories color-coded.
SHAP analysis reveals that meteorological variables (air temperature, precipitation, irradiance) collectively contribute more to model variance than soil temperature, particularly for POS and PEAK. However, within-year phenological shifts are consistently explained by soil temperature, as evidenced by strong Pearson correlations (r=−0.93 for SOS, r=−0.85 for POS, r=0.91 for PEAK) between soil temperature and its SHAP attribution.
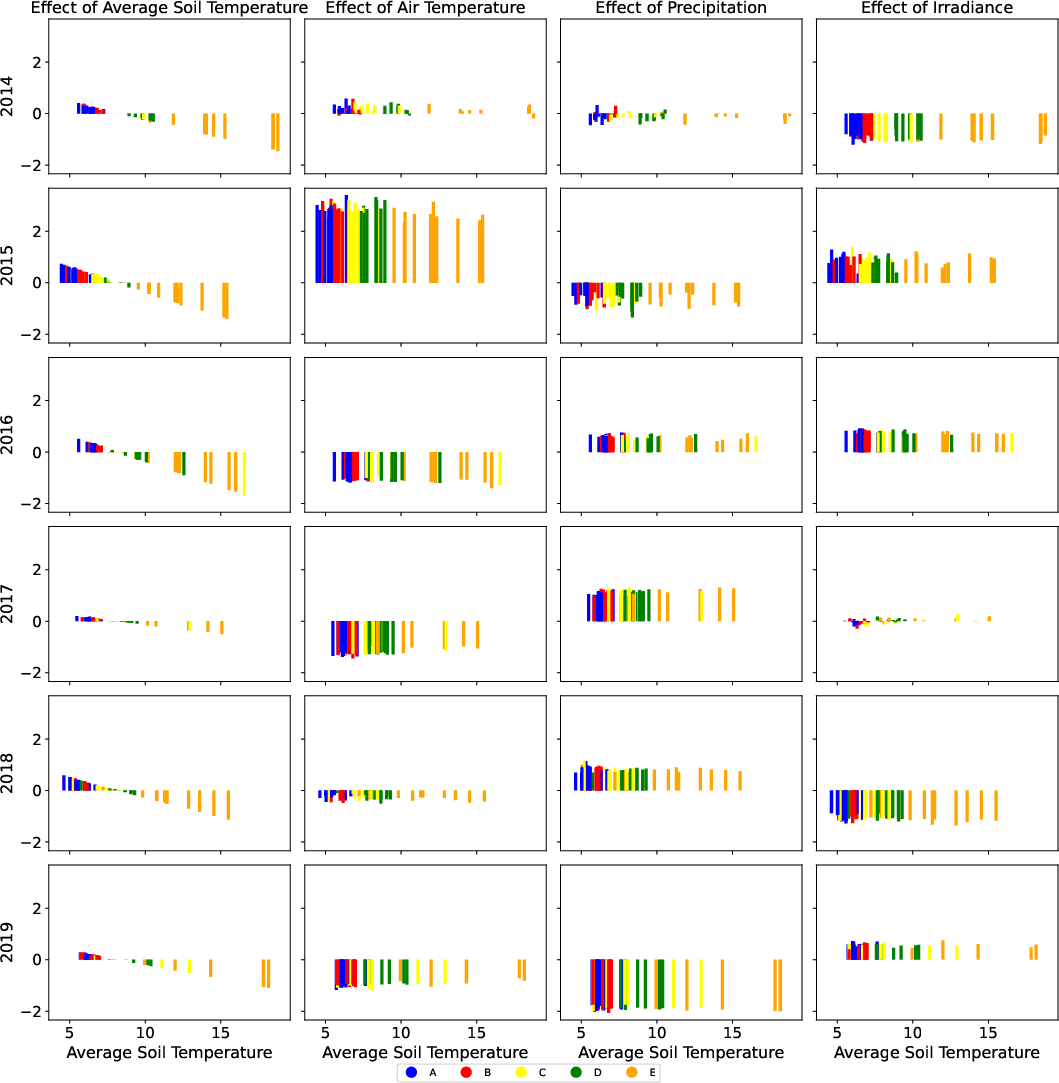
Figure 3: SHAP values for the ML model predicting SOS, demonstrating plot-specific meteorological and soil temperature contributions across warming categories.
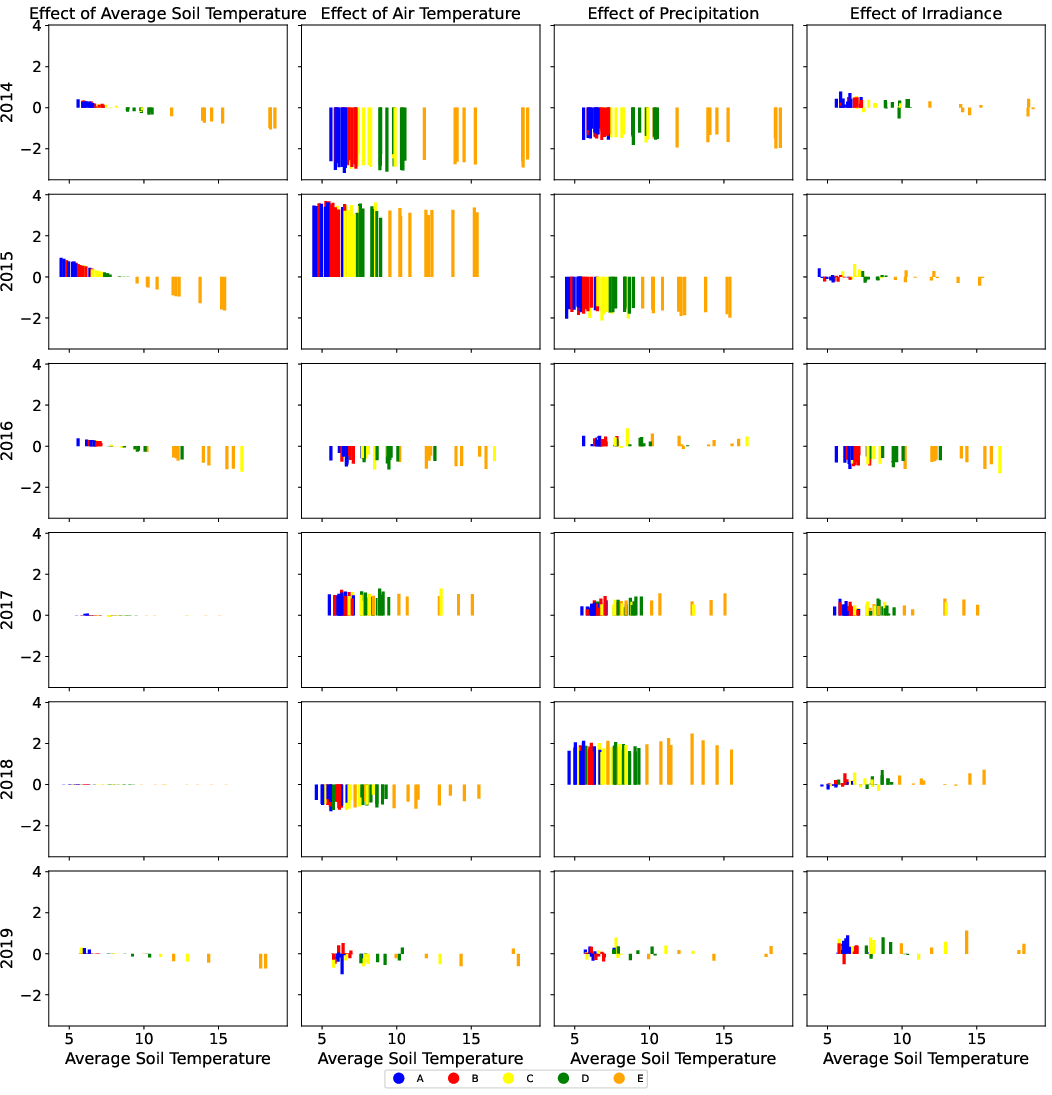
Figure 4: SHAP values for prediction of POS, illustrating annual and plot-specific variability in feature importance.
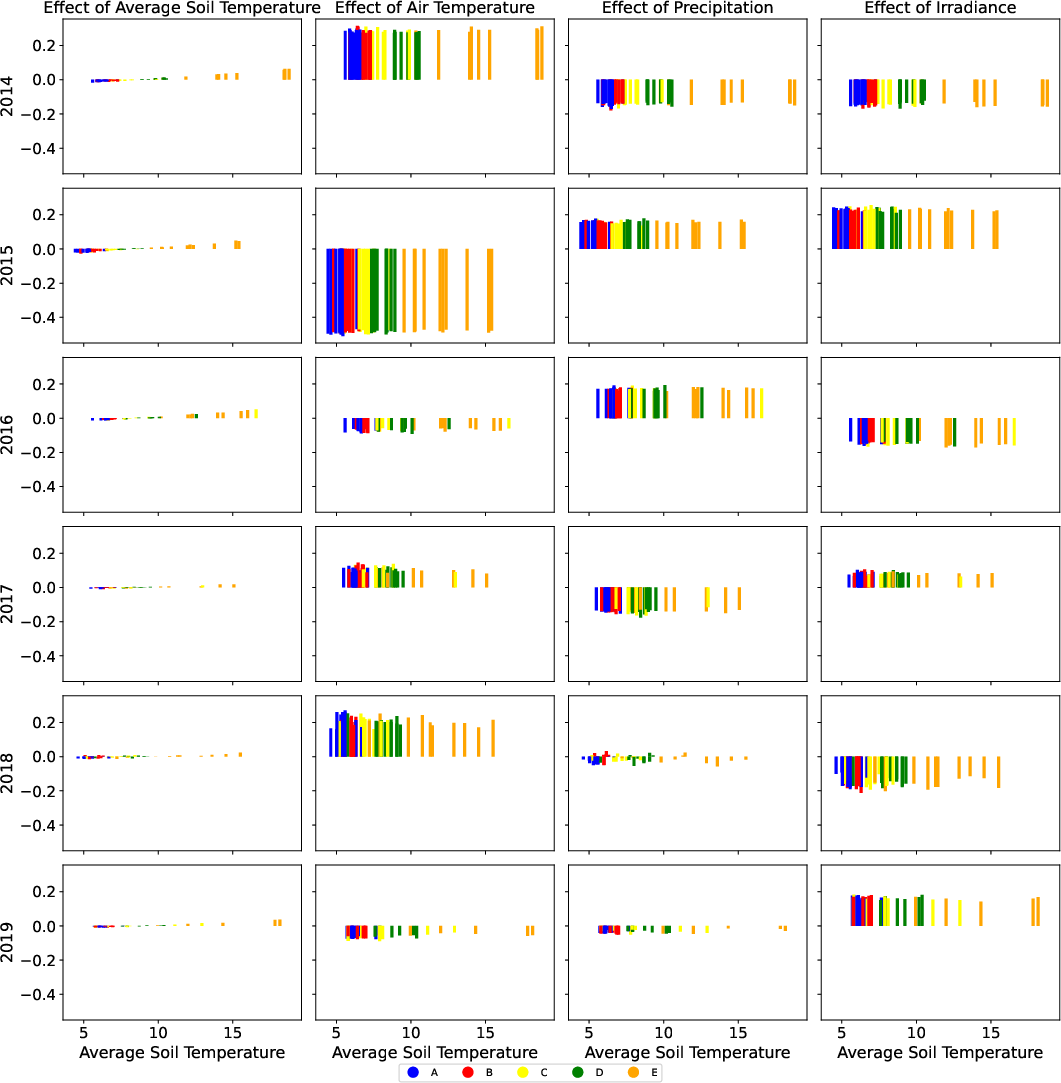
Figure 5: SHAP values for PEAK NDVI prediction, highlighting dominant meteorological drivers and subtler soil temperature effects.
Aggregated SHAP values indicate substantial inter-annual variability is attributable to meteorological parameters, with soil temperature driving intra-annual differences.
Implications for Ecology and AI Research
This work empirically substantiates the role of soil temperature in advancing the timing of vegetative growth phases in subarctic grasslands, supporting the hypothesis that continued warming will lengthen the growing season. Contrary to previous theoretical frameworks positing photoperiod as the primary determinant of POS, this study demonstrates temperature-driven shifts in both SOS and POS.
The marginal increase in PEAK NDVI with warming suggests that NDVI-based greening phenomena may not always correspond to increased biomass, but rather to changes in pigment concentration and photosynthetic activity. The dominance of meteorological variables in explaining inter-annual phenological variance highlights the need for high-resolution, plot-specific meteorological measurements in future studies.
Methodologically, the integration of ML models and xAI techniques into phenology research sets a precedent for future ecological modeling, allowing disentanglement of complex driver interactions and facilitating transparent, interpretable model outputs. The findings advocate for expanded use of ML and xAI in ecological monitoring, forecasting, and management, especially as climate change induces nonlinear ecosystem responses.
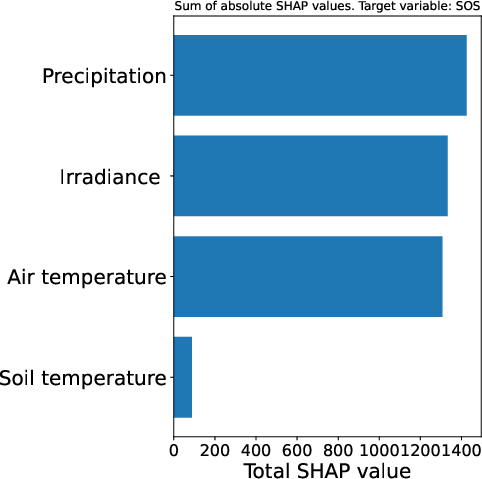
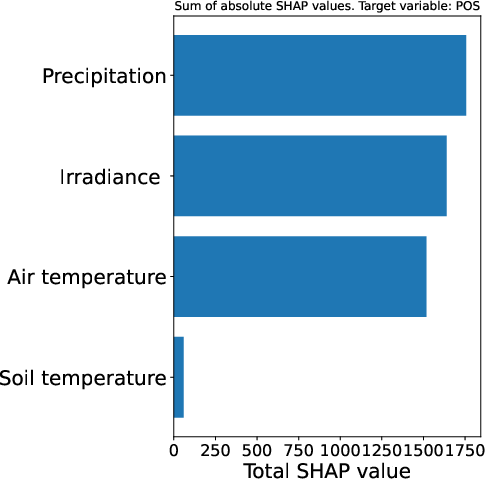
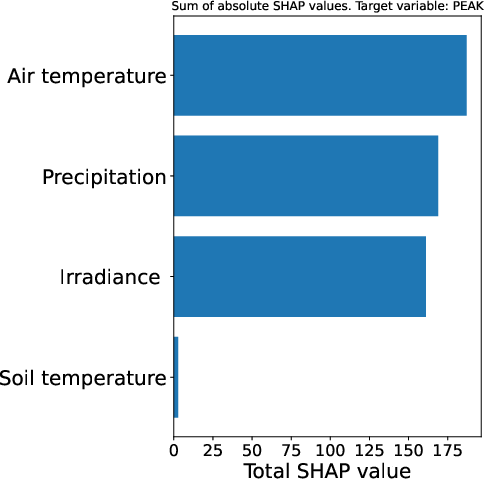
Figure 6: Multi-year tracking of SOS in response to soil temperature and meteorological variability.
Future Directions
Further research is warranted to generalize findings across broader spatial and temporal scales, employing advanced remote sensing coupled with ground-based measurements. Exploration of alternative ML architectures (e.g., ensemble tree models), additional xAI methods (e.g., LIME), and causal inference approaches will enhance interpretability and robustness. Investigating physiological mechanisms at the species level, and mapping soil temperature-photoperiod interactions, will refine predictive models of vegetation phenology under climate change scenarios.
Conclusion
The study demonstrates that machine learning models incorporating soil temperature and meteorological variables significantly improve the prediction and interpretation of vegetation phenology metrics in subarctic grasslands. Soil temperature is a consistent driver of within-year phenological shifts, while meteorological factors underpin inter-annual variability. The deployment of xAI methods such as SHAP provides actionable insight into variable importance and model behavior. The research establishes a methodological foundation for future ML-based ecological studies and offers practical implications for managing subarctic ecosystems in a warming climate.