- The paper introduces STDA, a coherence-based method that overcomes thresholding biases by analyzing frequency-specific brain connectivity using spectral landscapes.
- It builds Rips filtrations across multiple frequency bands to reveal detailed topological differences in brain networks.
- Comparative EEG analyses demonstrate significant connectivity differences, notably between ADHD subjects and controls in the gamma frequency band.
Spectral Topological Data Analysis of Brain Signals
Introduction
The paper "Spectral Topological Data Analysis of Brain Signals" (2401.05343) introduces a novel approach for analyzing brain connectivity using topological methods in the spectral domain. The traditional methods typically rely on simplistic measures such as Pearson correlation and often utilize arbitrary thresholds leading to potentially biased connectivity analysis. The proposed Spectral Topological Data Analysis (STDA) aims to address these limitations by leveraging coherence for evaluating frequency-specific functional connectivity, thereby capturing detailed and nuanced information about brain networks. This method extends the capabilities of topological data analysis (TDA) by not only uncovering pairwise interactions but also identifying higher order interactions among brain regions.
The Limitations of Conventional Approaches
Conventional analyses of brain connectivity often involve examining networks through summary metrics like modularity, centrality, and node degree post-thresholding. However, this thresholding introduces bias and oversimplifies complex networks, potentially leading to erroneous conclusions. As described in prior studies, such oversimplification can significantly impact the identification of connectivity patterns in neuroscientific data (Figure 1).
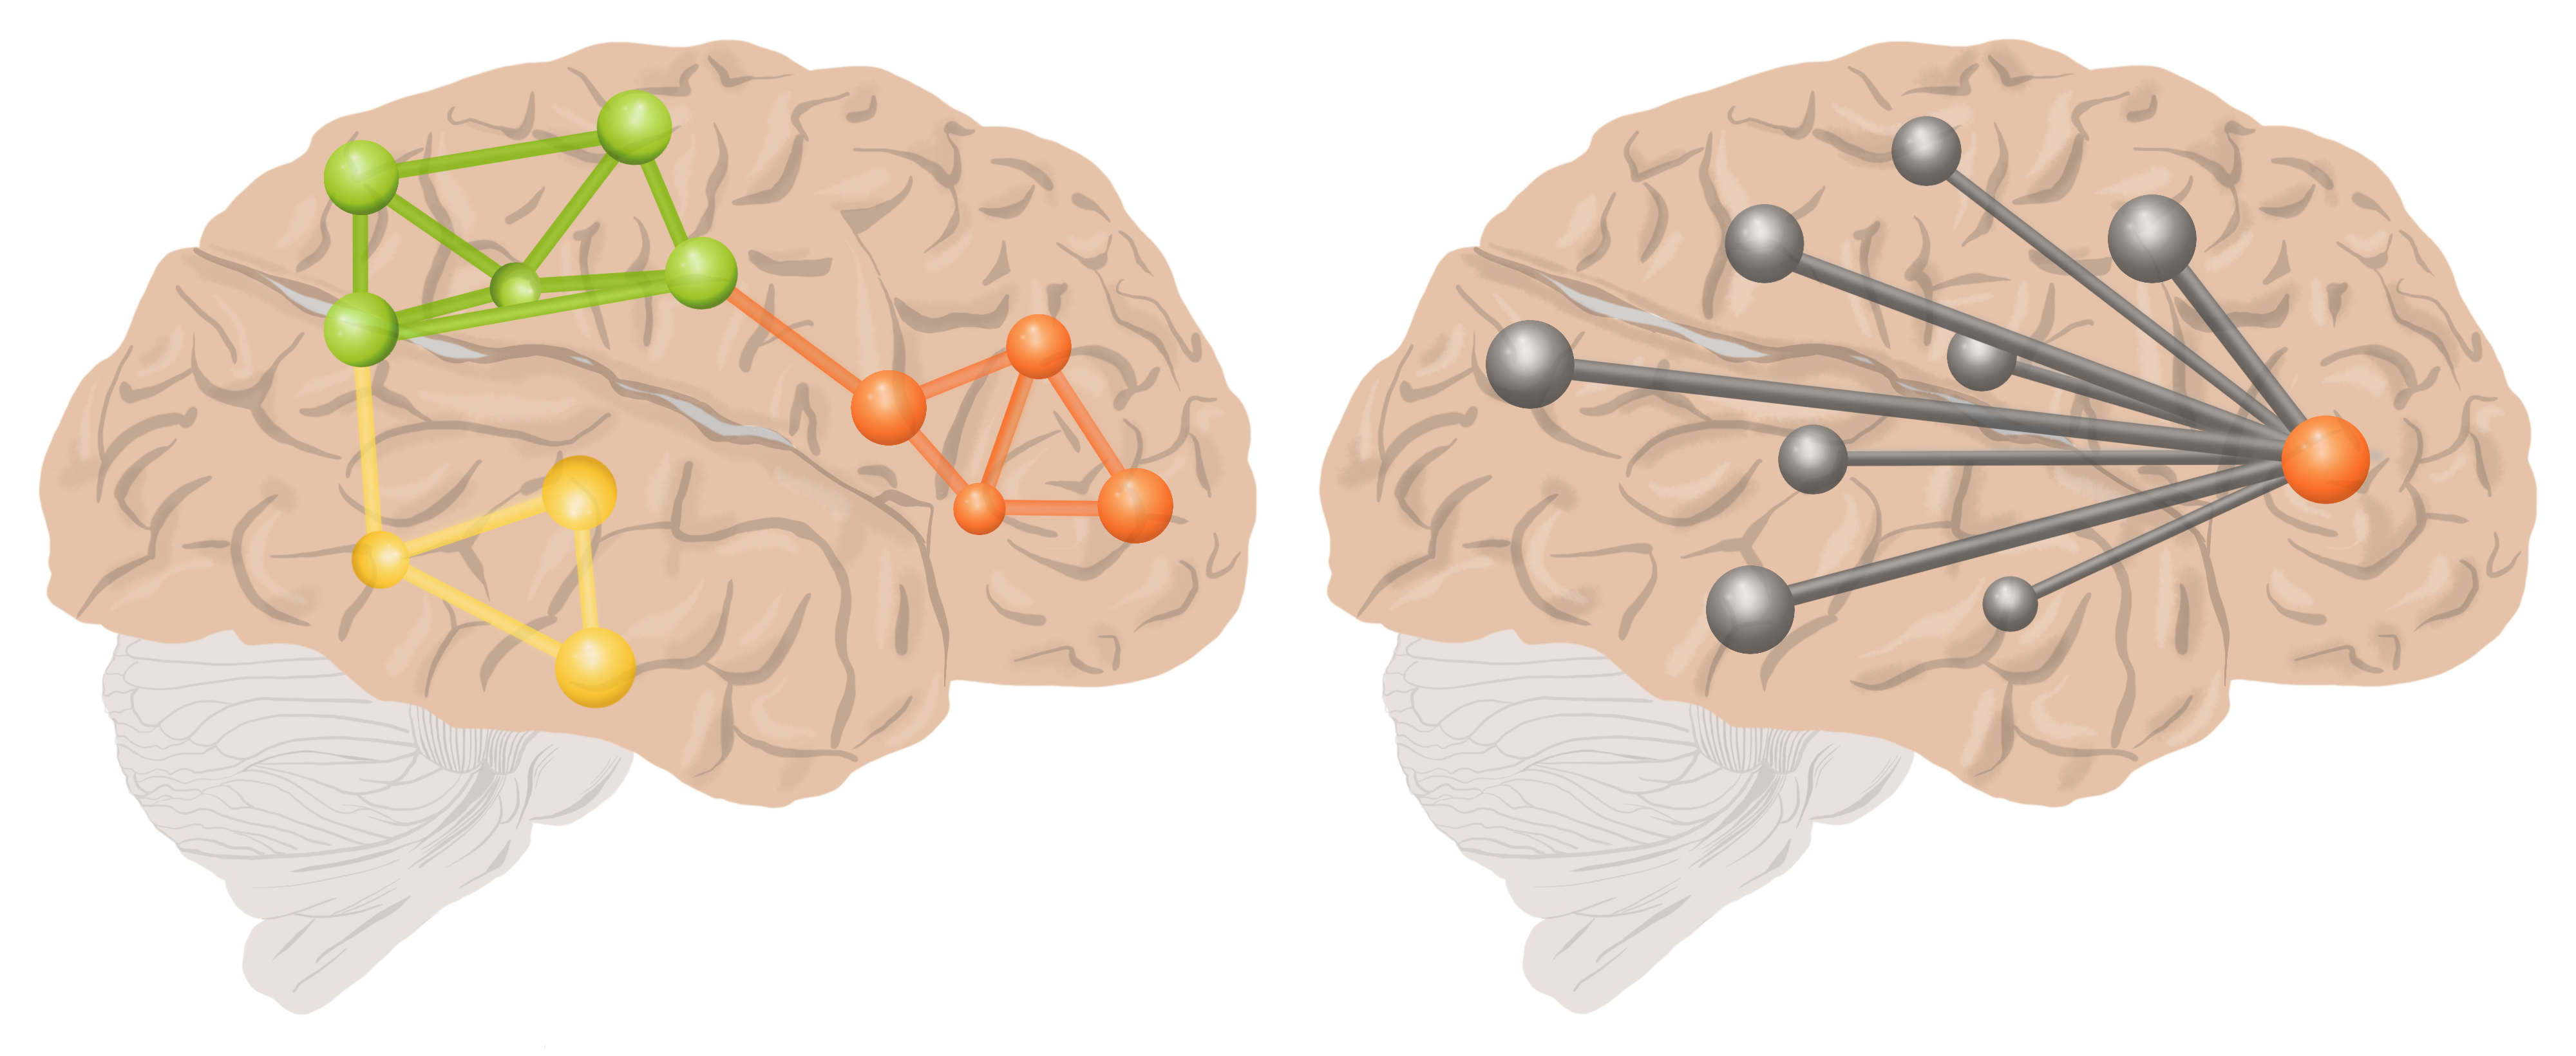
Figure 1: An Example of two networks. Left: emphasizing high modularity. Right: emphasizing high centrality.
Another major limitation lies in the use of correlation measures, which fail to capture frequency-specific interactions vital for understanding brain signal synchronization.
Spectral Topological Data Analysis
The STDA framework overcomes the limitations described by developing a coherence-based frequency-specific model of brain connectivity. This involves constructing Rips filtrations for brain networks at varying frequency bands, offering a more intricate depiction of connectivity dynamics across the entire network structure. In doing so, STDA detects higher-order interactions beyond pairwise connections, capturing the network's evolving topology (Figure 2).
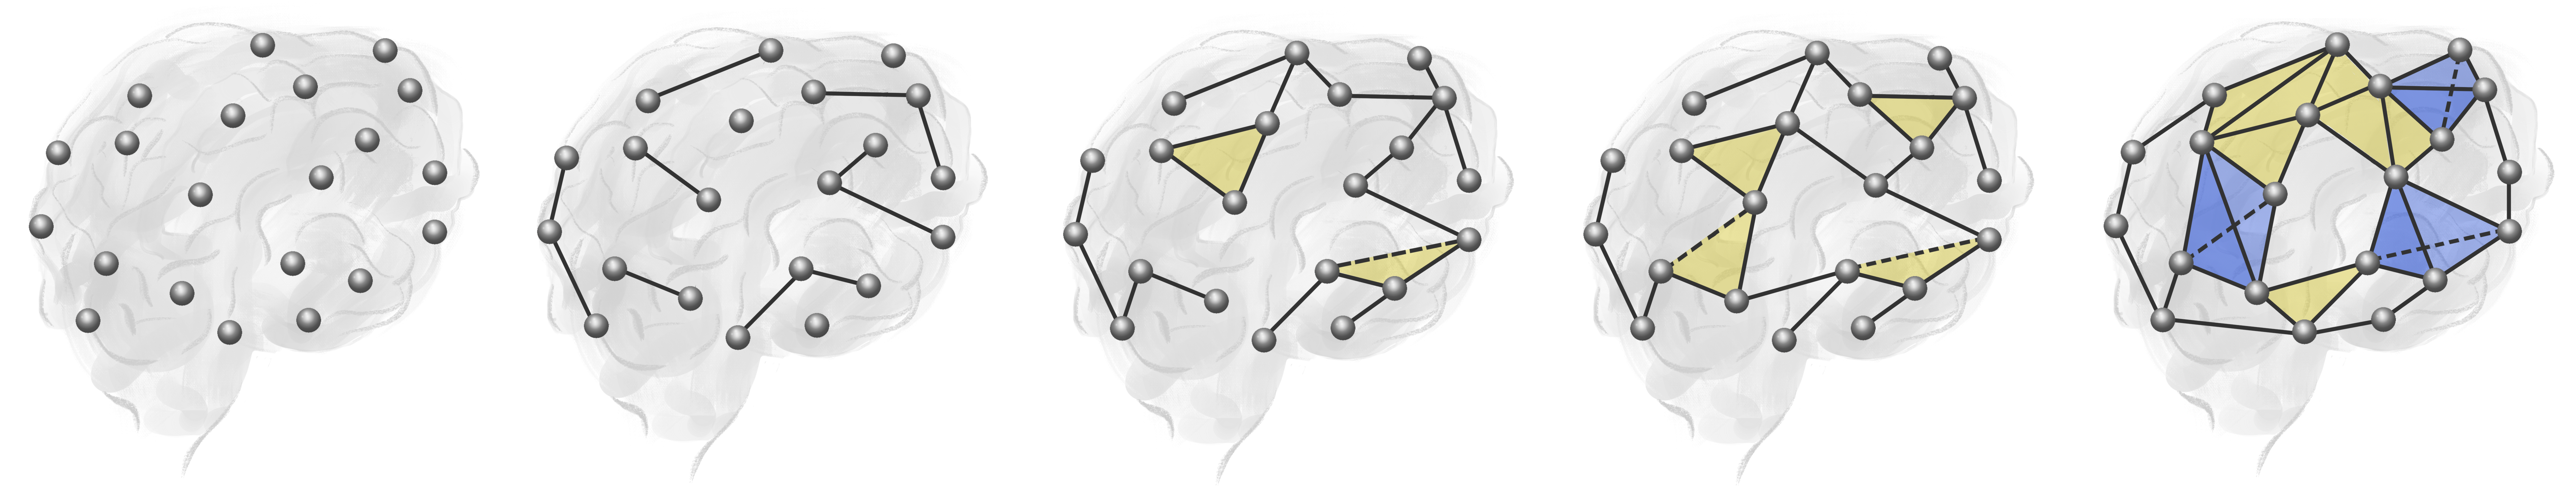
Figure 2: Illustration of the TDA approach to network analysis, encompassing multiple threshold values and forming a nested sequence of networks.
The paper introduces spectral landscapes, a novel 2D generalization of persistence landscapes, encapsulating frequency-specific topological summaries. Spectral landscapes enable the identification and comparison of topological structures across different spectra, providing richer analytical insights than persistence diagrams or traditional landscape representations.
Numerical Simulations and Data Application
A series of simulations were conducted to evaluate the efficacy of STDA, simulating multivariate EEG signals adherent to distinct structural patterns across frequency bands. These simulations demonstrated that spectral landscapes effectively capture topological distinctions and dissimilarities, revealing significant contrasts between scenarios that conventional approaches might overlook (Figure 3).
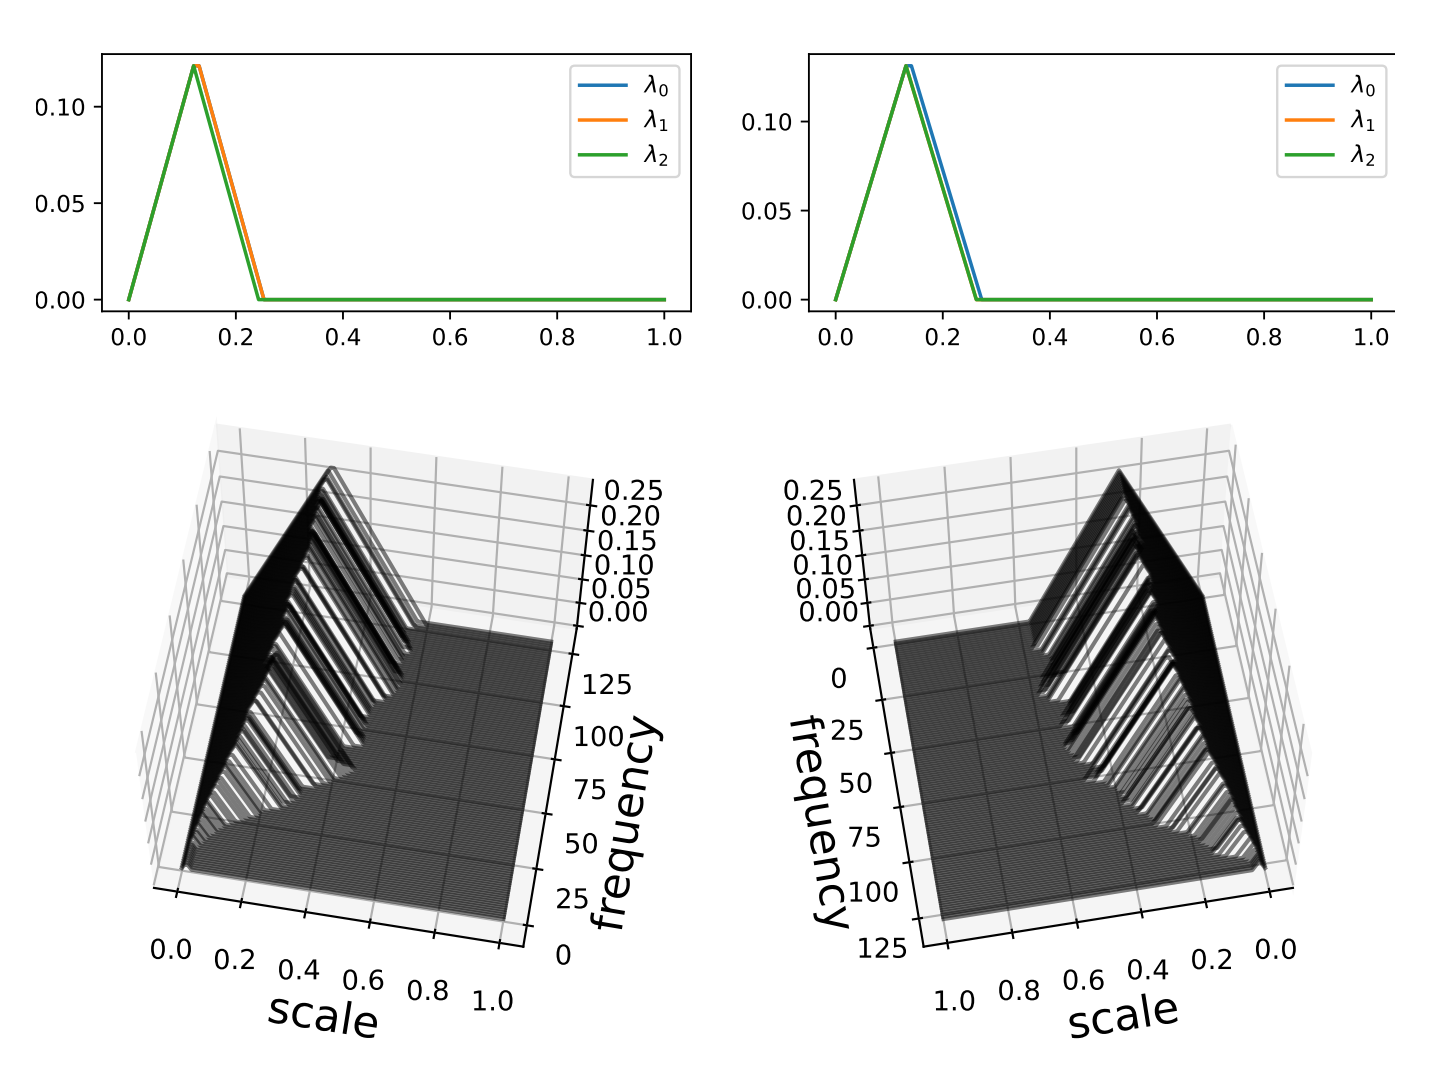
Figure 3: Example: Comparing TDA on Coherence vs. TDA on Correlation. Top: Traditional Persistence Landscapes (correlation-based) for low (Left) and high (Right) frequencies, which fail to distinguish the two examples. Bottom: Spectral Landscapes (coherence-based) offer richer summaries that distinguish the two examples.
In real-world data application, comparisons between standard EEG data from controls and ADHD subjects using spectral landscapes revealed frequency-specific alterations in their brain connectivity. Particularly in the gamma frequency band, statistically significant changes were detected in both cluster formations and cyclic dependence, providing insights into cognitive impairments associated with ADHD (Figure 4).
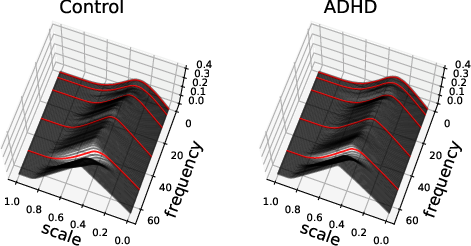
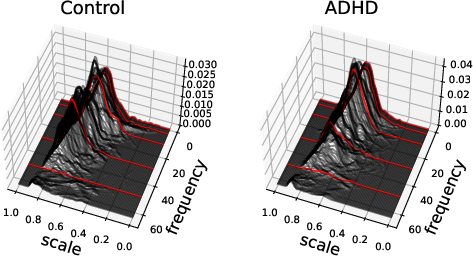
Figure 4: Estimated population mean spectral landscape for the 0-dimensional homology group. Left: control group. Right: ADHD group. The red lines delimit the various frequency bands.
Conclusion
The findings presented in the paper demonstrate the potential of spectral topological data analysis for uncovering intricate brain network patterns that traditional methods may overlook. By incorporating frequency-specific coherence measurements, STDA provides a more comprehensive and discriminating analysis of brain connectivity. The development of spectral landscapes and the accompanying testing framework offer robust statistical methodologies vital for evaluating topological differences in brain dependence structures, such as those observed between ADHD patients and healthy controls. This approach may pave the way for deeper understanding and novel insights into the neural dynamics underlying cognitive disorders, enhancing diagnostic precision and therapeutic strategies.
