- The paper finds that the HAR econometric model delivers superior daily forecasts while deep learning models excel in high-frequency volatility prediction.
- It employs both traditional models like GARCH/HAR and advanced RNN, LSTM, and GRU architectures, using QLIKE alongside other metrics for robust evaluation.
- The study highlights the need for frequency-specific model selection, balancing interpretability with data-driven responsiveness for risk management and trading.
Comparative Analysis of Econometric and Deep Learning Models for COMEX Copper Futures Volatility Forecasting
Introduction
The paper "COMEX Copper Futures Volatility Forecasting: Econometric Models and Deep Learning" (2409.08356) conducts a rigorous empirical comparison between traditional econometric models—namely GARCH and HAR—and modern deep learning-based recurrent neural networks (RNN, LSTM, GRU) for forecasting realized volatility of COMEX copper futures. Both daily and high-frequency (hourly) data scenarios are examined, employing robust forecasting evaluation metrics, with a primary emphasis on the QLIKE loss function.
Volatility forecasting in copper markets carries both macroeconomic and financial significance due to copper's role as an industrial barometer, its financialization, and its fundamental link with both commodity and equity markets. The accurate prediction of volatility is thus integral to derivative pricing, risk management, and trading strategy design.
Methodological Framework
The econometric approach utilizes GARCH(1,1) to capture volatility clustering and long-memory, and the HAR structure to explicitly model multi-horizon dependencies in realized volatility. These models offer interpretability and have established efficacy in financial time series analysis.
On the deep learning front, the paper implements RNN, LSTM, and GRU architectures to leverage their capacity for sequential pattern recognition in time series data. State dependencies, gating mechanisms, and architectural nuances are carefully considered, with hyperparameters subjected to practical constraints (e.g., window size, batch size, learning rate). For both modeling paradigms, the predictive comparison is benchmarked using MSE, RMSE, MAE, MAPE, and QLIKE metrics, in line with best practices in volatility forecasting evaluation (cf. Patton, 2011).
An outline of the employed deep learning architectures is depicted below.
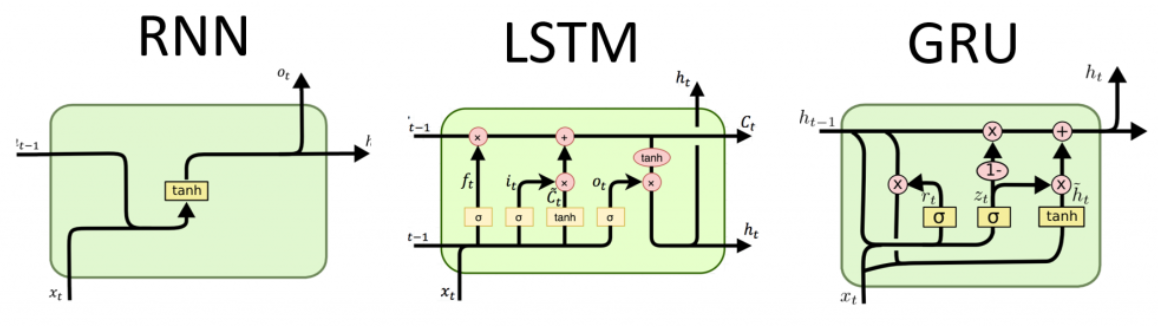
Figure 1: RNN, LSTM, and GRU architectures as utilized for volatility forecasting.
Data and Statistical Diagnostics
The study leverages an extensive dataset of daily COMEX copper futures (5777 observations, 2000–2023) and high-frequency intraday (hourly, minute-level, ~100,000 samples for 2023). Volatility is computed as realized variance via squared returns for daily and summed squared minute-returns for hourly. Stationarity, non-normality, and ARCH effects are confirmed through ADF, Jarque-Bera, and Ljung-Box tests, ensuring the suitability of volatility models.
Daily Frequency
For daily realized volatility, the HAR model exhibits marked superiority across most loss functions, especially in terms of QLIKE (2.39E-09), substantially outperforming both GARCH and all deep RNN variants. GARCH achieves better results than deep learning only in RMSE/short-horizon scenarios. The deep architectures (RNN, LSTM, GRU) demonstrate comparable but inferior performance to econometric models, exhibiting higher volatility and less robustness in long-horizon daily forecasting.
The visual evidence further corroborates the numerical findings: although all models broadly follow the regime shifts in volatility, the HAR and realized-GARCH models capture structure more smoothly and with less overshooting compared to RNN-based models.
Hourly Frequency
At the hourly scale, the modeling landscape shifts. Deep RNN-based models achieve QLIKE values similar to HAR (3.4E-11 vs. 3.4E-11), while dramatically outperforming GARCH (5.2E-11) on both accuracy and responsiveness. This demonstrates a fundamental regime change: for high-frequency volatility, deep learning models surpass GARCH and match HAR, owing to their flexibility and ability to incorporate subtle dependencies present in dense intraday data.
Loss Function Trend and Forecast Horizon
Analysis across multiple forecast horizons (1-day to 90-day ahead windows) reveals that GARCH’s lead with short-term RMSE vanishes as the horizon increases; the recurrent models’ errors increase less steeply with forecast horizon than GARCH’s do. QLIKE trend analysis shows that deep learning models close the gap with GARCH in long-term scenarios but never exceed the stability of HAR, which remains robustly superior across all horizons and metrics.
Theoretical and Practical Implications
These results suggest nontrivial implications for practitioners and researchers:
- Model selection should be frequency-dependent: Econometric models, especially HAR, remain optimal for daily volatility forecasting, while deep learning models become competitive or dominant for high-frequency intraday volatility.
- Deep models capture microstructure-induced volatility: The superior performance of RNN, LSTM, and GRU for hourly volatility implies they are better suited to integrate microstructural signals, adapt to abrupt changes, and absorb nonlinear interactions present in high-frequency trading environments.
- Transparency versus black-box tradeoff: Econometric models retain their interpretability and are favored for risk management and regulatory applications, while deep models, though lacking in interpretability, offer gains in responsiveness, particularly when forward-looking windows are extended.
- Loss function choice matters: QLIKE's volatility sensitivity confirms it is the preferred metric for volatility model evaluation.
Future Directions
Potential advancements include composite hybrid models that fuse HAR’s structure with the nonlinearity of deep embeddings, transfer learning from related commodity or macro asset classes, and incorporating exogenous variables (e.g., macro news, inventory shocks). Exploring explainable AI approaches to probe the internal mechanisms of high-performing "black-box" deep architectures in volatility forecasting is another promising avenue.
Conclusion
The paper establishes that while RNN-based deep learning architectures attain parity with traditional models in high-frequency realized volatility forecasting, the HAR model remains the most statistically robust for daily horizons, achieving QLIKE values an order of magnitude lower than alternatives. The findings corroborate the view that model selection for volatility forecasting must be context- and frequency-specific, balancing statistical interpretability with data-driven adaptivity. HAR serves as a de facto performance benchmark in this space, while deep learning architectures provide superior handling of nonstationary, high-frequency regimes and warrant further exploration in real-time trading applications.