- The paper presents the VisualTimeAnomaly benchmark that transforms time series data into images, enabling MLLMs to detect point-wise, range-wise, and variate-wise anomalies.
- Findings show high-performing models like GPT-4o excel in multivariate anomaly detection and remain robust even when up to 25% of data is missing.
- The study highlights challenges such as decreased accuracy in high-dimensional contexts and model hallucinations, urging improvements in image construction and model design.
Implementing Multimodal LLMs for Time Series Anomaly Detection
The paper "Can Multimodal LLMs Perform Time Series Anomaly Detection?" explores the potential of multimodal LLMs (MLLMs) in detecting anomalies within time series data by transforming numerical time series into visual images. The authors introduce a benchmark called VisualTimeAnomaly designed to evaluate MLLMs on time series anomaly detection (TSAD). This essay delineates the practical implementation aspects of MLLMs in the context of time series anomaly detection, along with insights from empirical results.
VisualTimeAnomaly Benchmark Overview
VisualTimeAnomaly aims to bridge the gap between time series data and multimodal analysis by leveraging visual representations. It converts time series data into images, thus allowing MLLMs, which are proficient in handling visual inputs, to perform anomaly detection tasks. The benchmark encompasses real-world and synthetic datasets with three anomaly types across multiple scenarios: point-wise, range-wise, and variate-wise anomalies, within both univariate and multivariate time series contexts.
Image Construction
A core aspect of integrating MLLMs into TSAD involves transforming time series data into images:
- Univariate Time Series: Anomalies like global spikes, contextual anomalies, and trend deviations are visualized using marked lines and shaded areas within plots representing time series values over time.
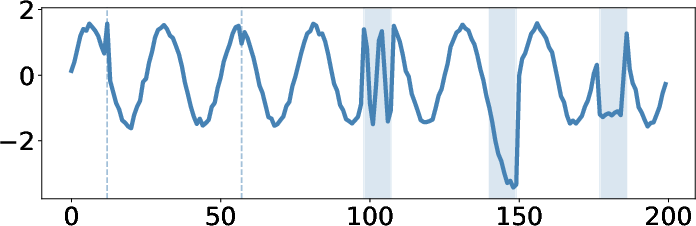
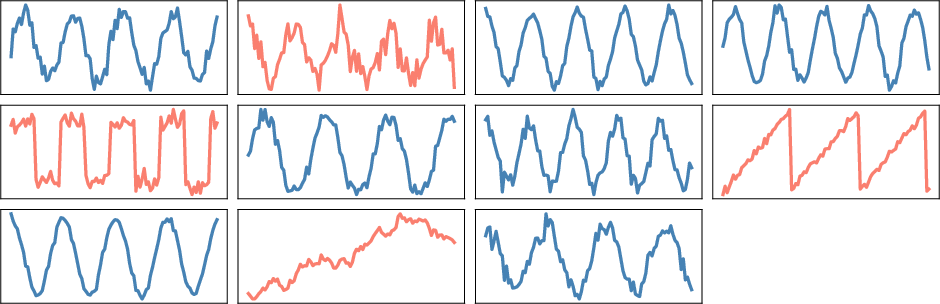
Figure 1: The illustration of point-wise, range-wise, and variate-wise anomalies.
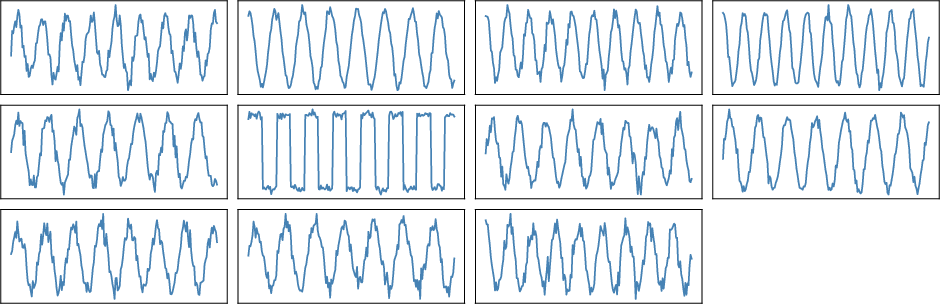
- Multivariate Time Series: Individual variates are represented as subplots within a grid, allowing the simultaneous display of multiple dimensions. This aids in capturing inter-variable relationships essential for detecting variate-wise anomalies.
Anomaly Detection Prompts
To enable anomaly detection, specific prompts are designed to guide MLLMs through recognizing anomaly types in the visual representation:
Empirical Insights and Implementation
Key Strengths and Capabilities
- Robust Image-based Anomaly Detection: MLLMs, particularly strong in image understanding, show improved performance in detecting range-wise and variate-wise anomalies due to the coarse-grained patterns presented visually.
- Model Performance Comparison: Proprietary models such as GPT-4o exhibit superior multivariate anomaly detection compared to open-source alternatives, suggesting high accuracy in inter-variable relationship capture.
- Irregular Time Series Resilience: MLLMs demonstrate robustness against irregular sampling by maintaining performance when up to 25% of data is missing, indicating effective visual pattern recognition even with incomplete data.
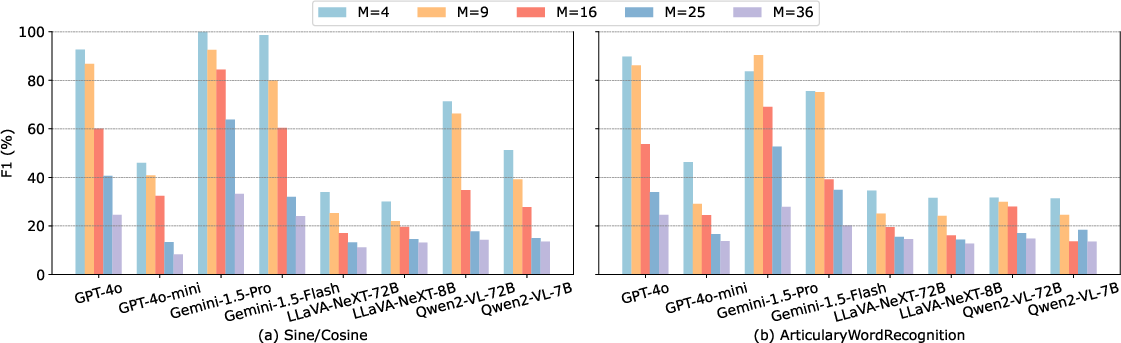
Figure 3: The impact of number of dimensions M on MLLMs for variate-wise anomalies.
Limitations and Future Directions
- Dimensionality Impact: Increased dimensionality in multivariate series decreases detection accuracy due to information saturation, affecting resolution and clarity in the visual representation.
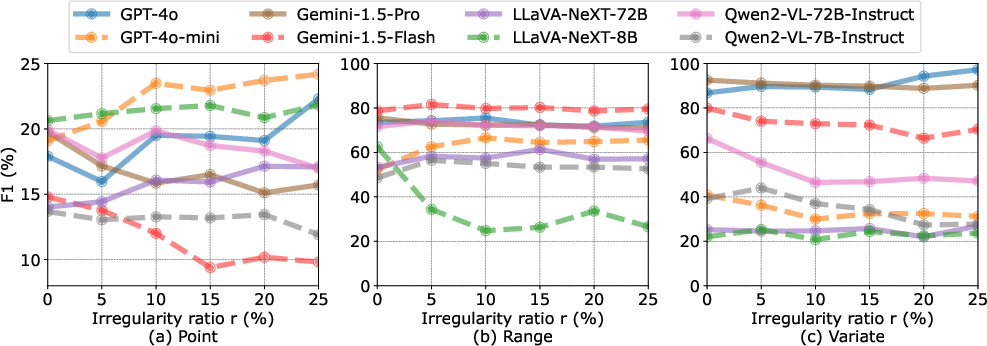
Figure 4: The impact of the irregularity ratio r on MLLMs for point-wise, range-wise, and variate-wise anomalies.
- Model Hallucinations: Lower scale models are prone to generate hallucinated outputs, particularly for complex multivariate prompts, underscoring the need for model refinement and prompt clarity enhancement.
- Visualization and Model Improvements: Future efforts should focus on refining image construction methods and exploring adaptive models that handle high-dimensional inputs without loss of accuracy.
Conclusion
The exploration of MLLMs for TSAD reveals promising avenues for integrating visual data representation in anomaly detection tasks. The VisualTimeAnomaly benchmark provides a structured approach to evaluate model effectiveness and highlights areas for improvement in handling complex, real-world datasets. As researchers move forward, focusing on multimodal alignment and prompt strategies will be critical to advancing the capability and reliability of MLLMs in time series anomaly detection and beyond.