- The paper introduces a novel multivariate time series approach that uses patient similarity metrics for early detection of multidrug resistance.
- It combines techniques like DTW, TCK, PCA, and autoencoders to capture patient dynamics and reduce data dimensionality.
- The framework achieved an ROC-AUC of 81% and identified high-risk patient clusters, providing actionable insights for ICU interventions.
Early Detection of Multidrug Resistance Using Multivariate Time Series Analysis and Interpretable Patient-Similarity Representations
Introduction
The paper "Early Detection of Multidrug Resistance Using Multivariate Time Series Analysis and Interpretable Patient-Similarity Representations" (2504.17717) presents a novel approach to predicting Multidrug Resistance (MDR) in Intensive Care Unit (ICU) settings. This study addresses the need for accurate and interpretable models to forecast MDR, leveraging the wealth of data contained in Electronic Health Records (EHRs).
Methodology
The approach employs a Multivariate Time Series (MTS) analysis to model patient data, capturing the dynamic nature and temporal dependencies crucial for predicting MDR. The authors focus on patient similarity representations, where each patient's clinical trajectory is modeled using MTS-based similarity metrics such as Dynamic Time Warping (DTW) and the Time Cluster Kernel (TCK).
The study applies dimensionality reduction (DR) methods and kernel transformations to enhance model performance while ensuring interpretability. Techniques like Principal Component Analysis (PCA) and Autoencoders (AE) are deployed, facilitating the extraction of lower-dimensional representations that maintain the essential structure needed for classification tasks. The proposed architecture is validated with ICU data from the University Hospital of Fuenlabrada, yielding notable insights.
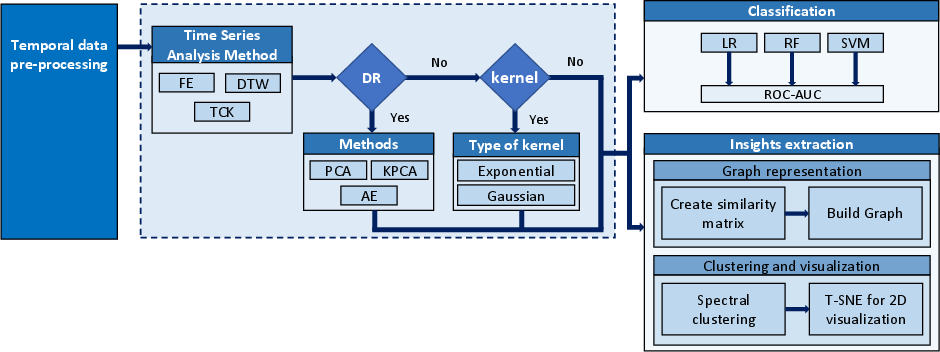
Figure 1: Architectural workflow that integrates time series analysis techniques with DR methods and kernel transformations, aimed at the classification of patients with MDR and the extraction of valuable insights, via graph representation, clustering, and visualization.
Implementation Details
The implementation strategy consists of several key stages. Firstly, MTS-based similarity metrics are used to generate patient-to-patient similarity networks. This includes employing DTW to accommodate temporal misalignments in patient data sequences and TCK to handle missing data robustly.
The similarity data is input into classical Machine Learning classifiers such as Logistic Regression (LR), Random Forest (RF), and Support Vector Machine (SVM), which are chosen for their simplicity and interpretability. The classification models are augmented with DR techniques to balance high-dimensional data representation against computational efficiency.
In the visualization phase, graph-based methods including spectral clustering and t-SNE are applied to unravel MDR-related patterns and visualize high-risk patient clusters, offering actionable insights for clinical interventions.
Results and Discussion
The proposed method achieved a Receiver Operating Characteristic Area Under the Curve (ROC-AUC) of 81%, surpassing traditional ML and deep learning models applied to the same dataset. The study highlights the effectiveness of graph-based patient similarity in improving both predictive performance and interpretability.
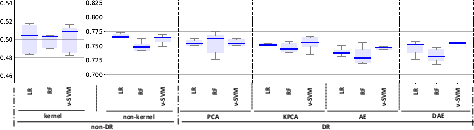
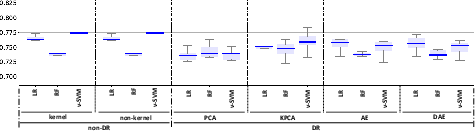
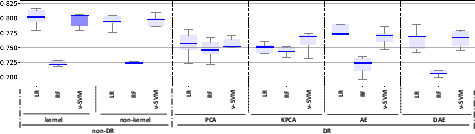
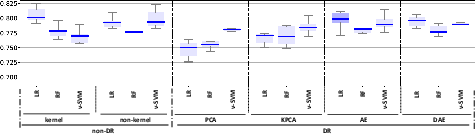
Figure 2: ROC-AUC values for the classification models (LR, RF, and nu-SVM) when considering non-DR (original space and kernel transformations) and DR methods (PCA, KPCA, AE, and DAE) for: (a) FE; (b): TCK; (c) DTW_D; (d) DTW_I. Box-plots with the best results in terms of median ROC-AUC with and without DR have been highlighted in dark blue.
The visualization approaches using t-SNE and clustering techniques revealed distinct patient subgroups associated with varying levels of MDR risk. Specifically, higher prevalence of resistance was identified in clusters characterized by extended ICU stays and significant antibiotic exposure, confirming clinical observations regarding risk factors for MDR.
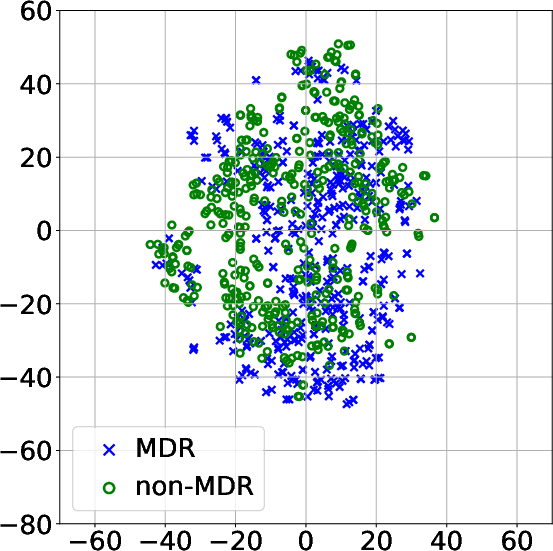
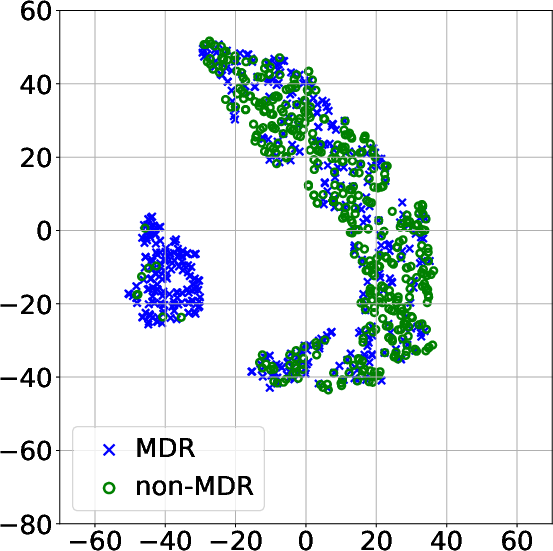
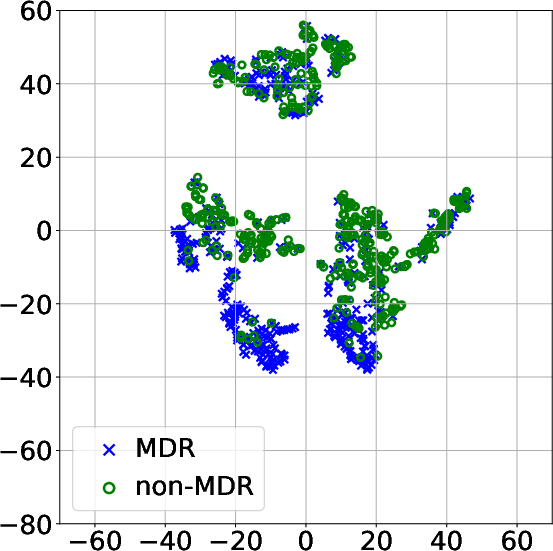
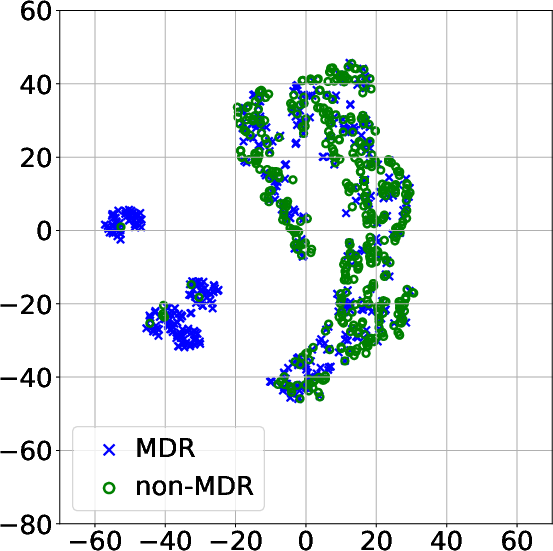
Figure 3: Projection of patient data onto a 2D space using t-SNE after modeling the MTS with: (a) FE and PCA; (b) DTW_D and exponential kernel; (c) DTW_I and AE; (d) TCK without DR.
Conclusion
This study provides a comprehensive framework for the early detection of MDR through interpretable MTS analysis and patient similarity representations. The marriage between robust prediction and enhanced feature interpretability offers significant potential for optimizing treatment protocols in critical care environments. While the model demonstrates high performance and utility in the studied context, future work could focus on external validation and adaptation for diverse hospital settings, potentially incorporating additional clinical and demographic features to enhance generalizability and applicability in varied clinical landscapes.