- The paper introduces IFScale to benchmark LLMs under high-density instructions, revealing accuracy degradation and primacy effects.
- It shows that even top-performing models achieve only 68% accuracy at maximum density, with distinct decay patterns observed.
- The study analyzes error types, efficiency trade-offs, and the role of reasoning parameters in generating coherent business reports.
IFScale: Evaluating Instruction Following at High Densities
The paper "How Many Instructions Can LLMs Follow at Once?" (2507.11538) introduces IFScale, a benchmark designed to evaluate the instruction-following capabilities of LLMs under high instruction densities. The study assesses 20 state-of-the-art models across seven providers, using a business report writing task with up to 500 keyword-inclusion instructions. The findings reveal that even the best models achieve only 68% accuracy at the maximum density, highlighting performance degradation patterns, biases towards earlier instructions, and distinct error categories.
IFScale Benchmark Design
IFScale requires LLMs to generate a professional business report while adhering to a set of keyword-inclusion instructions, scaling from 10 to 500 instructions. The keywords are extracted from U.S. SEC 10-K filings and filtered based on Zipf frequency and semantic redundancy to ensure business relevance and diversity. The difficulty of each term is estimated by averaging exp(−avg_logprob) over three zero-temperature gpt-4.1-nano completions.
(Figure 1)
Figure 1: Model instruction-following accuracy across increasing densities, averaged over 5 runs.
The implementation involves constructing prompts with sampled keywords, employing retry logic for incoherent reports, and evaluating adherence via regular expression matching. The evaluation methodology assesses omission and modification errors, quantifies primacy effects by partitioning instruction lists, and computes standard deviation across multiple runs.
The study identifies three distinct accuracy degradation patterns: threshold decay, linear decay, and exponential decay. Threshold decay is observed in reasoning models like gemini-2.5-pro and o3, where performance remains stable until a critical density, followed by a steeper decline. Linear decay, characterized by a steady decline, is exemplified by gpt-4.1 and claude-3.7-sonnet. Exponential decay, marked by rapid early degradation, is seen in models like claude-3.5-haiku and llama-4-scout.
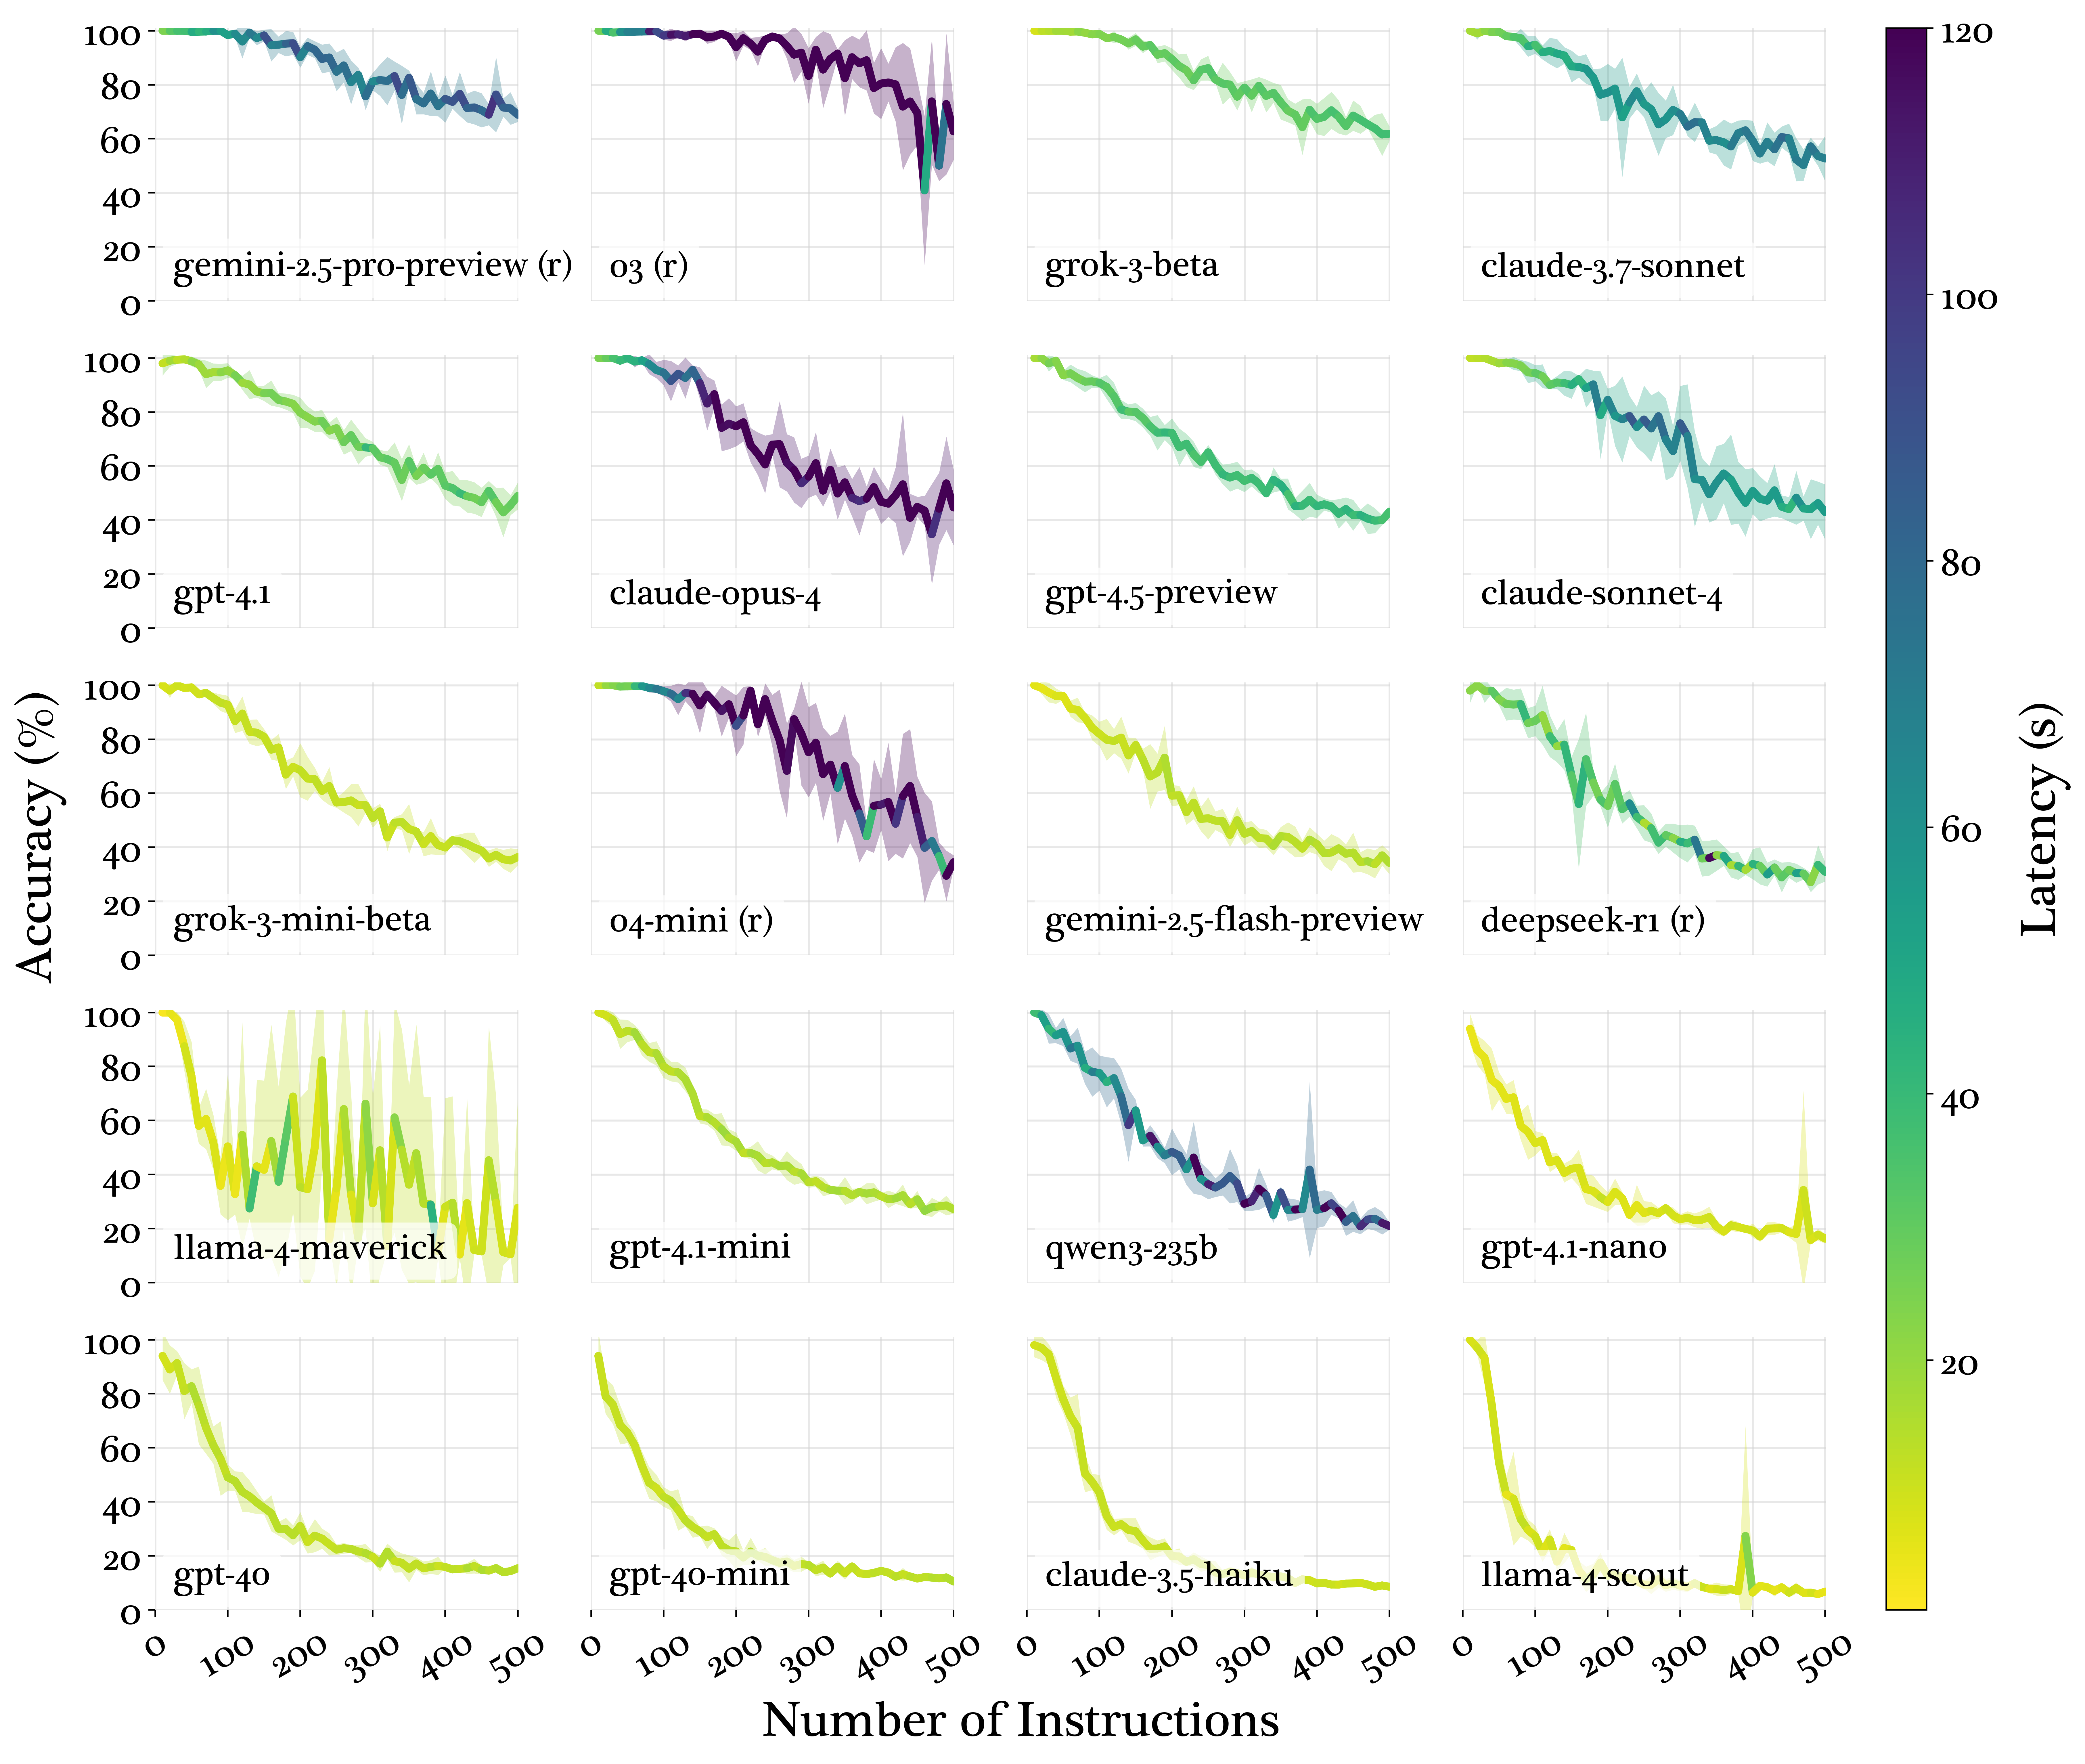
Figure 2: Model performance degradation as instruction density increases from 10 to 500 instructions, with line coloring representing generation latency and shading indicating pm 1 standard deviation across five runs.
Variance patterns reveal that top-performing models exhibit increasing variance, mid-tier models show mid-range variance peaks, and the worst-performing models display immediate variance decreases. This suggests that variance decreases as models collapse under cognitive load.
Primacy Effects and Efficiency
Primacy effects, where earlier instructions are better satisfied, peak around 150-200 instructions before diminishing at extreme densities, indicating a shift from selective to uniform failure.
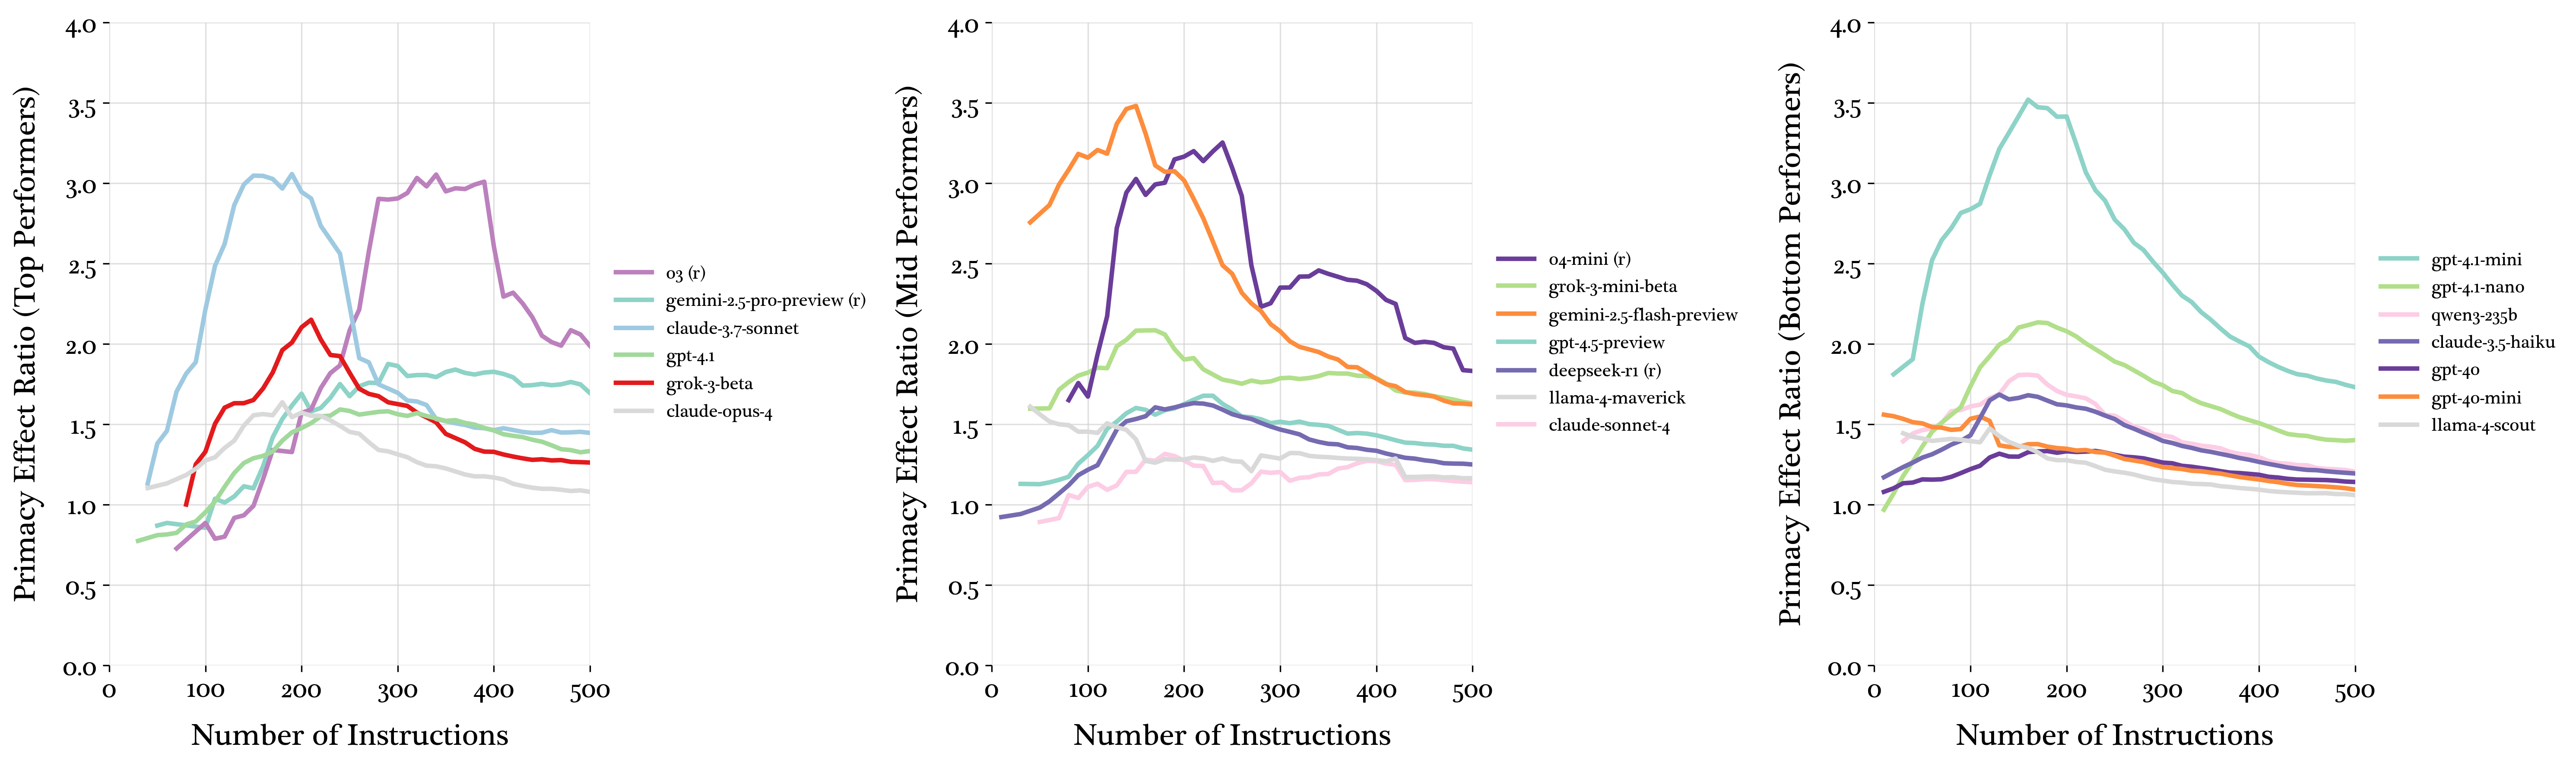
Figure 3: Primacy effect ratios showing universal attention degradation patterns regardless of instruction-following performance.
Efficiency analysis, measured by the accuracy-to-latency ratio, demonstrates that smaller models like grok-3-mini and gpt-4.1-nano achieve higher efficiency, compensating for accuracy losses with computational speed. Reasoning models exhibit substantial latency increases under cognitive load.
Error Type Analysis
Error analysis reveals that models overwhelmingly err toward omission errors as instruction density increases. Reasoning models like o3 and o4-mini maintain lower omission-to-modification ratios, indicating an attempt to satisfy instructions through modifications rather than complete omission.
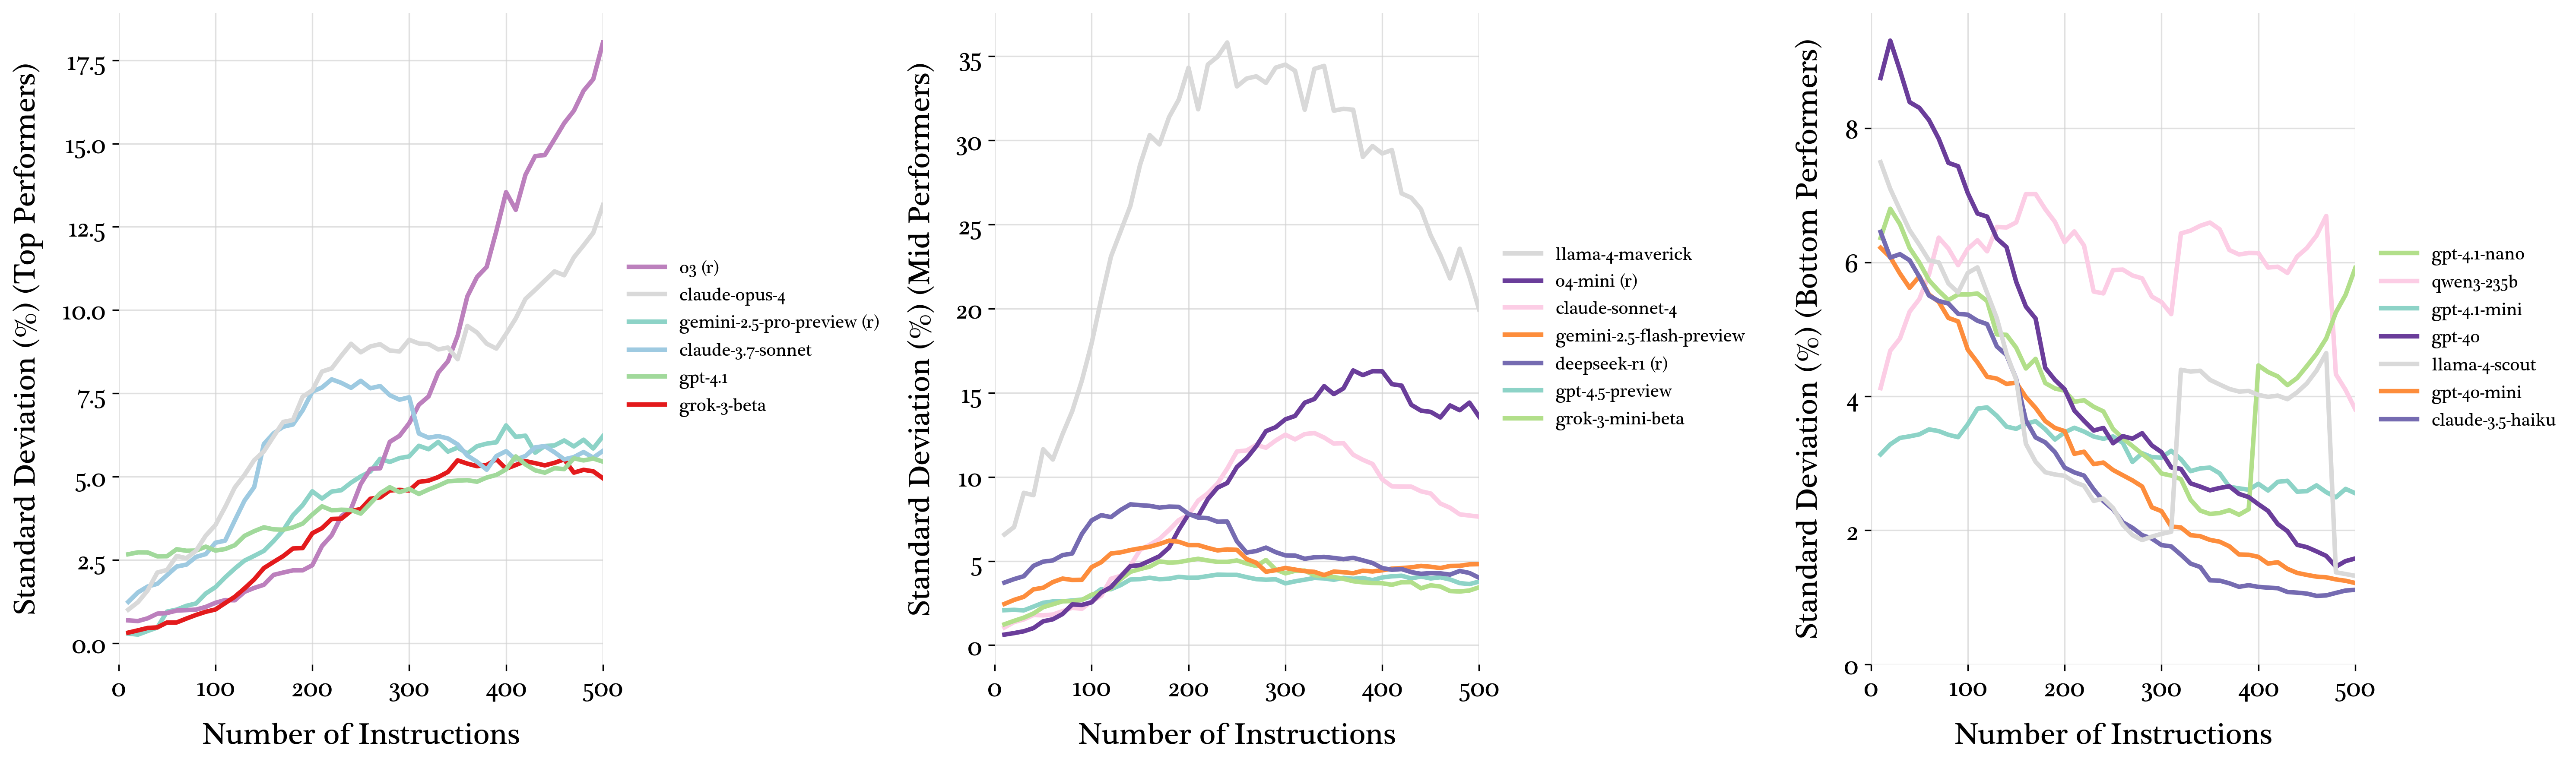
Figure 4: Performance variance patterns revealing three distinct behaviors.
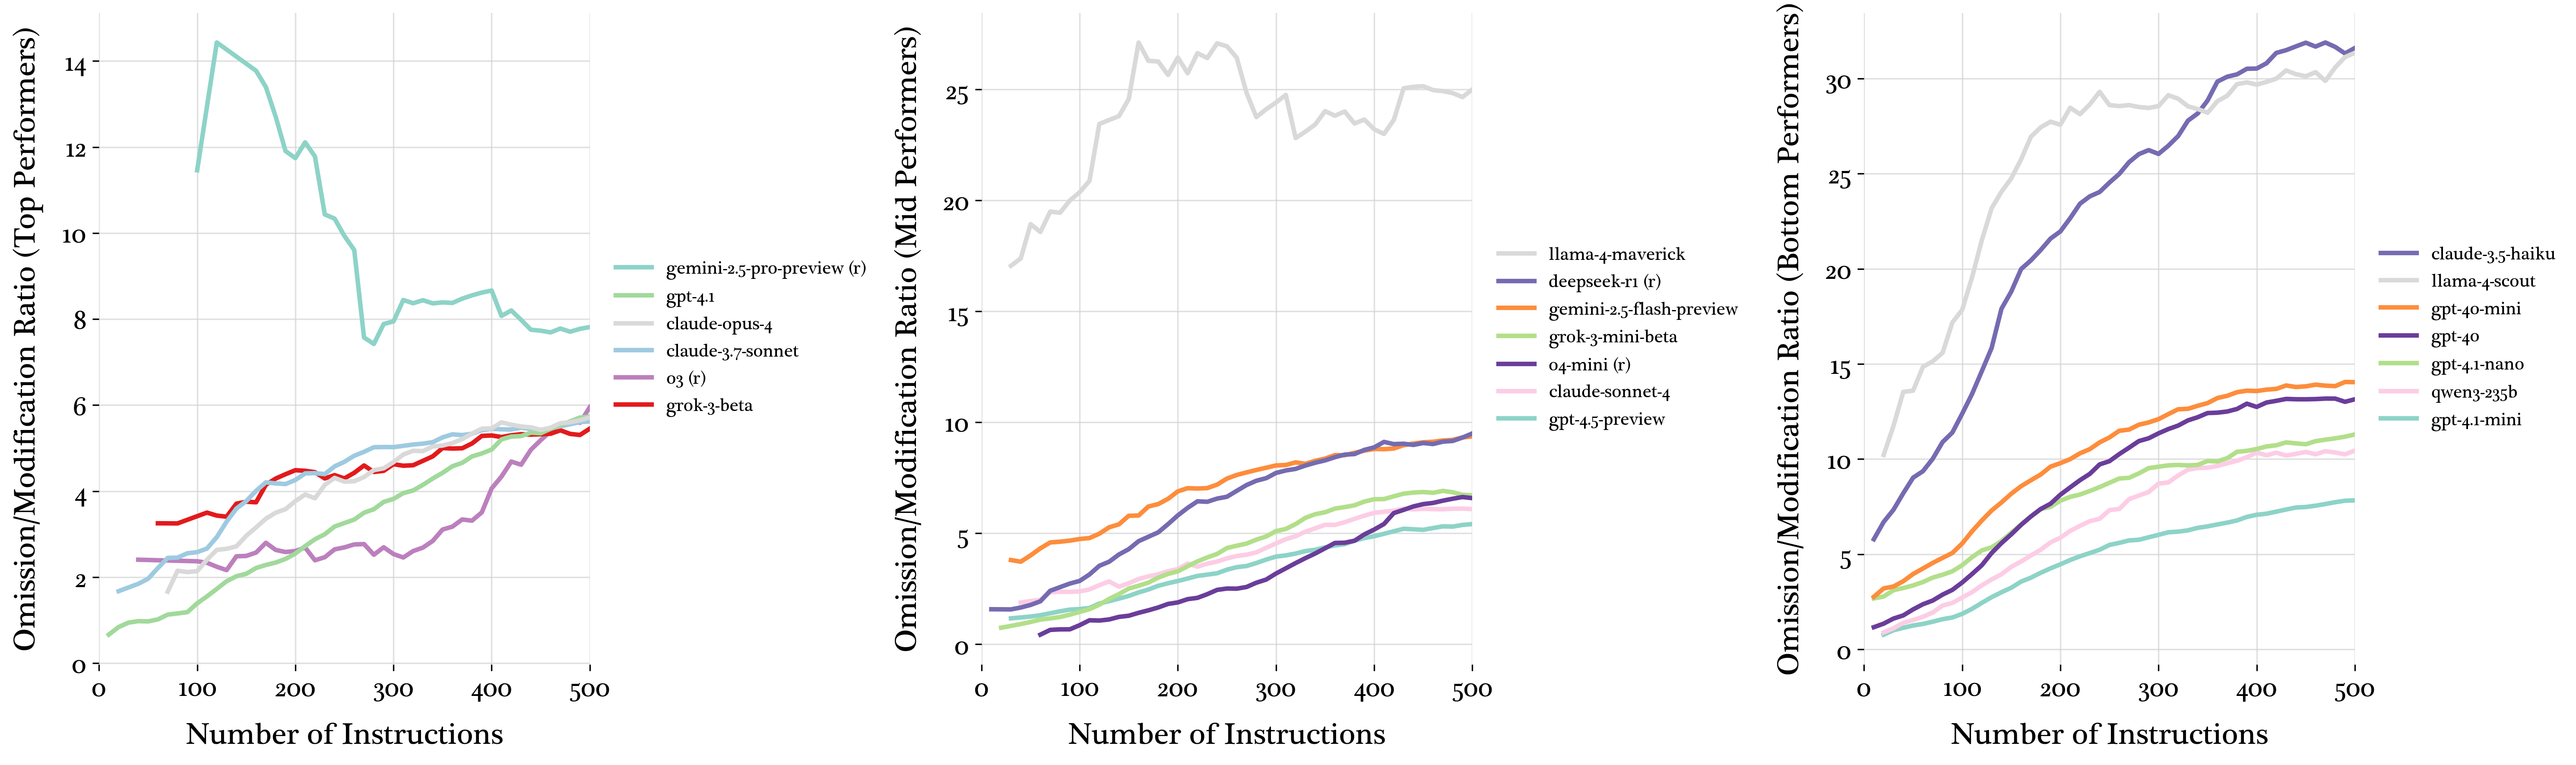
Figure 5: Omission to modification error ratio patterns across instruction densities.
The coherence of the generated business reports is evaluated using o4-mini, revealing that most models maintain coherence, while o3 and o4-mini show marked declines due to their reluctance to generate a large amount of output tokens.
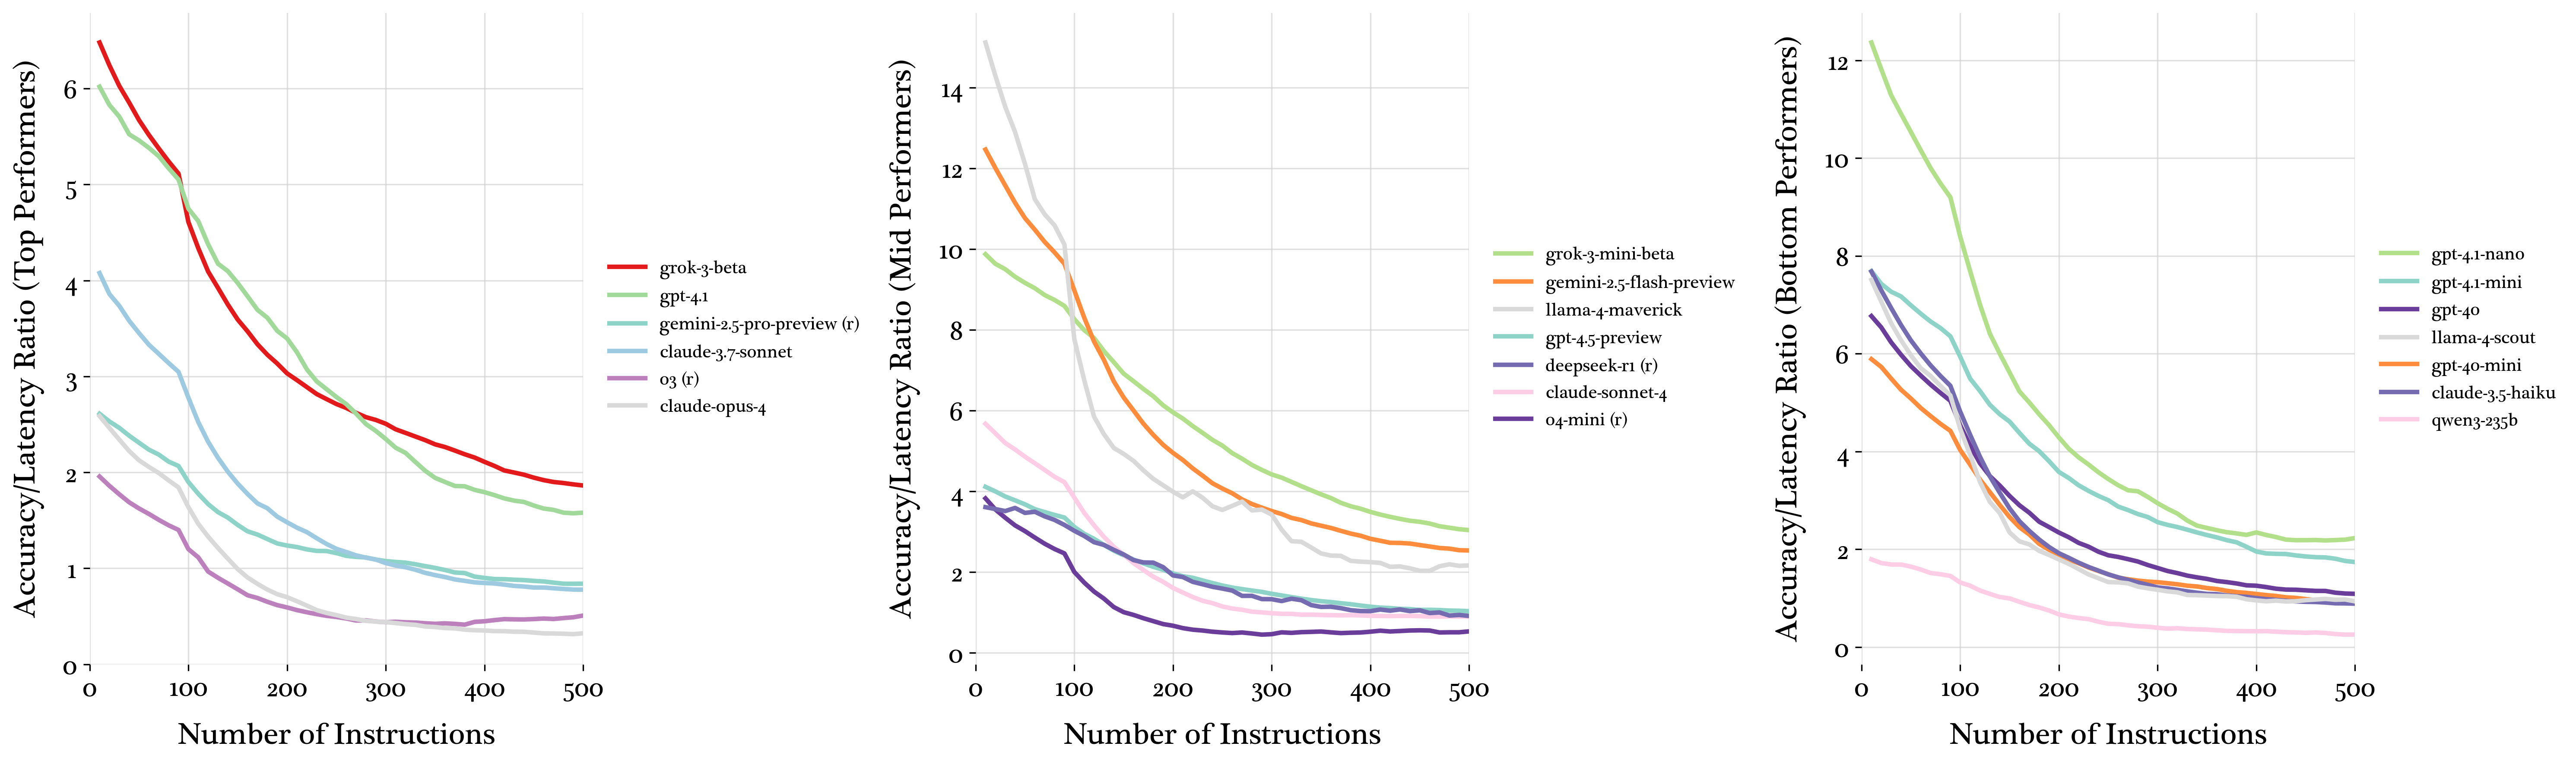
Figure 6: Accuracy per unit latency across instruction densities, revealing efficiency trade-offs.
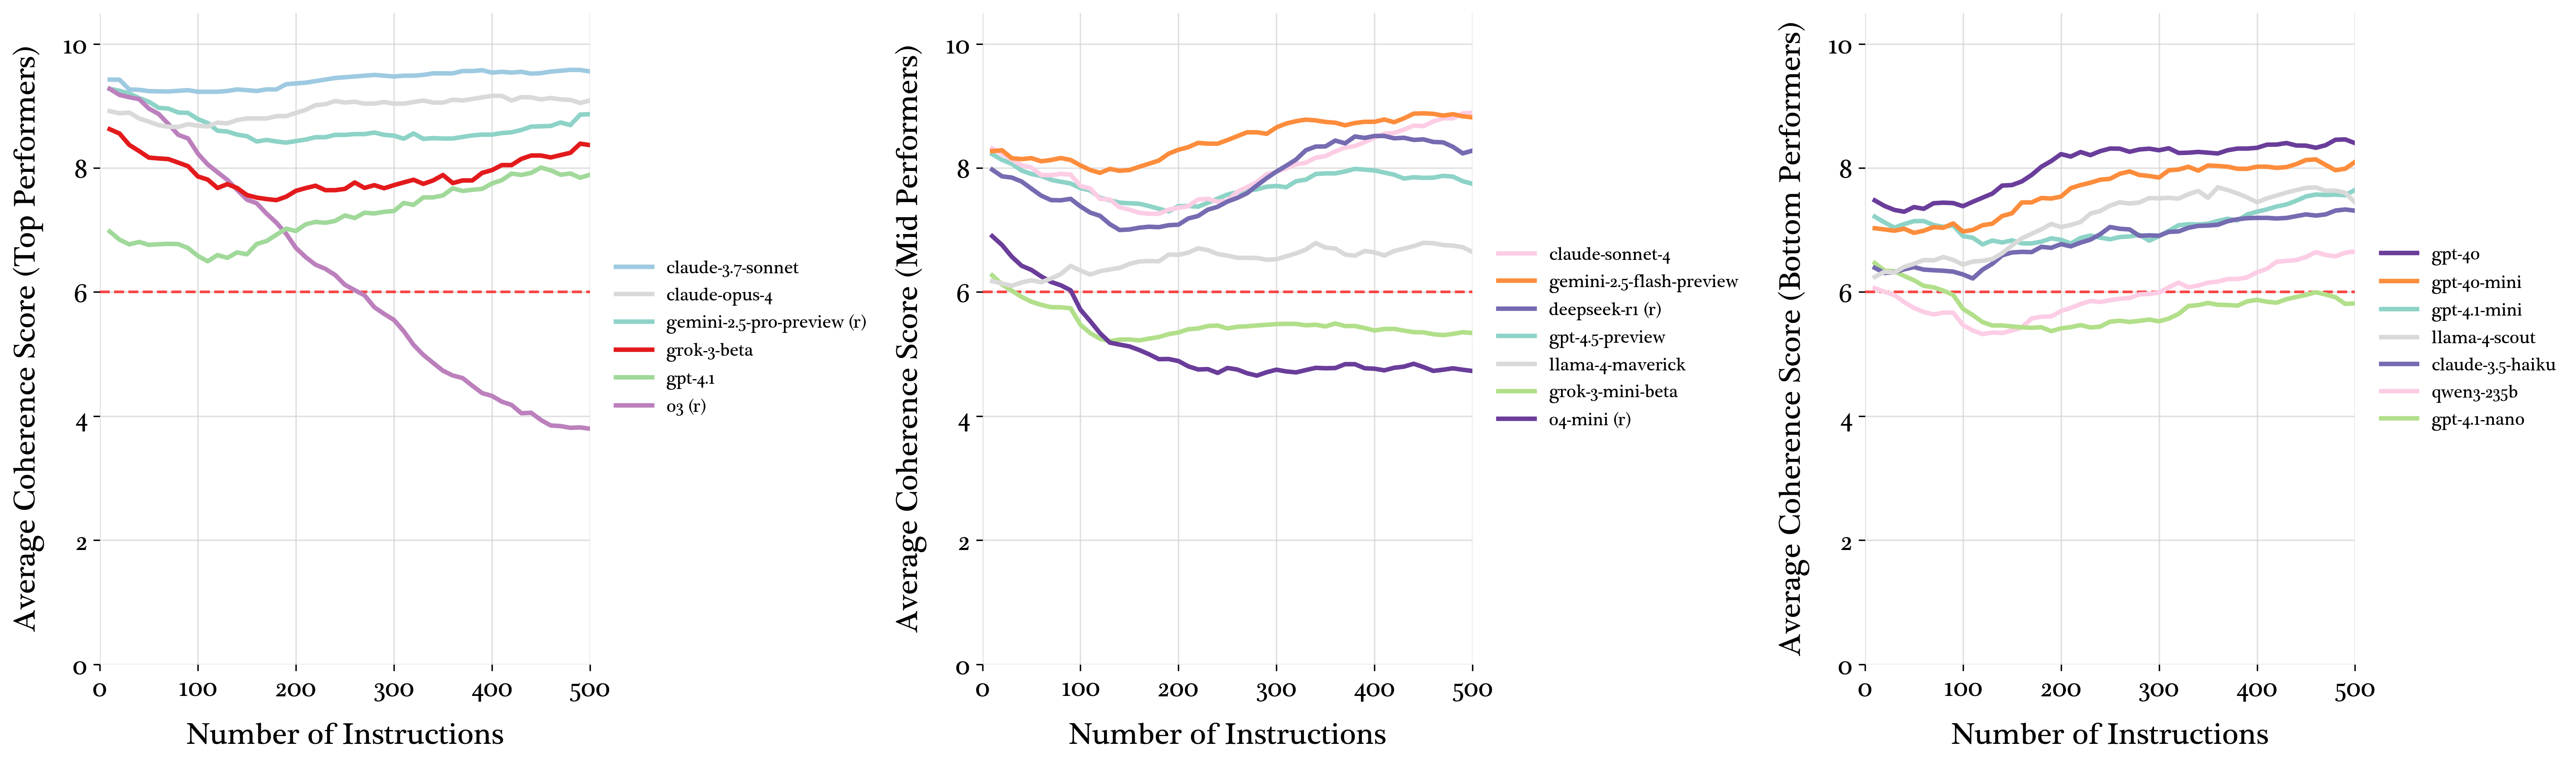
Figure 7: Coherence of model generated business reports as judged by an LLM.
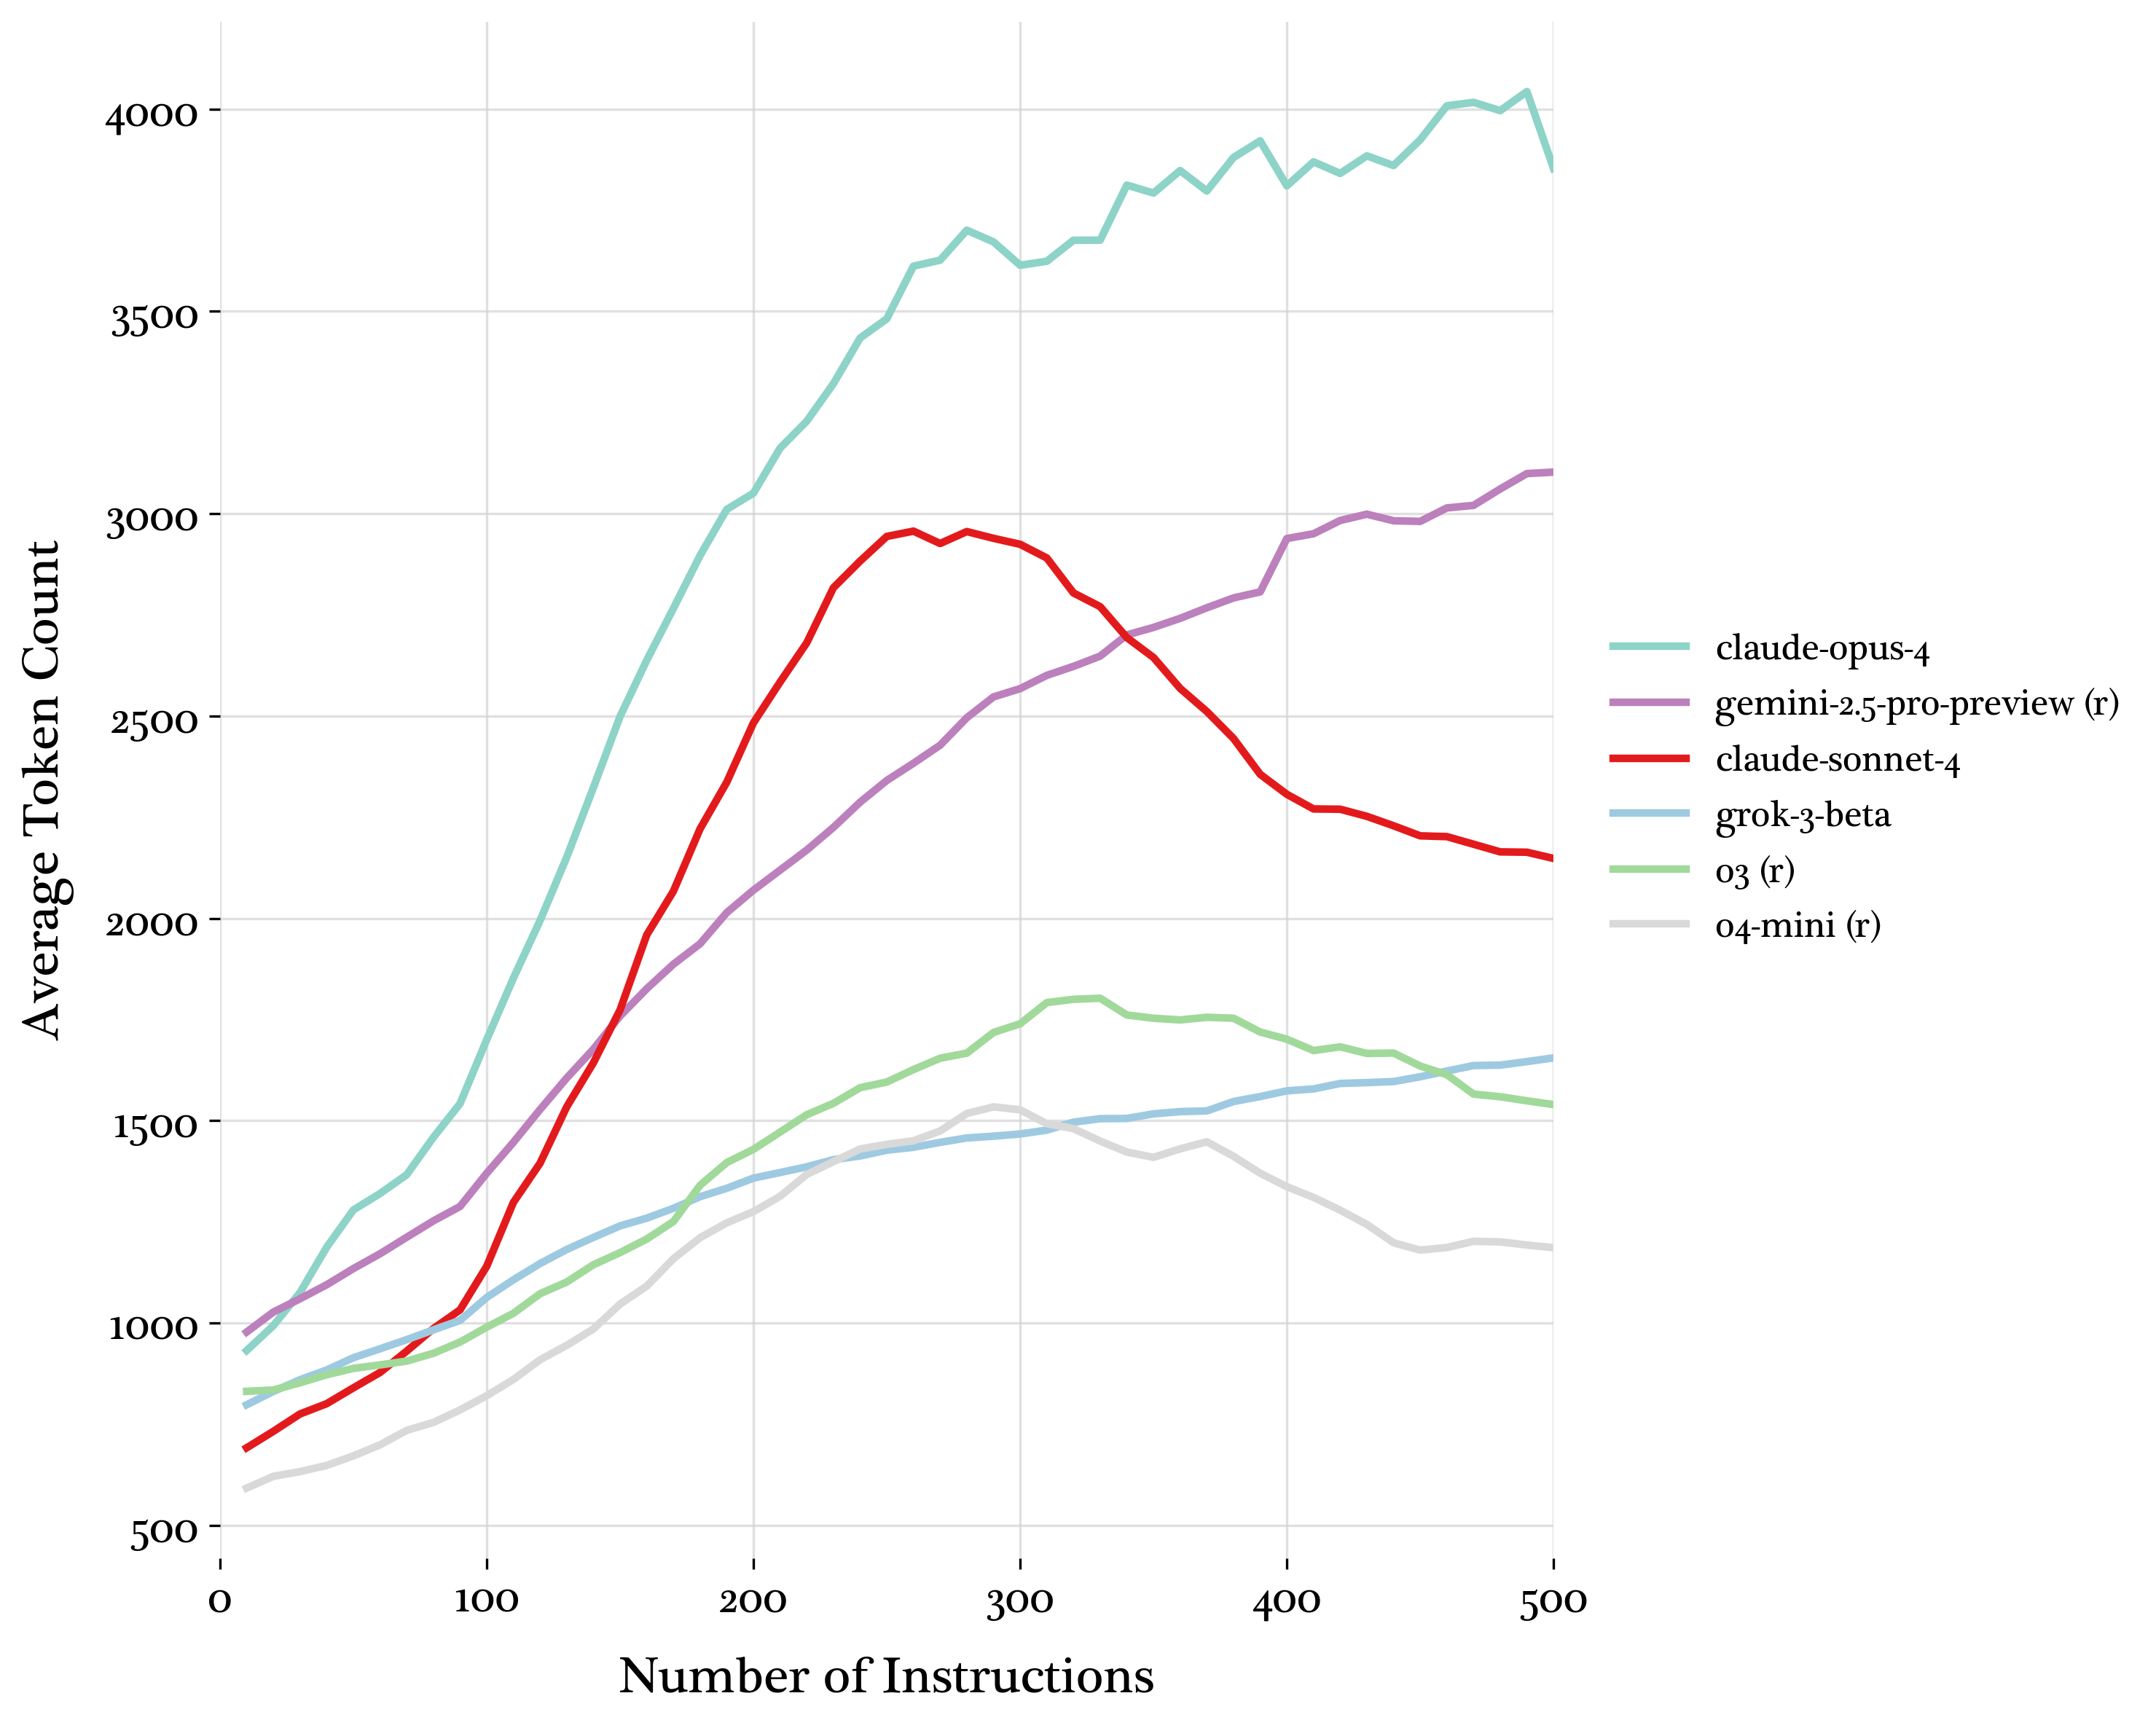
Figure 8: Average generated tokens for top performing models.
Impact of Reasoning and Thinking
The study further investigates the impact of reasoning effort parameters and thinking mode on model performance. Results indicate that higher reasoning effort leads to moderate performance gains at high instruction densities. Enabling thinking mode on hybrid models like claude-sonnet-4 also improves performance.
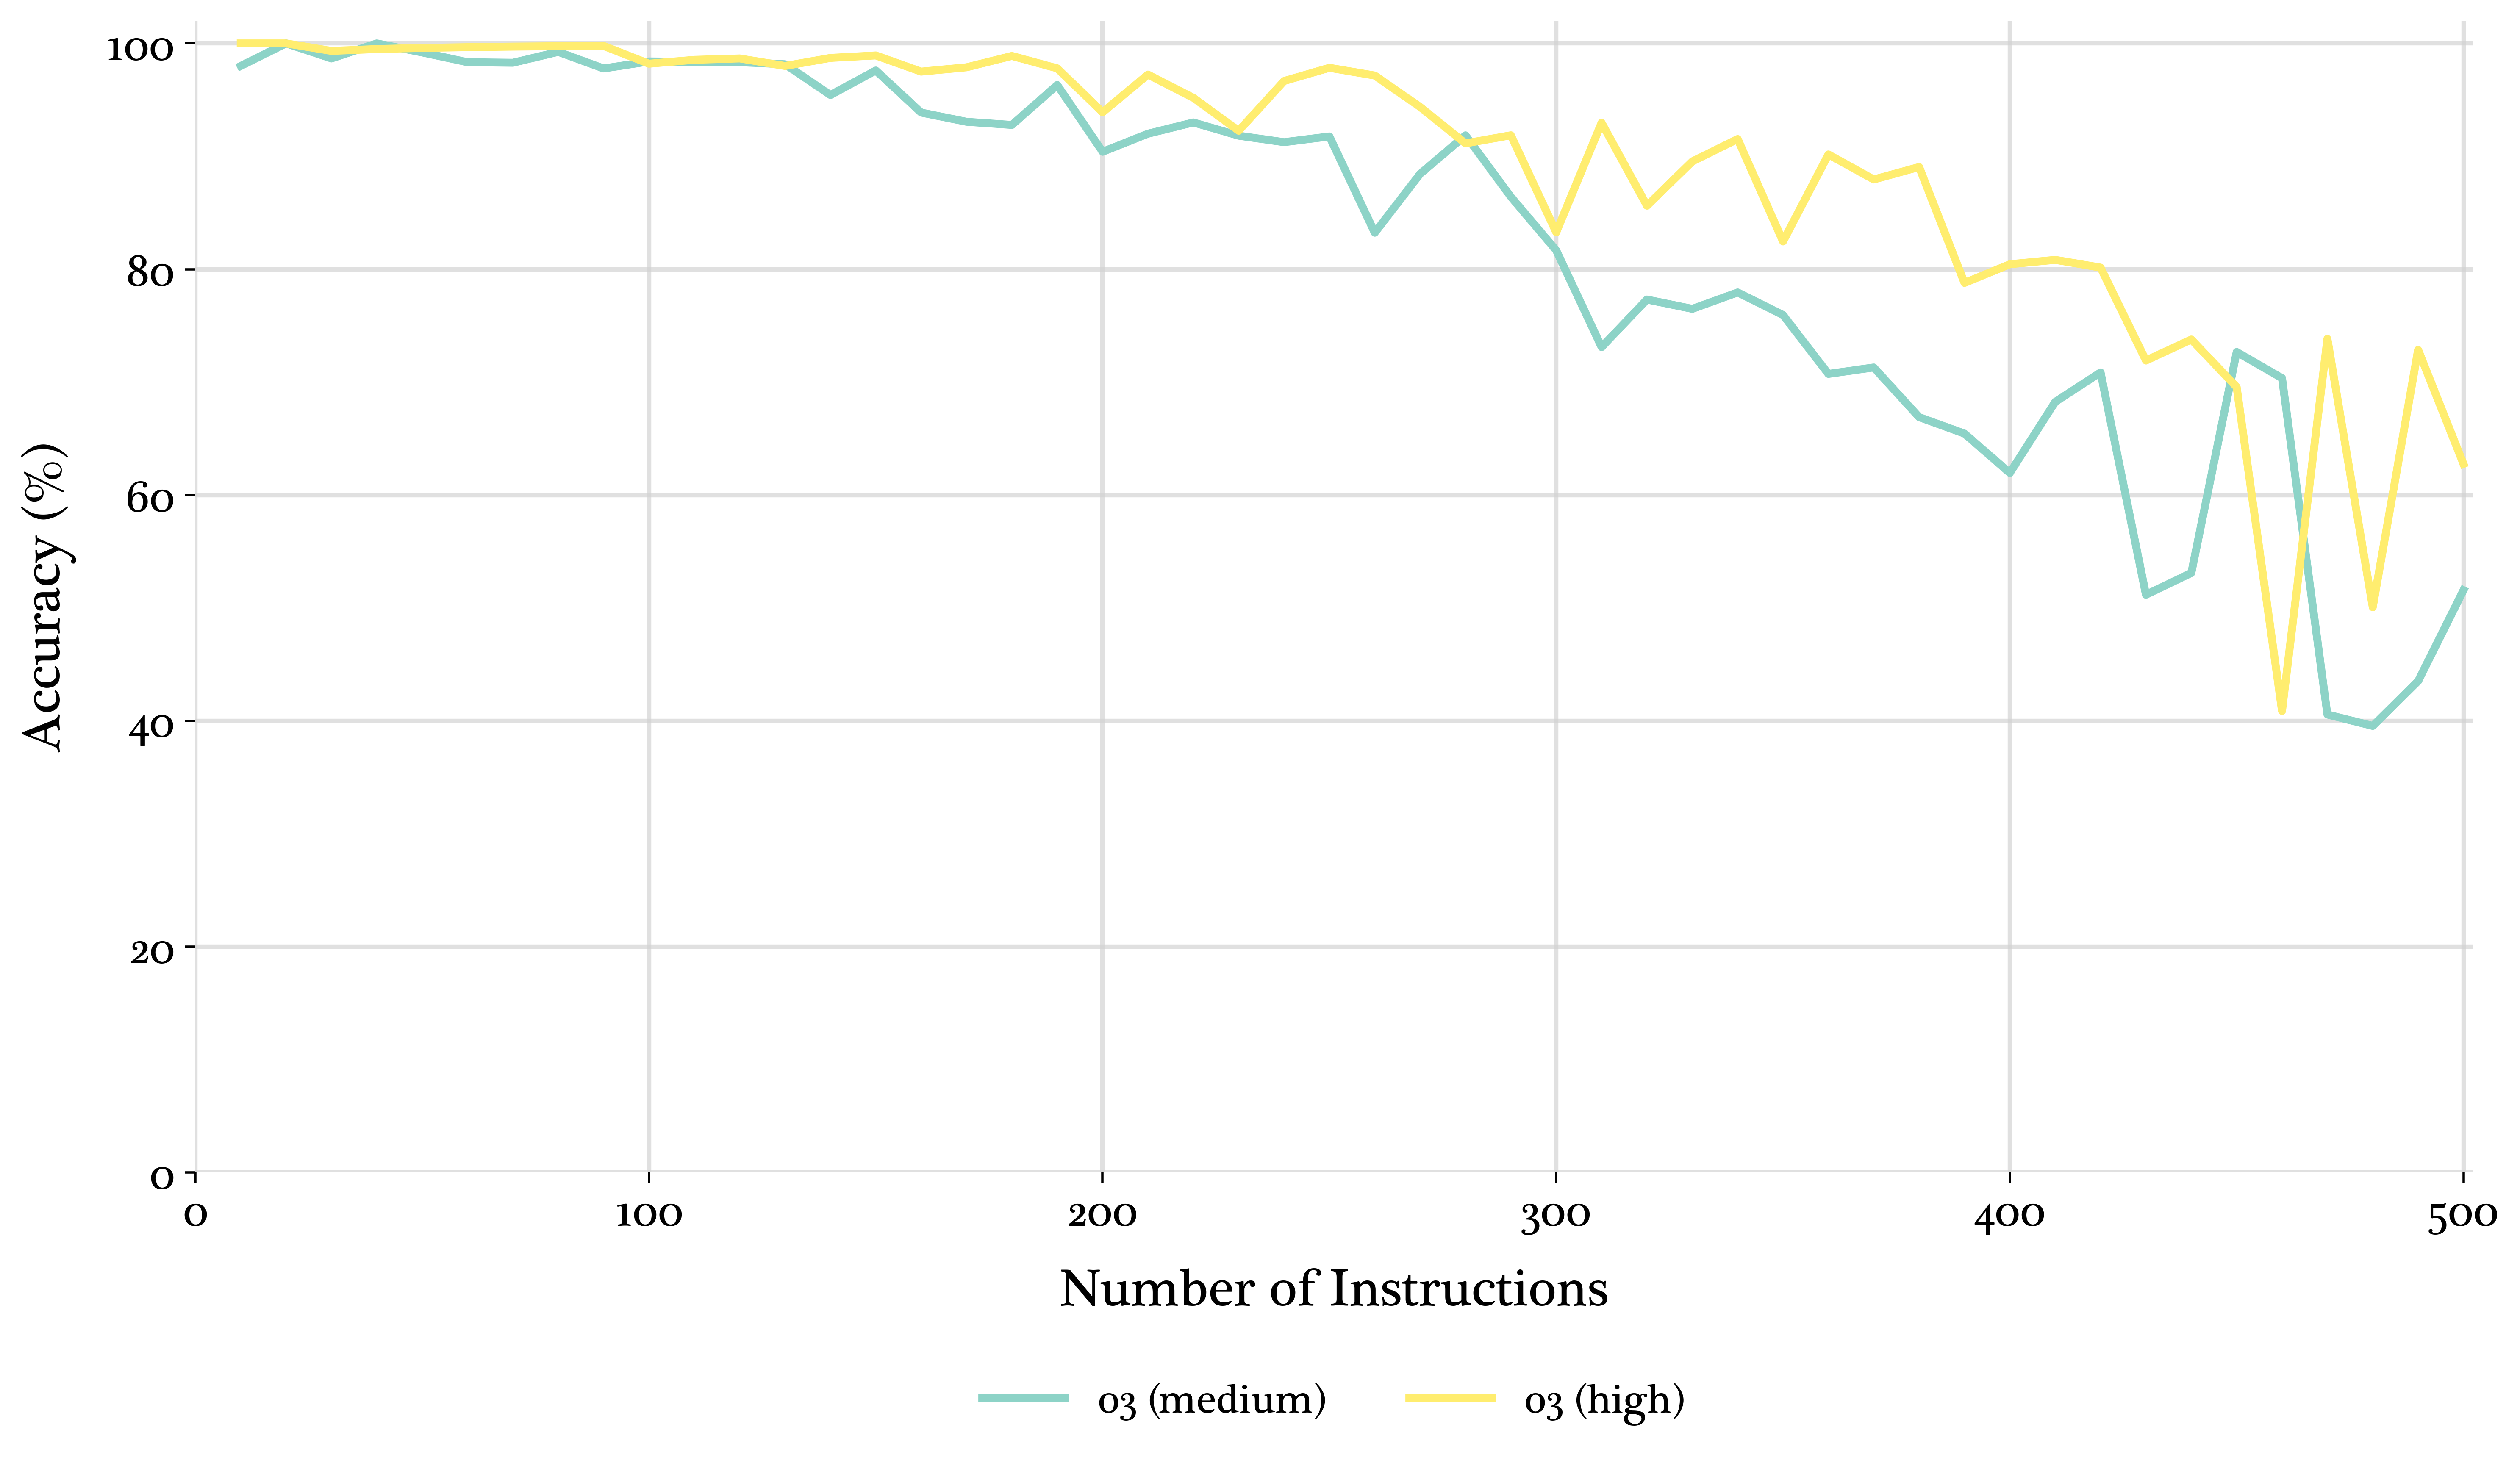
Figure 9: o3 run with "high" and "medium" reasoning efforts.
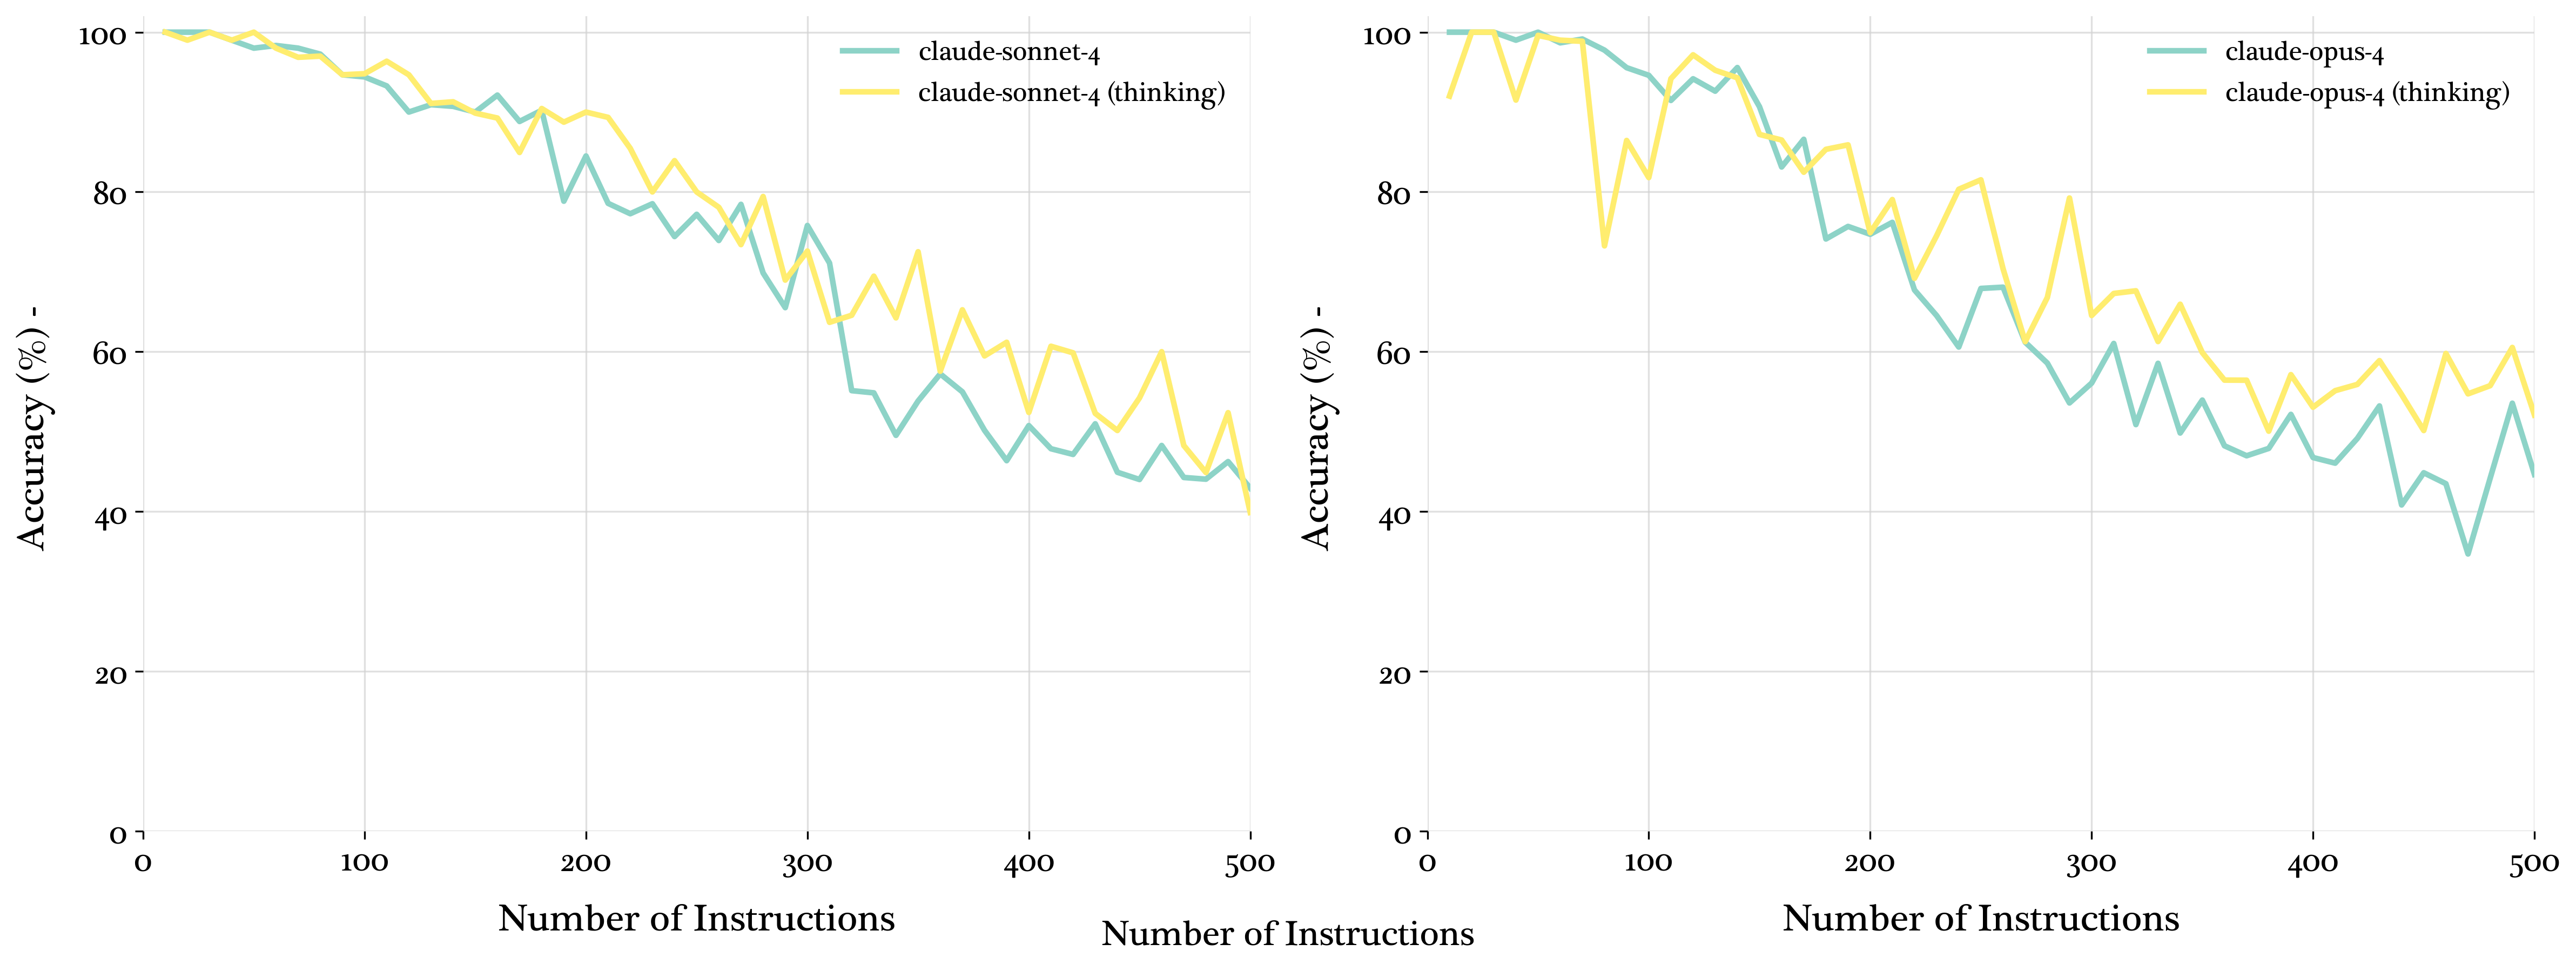
Figure 10: claude-sonnet-4 and claude-opus-4 evaluated with and without thinking enabled.
Conclusions
The IFScale benchmark provides insights into deploying LLMs in instruction-heavy scenarios, revealing distinct degradation patterns and attention limitations. The findings suggest that model selection should balance accuracy requirements with computational constraints, and that traditional prompt engineering becomes less effective at extreme densities. Future work should explore degradation mechanisms, instruction types, and the tension between instruction following and core task performance.