- The paper introduces a random effects model to partition variability in functional and structural connectivity into subject, edge, and interaction effects, revealing discrepancies between network- and edge-level correlations.
- It applies resting-state fMRI and diffusion MRI from 981 subjects with both deterministic and probabilistic tractography, using Pearson’s correlation and SIFT2 metrics to quantify connectivity.
- The study highlights that edge effects predominantly drive connectivity variance, indicating that network-level FC-SC correlations are more robust compared to individual edge correlations.
Paper Summary
The paper "Random Effects Models for Understanding Variability and Association between Brain Functional and Structural Connectivity" uses a novel statistical approach to unravel the variability and association between functional connectivity (FC) and structural connectivity (SC) in brain networks. By introducing random effects models, this research provides a comprehensive framework that decomposes the variability in FC and SC into different components attributable to subjects, brain edges, and their interactions. This approach facilitates a deeper understanding of the discrepancies between network-level and edge-level FC-SC correlations.
Introduction to FC and SC Correlations
Functional connectivity (FC) and structural connectivity (SC) define the dynamic relationships between distinct brain regions, with FC representing temporal synchrony and SC denoting physical connections through nerve fiber tracts. Previous studies concentrated on network-level FC-SC correlations but seldom investigated edge-level correlations, leading to gaps in understanding the detailed variability in FC-SC associations.
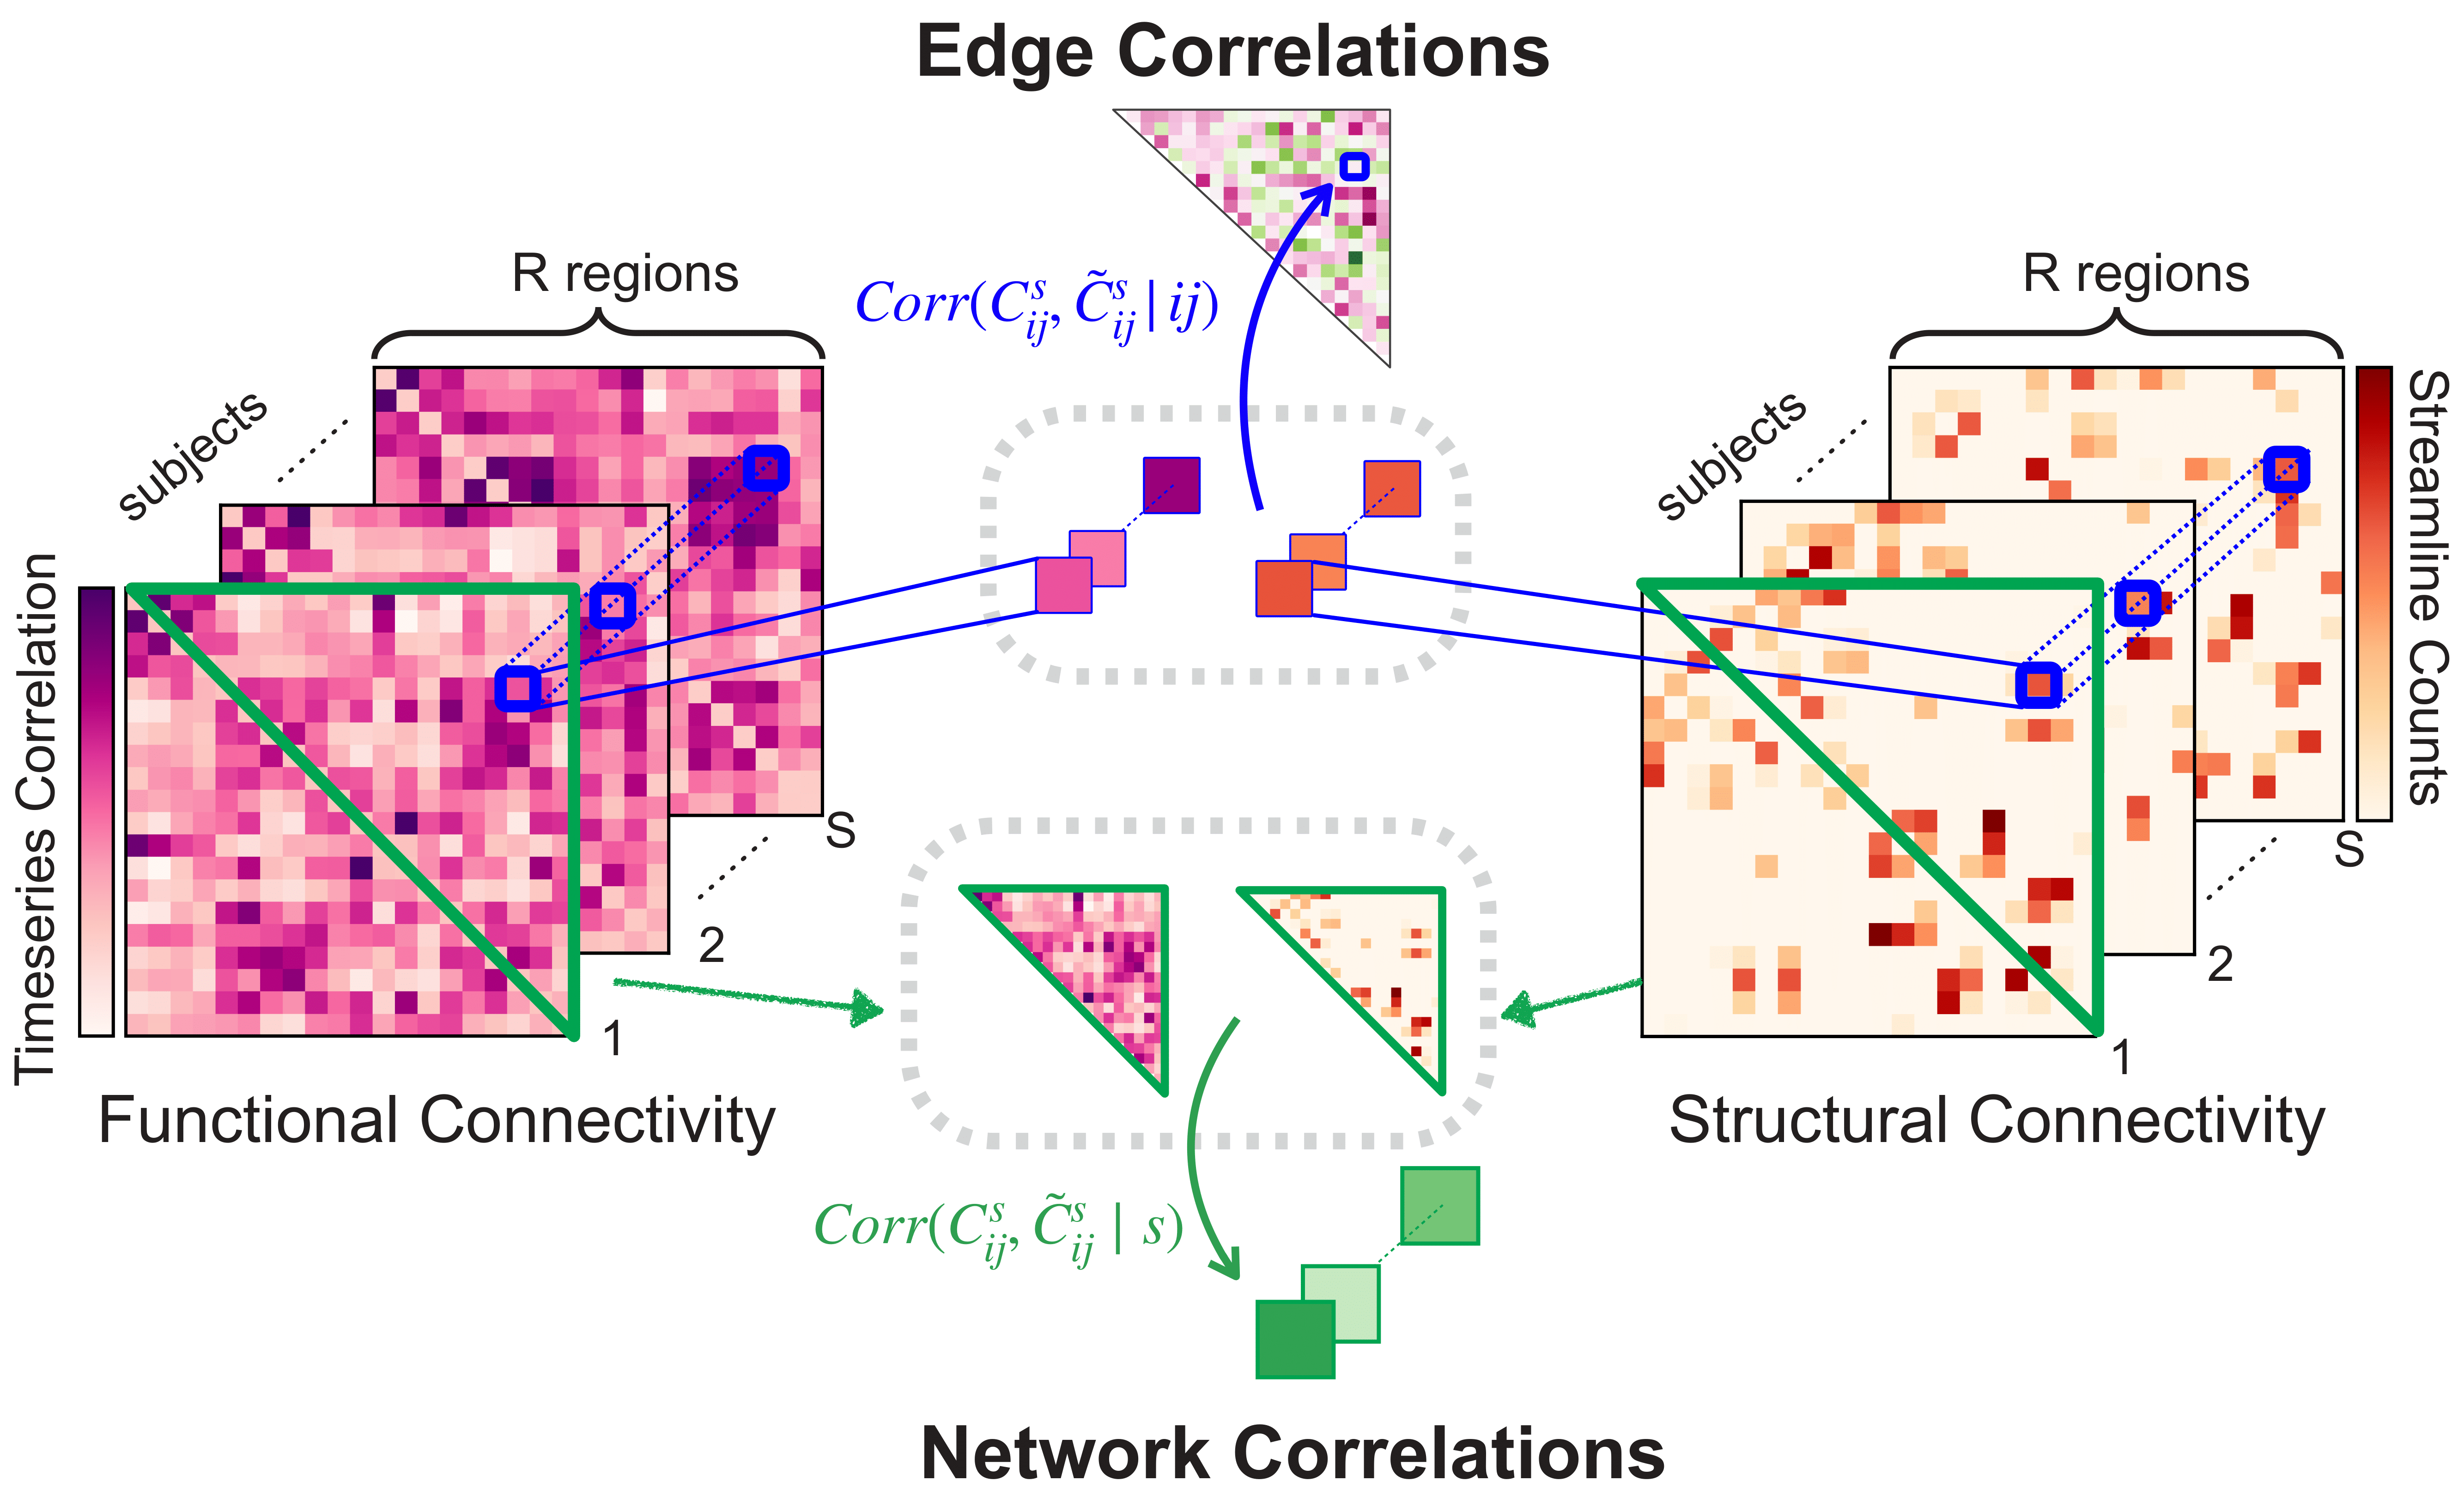
Figure 1: Workflow for calculating network and edge correlations.
Random Effects Models
The research introduces random effects models to statistically partition the variability in FC and SC into main effects, interaction effects, and residuals. These models separately account for variability across subjects, network edges, and their interactions, enabling quantitative insight into why different FC-SC correlation types yield varying results.
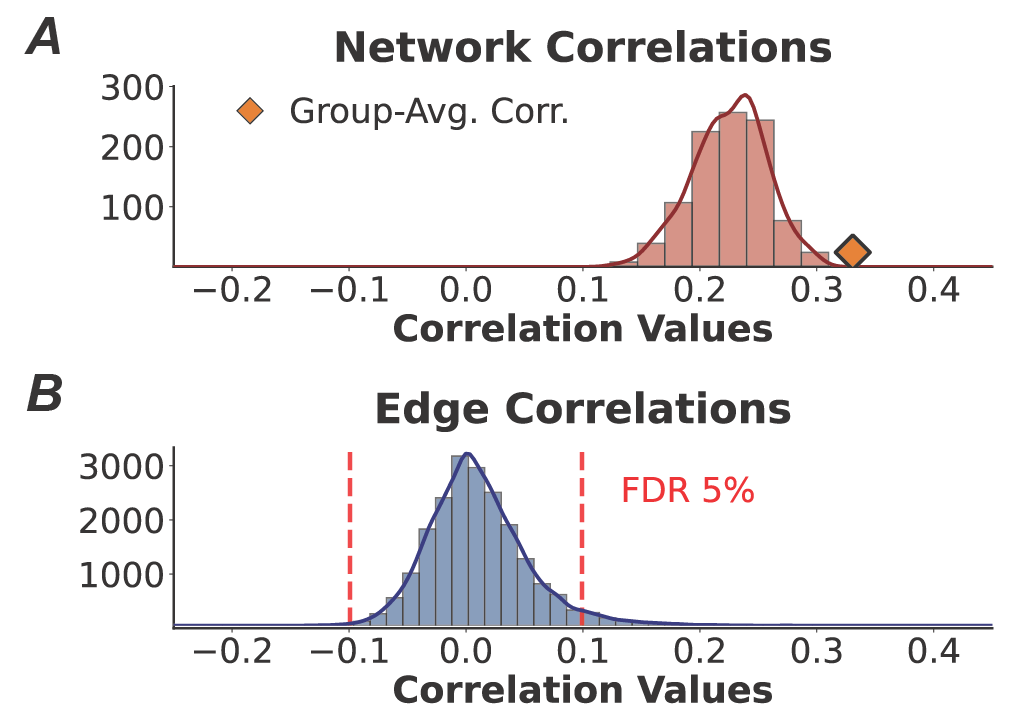
Figure 2: The histogram of subject network FC-SC correlations and edge FC-SC correlations.
Materials and Methods
The study utilized resting-state functional MRI and diffusion MRI data from the Human Connectome Project, comprising 981 subjects. The regions of interest were defined using the Schaefer-200 parcellation, and both deterministic and probabilistic tractography methods were employed for constructing structural networks. FC was quantified by Pearson correlation coefficients between fMRI time series, while SC was measured using log-transformed SIFT2-weighted streamline counts.
Results and Analysis
The results illustrate moderate positive correlations in network-level FC-SC correlations but significantly weaker correlations at the edge level. Subject network correlations ranged from 0.12 to 0.31, while edge correlations averaged very low, thus highlighting the variance across different FC-SC analyses.
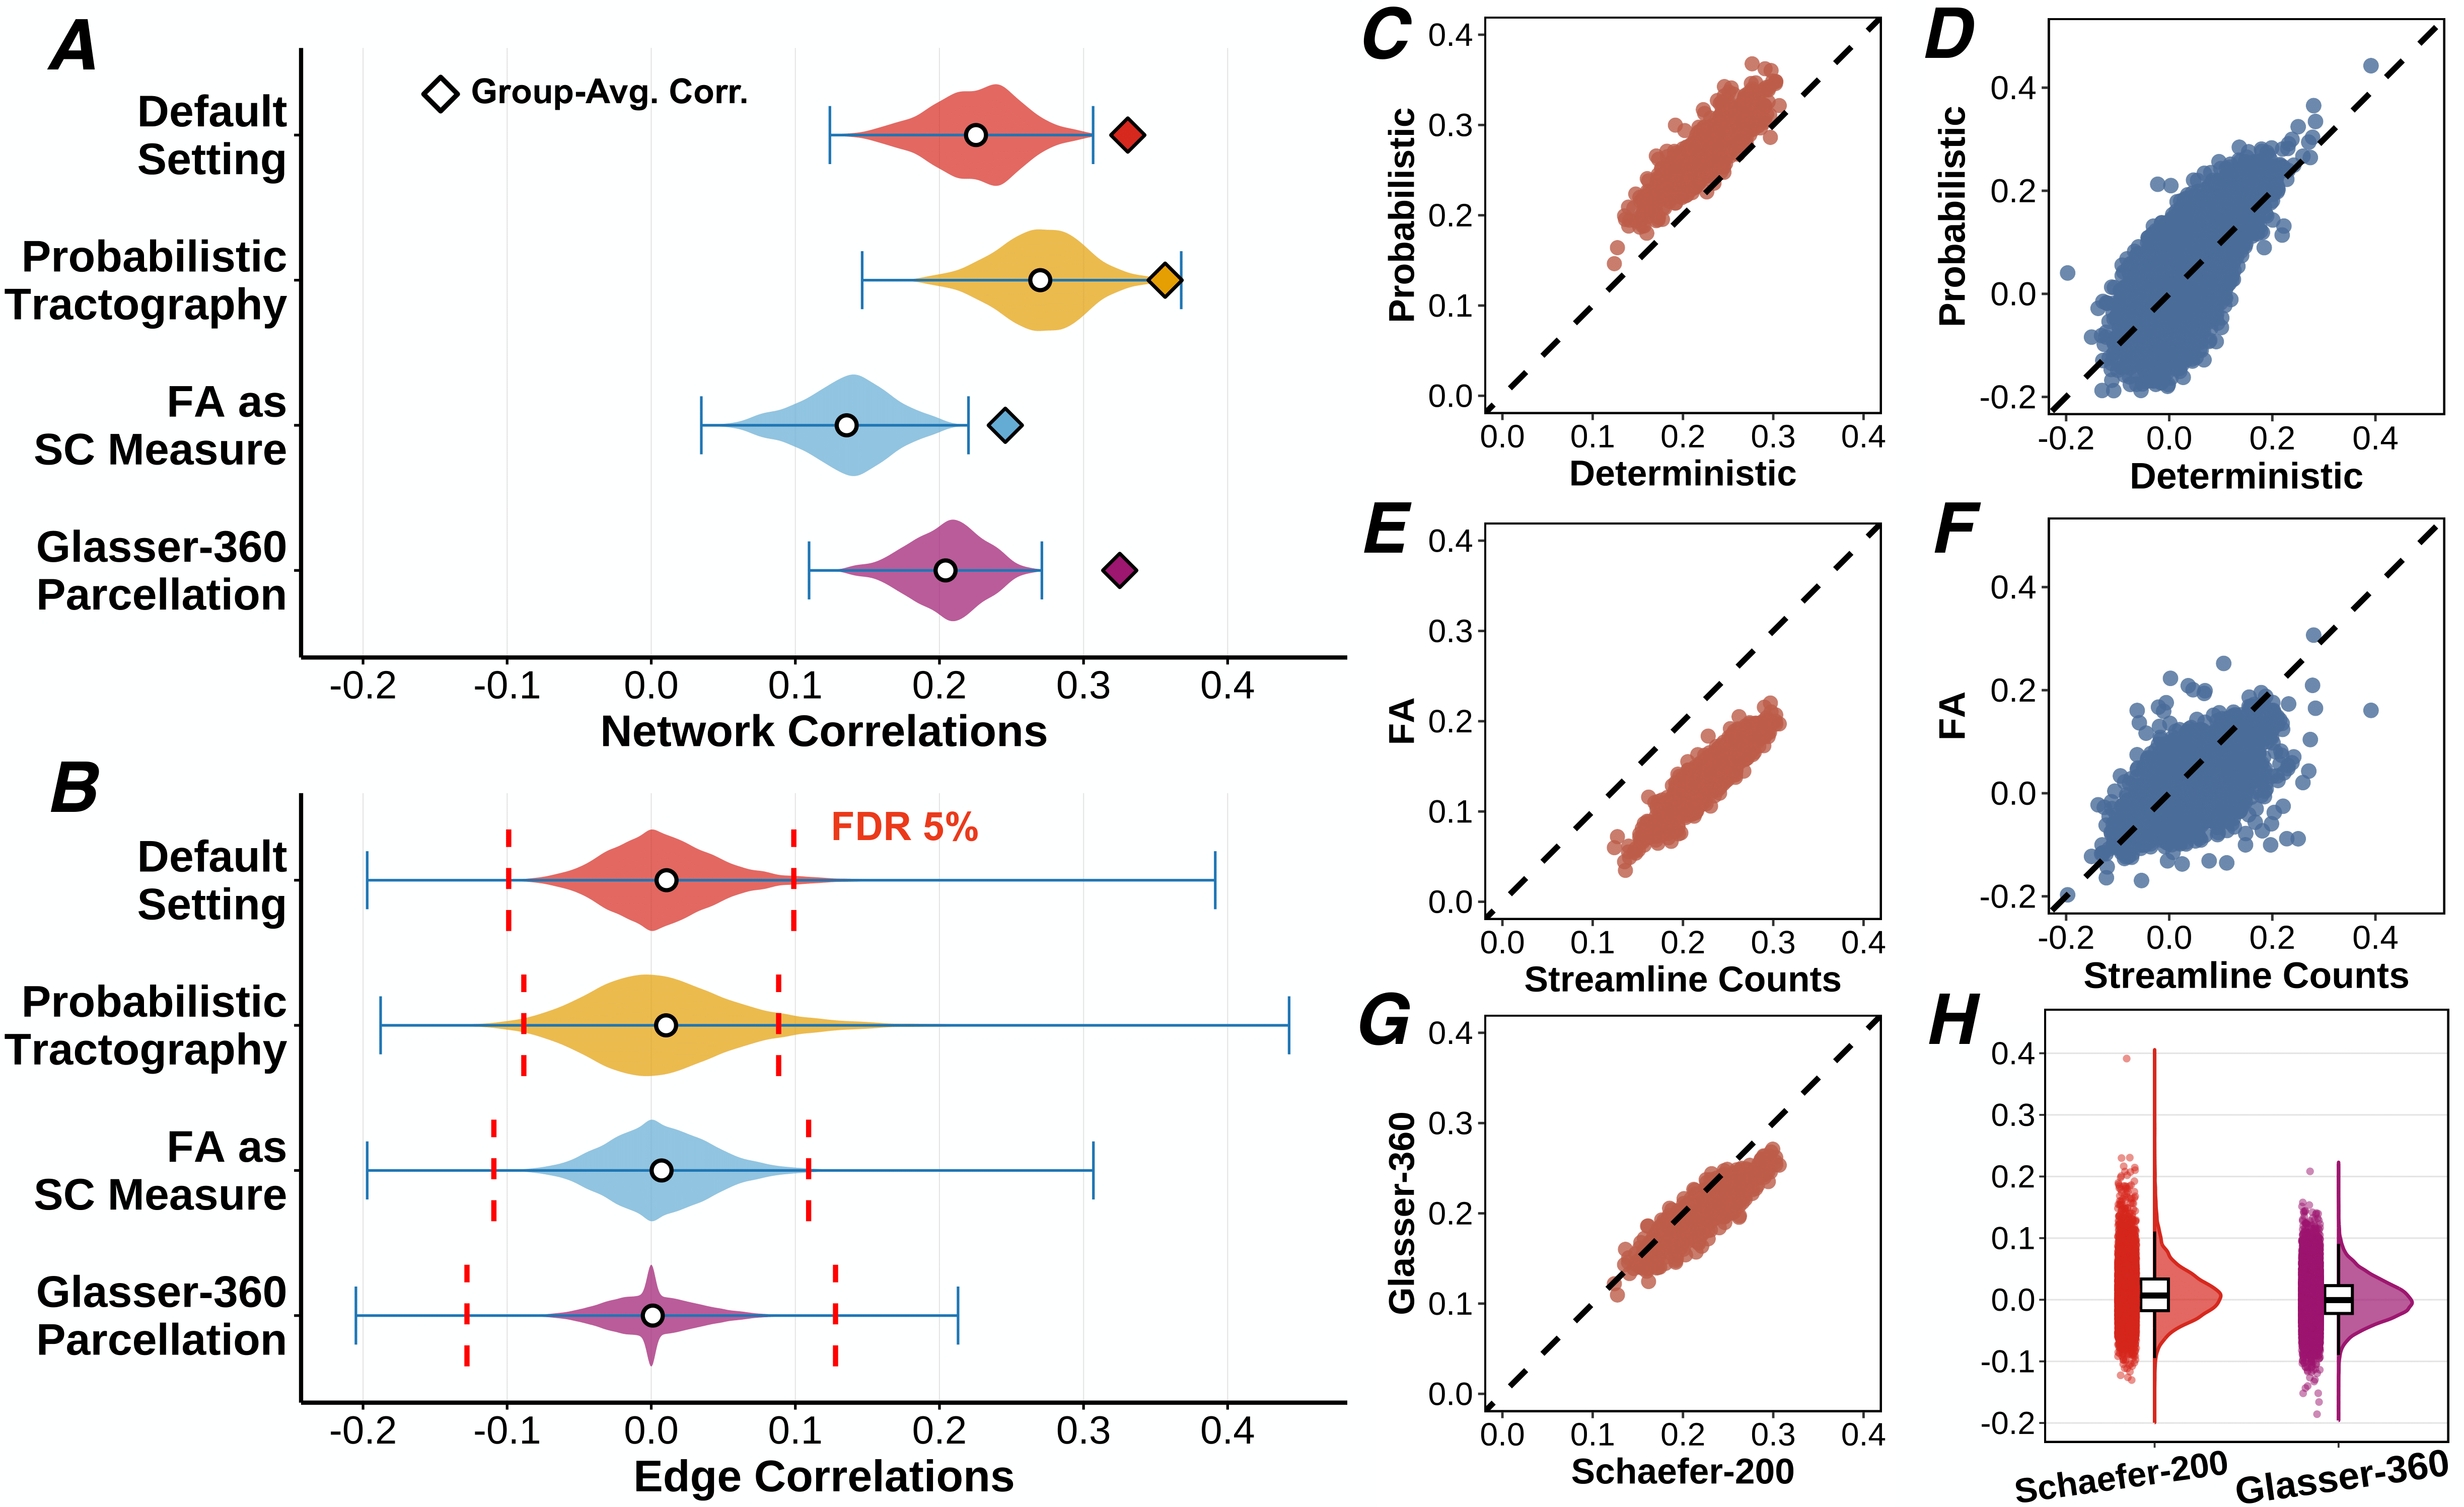
Figure 3: Comparisons of network and edge FC-SC correlations across different settings.
Variance decomposition reveals that main edge effects dominate FC and SC variability, while subject effects have minimal impact, accounting only for a fraction of total variability. The model underscores that network correlations primarily reflect edge variability, whereas edge correlations are influenced by subject-level variations, explaining their weak associations.
Methodological Considerations
The study evaluates three methodological choices affecting FC-SC correlations: the tractography method, SC measurement metrics, and brain parcellation schemes. It was found that probabilistic tractography elevated the proportion of SC variability explained by edge effects, enhancing the network FC-SC correlations. Yet, alternative SC metrics like FA and different parcellations had negligible impact on correlation strength, supporting the robustness of the findings across methodologies.
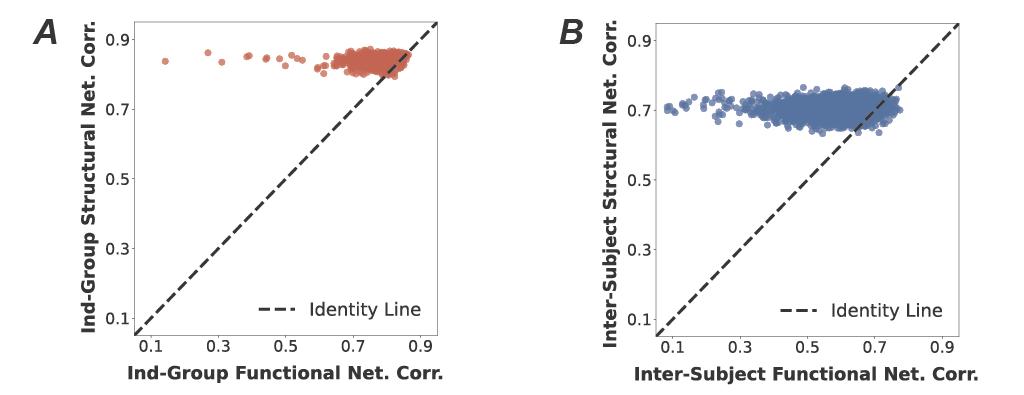
Figure 4: Inter-subject similarity metrics in functional and structural networks.
Discussions and Conclusions
Through its novel statistical framework, the research addresses the complexities in FC-SC relationships, elucidating the sources of variability often overlooked in such analyses. The results suggest FC-SC coupling is stronger when considering population-mean networks rather than individual differences. Future studies may explore diverse age groups to evaluate how generalizable these findings are beyond the studied cohort.
Overall, this work provides critical insight into the structural and functional intricacies of brain networks, offering a rigorous statistical approach for future neuroscientific investigations.