- The paper adapts the Economic Complexity Index to the Roman Empire by quantitatively analyzing over 525,000 Latin inscriptions to infer intricate occupational structures.
- It employs bias corrections and network science methods to unveil a robust nested structure and spatial clustering of occupations across provinces.
- Results indicate a significant correlation between ancient and modern economic complexity, underscoring enduring determinants of regional development.
Economic Complexity in the Roman Empire: A Quantitative Archaeological Analysis
Introduction
This paper presents a comprehensive quantitative reconstruction of the economic complexity of the Roman Empire, leveraging a large-scale dataset of Latin inscriptions to infer the occupational structure of Roman provinces. By adapting the Economic Complexity Index (ECI)—a metric widely used in contemporary economic geography and development economics—the authors provide a systematic comparison between ancient and modern economic structures. The study integrates network science, digital humanities, and archaeological data, offering new insights into the persistence and determinants of economic complexity over millennia.
Data Sources and Methodological Framework
The primary data source is the LALL dataset, comprising over 525,000 geolocated Latin inscriptions, with a focus on the first four centuries CE. Occupations are extracted from these inscriptions, yielding 10,353 occupation mentions across 512 unique professions. The spatial granularity is at the level of Roman provinces, with modern coastline corrections and the exclusion of ephemeral eastern provinces. Only provinces with at least 1,000 Latin inscriptions are included to ensure statistical robustness.
Biases inherent in epigraphic data—status, gender, primary sector underrepresentation, research intensity, and language—are systematically addressed through probabilistic corrections. For example, non-elite and female occupations are upweighted, and agricultural professions are inflated to reflect demographic realities. The resulting province-occupation matrix Mpo is log-transformed to mitigate skewness, and multiple plausible realizations are sampled to assess robustness.
Occupational Structure and Network Analysis
The occupational structure of the Roman Empire is visualized through a nested Mpo matrix, revealing a pronounced upper-triangular density consistent with nestedness observed in modern economic systems. The bias-corrected matrix is 5.7 times denser on the left of the isocline than the right, a result that is statistically significant (p<0.01).
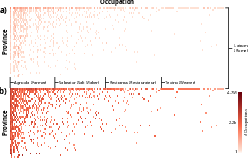
Figure 1: Logarithmic counts of occupations per province, before and after bias correction, highlighting the nested structure and regional disparities.
The authors construct the "Occupation Space"—a network where nodes represent occupations and edges encode statistically significant co-appearances within provinces. Node size reflects occupation prevalence, color encodes complexity, and edge attributes capture co-appearance strength and significance.

Figure 2: The Occupation Space network, showing clusters of occupations and a gradient from simple to complex professions.
This network reveals a core-periphery structure, with a dense core of common occupations (e.g., agricola, curator) and peripheral clusters, including a Latium-specific star. The structure is analogous to the modern Product Space, supporting the transferability of economic complexity concepts to ancient contexts.
Provinces are clustered based on their occupational profiles using network distances in the Occupation Space. Clusters correspond to known historical, economic, and military regions, such as the Danubian military zone and major trading hubs.
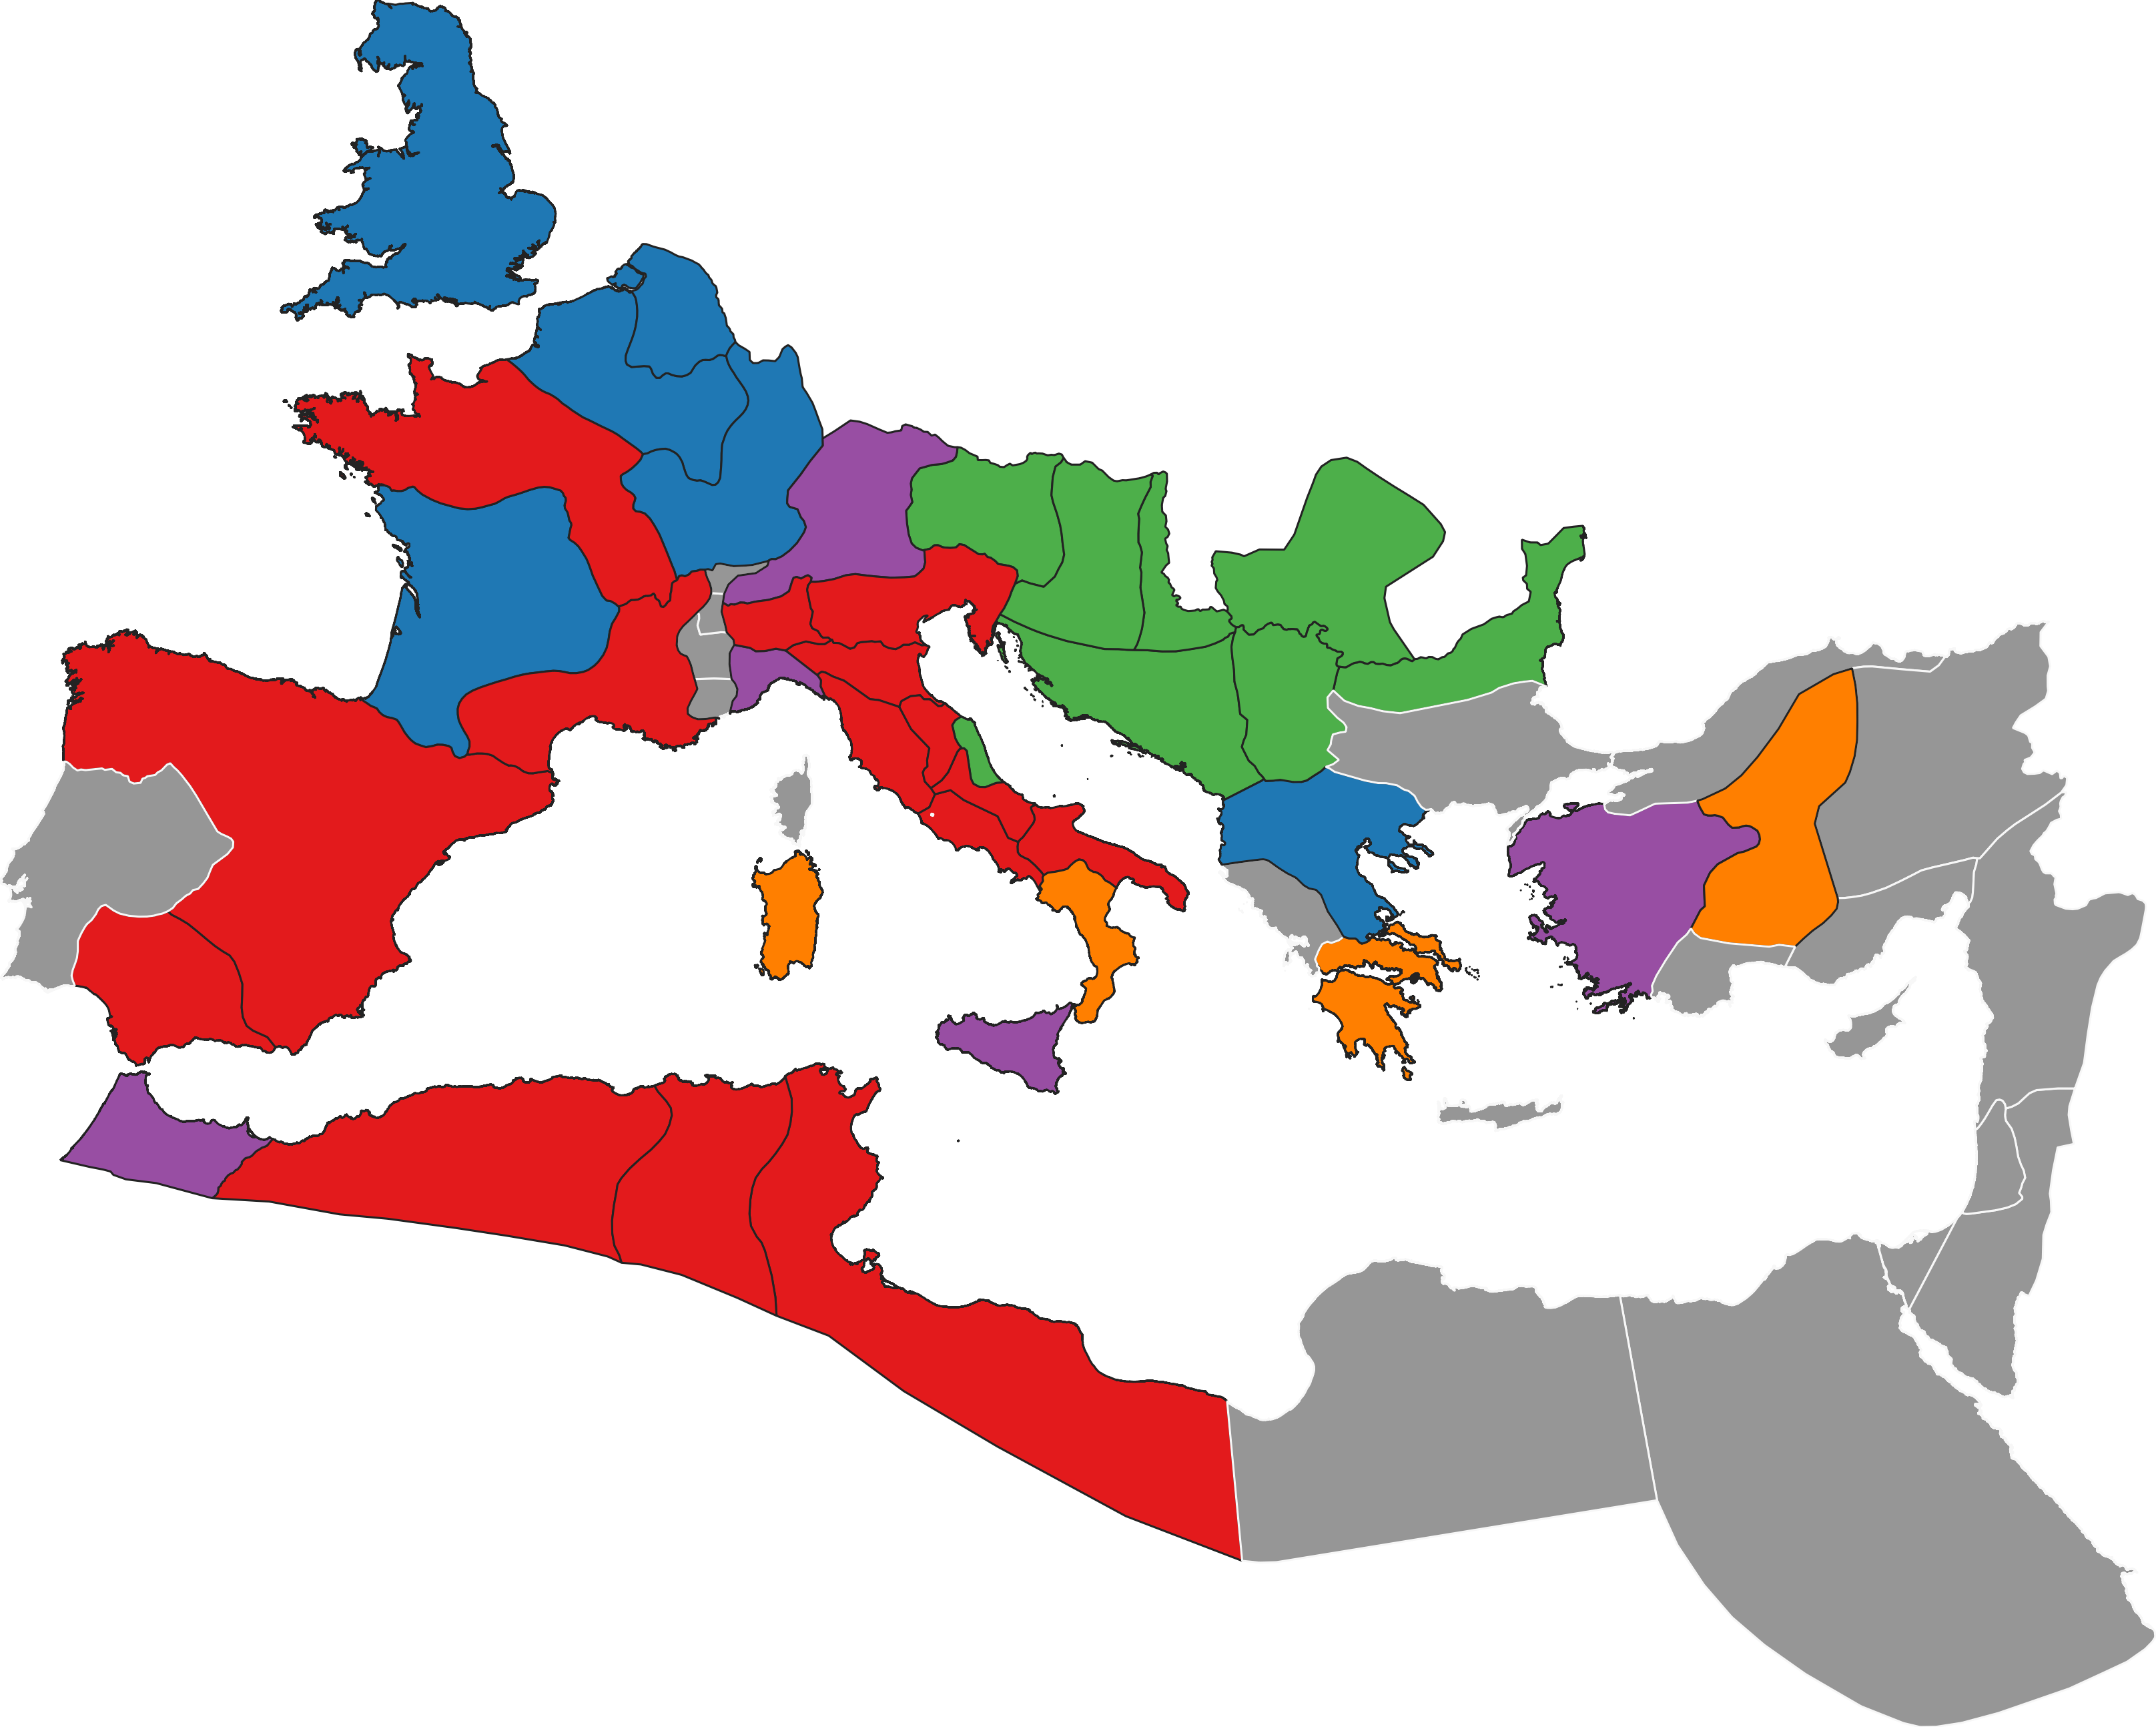
Figure 3: Clustering of provinces in the Occupation Space, reflecting economic and military regionalization.
Estimation and Spatial Distribution of Economic Complexity
The ECI is computed for each province using the classical eigenvector-based approach. Provinces with rare, specialized occupations score higher, while those with only ubiquitous professions score lower. The spatial distribution of ECI highlights Latium (Rome) as the most complex, with elevated complexity in provinces hosting major trading nodes (Venetia, Carthage, Baetica).
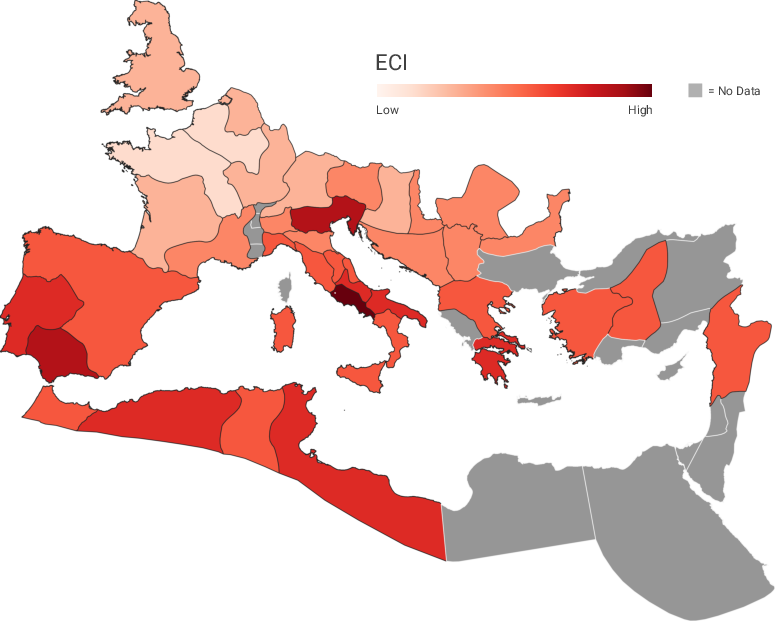
Figure 4: Spatial distribution of ECI values across Roman provinces, with darker shades indicating higher complexity.
Bias correction shifts complexity eastward, reducing the western dominance observed in raw counts.
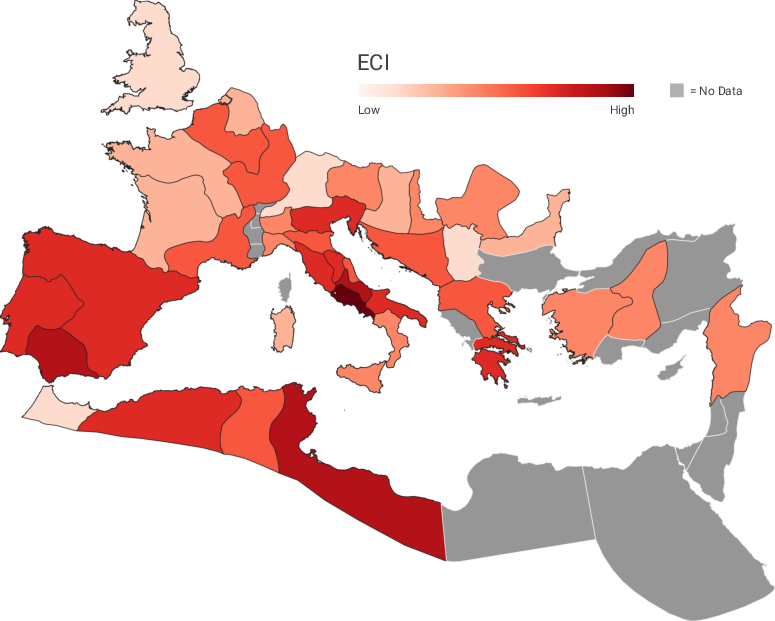
Figure 5: Comparison of ECI values before and after bias correction, illustrating the impact of methodological adjustments.
The stability of ECI rankings across bias-corrected samples is visualized via boxplots, demonstrating that while some provinces exhibit variability, the overall ranking is robust.
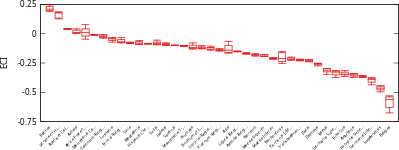
Figure 6: Distribution of ECI values per province, excluding the outlier Latium, showing relative stability of rankings.
Temporal Stability and Modern Correlates
A key result is the statistically significant Spearman rank correlation (ρ=0.439, p<0.05) between ancient ECI (from inscriptions) and modern ECI (from UN Comtrade data, 1962–2022) across 23 countries. Eight of the top ten most complex countries in antiquity remain in the modern top ten, with notable exceptions (e.g., Algeria, Serbia in antiquity; UK, Austria in modernity). This persistence is observed despite a 1,500-year temporal gap and substantial geopolitical, technological, and demographic transformations.
Methodological Details
The construction of the Occupation Space employs noise-corrected backboning to identify significant co-appearances, addressing the high skew and sparsity of the data. The ECI calculation follows the standard approach: RCA transformation, binarization, normalization, and extraction of the second largest eigenvector of the province-province similarity matrix. The authors justify the exclusion of alternative ECI definitions (e.g., economic fitness) due to their sensitivity to outliers in this context.
Implications and Future Directions
The finding of a persistent correlation between ancient and modern economic complexity rankings suggests that the determinants of economic complexity may be deeply rooted, potentially reflecting enduring geographic, institutional, or path-dependent factors. This raises important questions for development policy: if economic complexity is highly persistent, interventions to alter a region's developmental trajectory may require sustained, large-scale efforts.
The study also highlights the methodological challenges and opportunities in using archaeological data for quantitative economic analysis. Survivorship, authorial, and research biases remain significant, and the lack of comparable Greek occupational data limits coverage in the eastern empire. Advances in NLP for ancient Greek and further digitization of inscriptions will enhance future analyses.
Conclusion
This paper demonstrates the feasibility and value of applying economic complexity analysis to ancient economies using archaeological data. The robust correlation between Roman and modern ECI rankings provides empirical evidence for the long-term persistence of economic structures. The results underscore the importance of integrating network science, digital humanities, and economic theory in historical research, and open new avenues for investigating the origins and dynamics of economic complexity across time.