- The paper introduces two optimization problems (W_POMP and W_LOMP) to minimize edge crossings and maximize color consistency in alluvial plots.
- It adapts the NeighborNet algorithm with TSP solving and Fenwick trees for efficient, scalable block ordering and objective computation.
- Empirical results on datasets from Game of Thrones to scRNA-seq demonstrate significant clarity improvements in multivariate data visualizations.
Optimizing Alluvial Plots: Algorithmic Foundations and Applications
Introduction
Alluvial plots are a powerful tool for visualizing multivariate categorical data, enabling the tracking of individual entities across multiple variables or time points. The interpretability and clarity of these plots, however, are highly sensitive to the ordering and coloring of strata (blocks) within each layer. The paper "Optimizing alluvial plots" (2509.03761) formalizes the optimization of alluvial plot layouts as two distinct combinatorial problems: (1) minimizing edge crossings via optimal block and layer ordering (W_POMP), and (2) maximizing color agreement among blocks with similar membership (W_LOMP). The authors introduce a heuristic solution leveraging the NeighborNet algorithm from phylogenetics, and provide an open-source R package, wompwomp, for practical implementation.
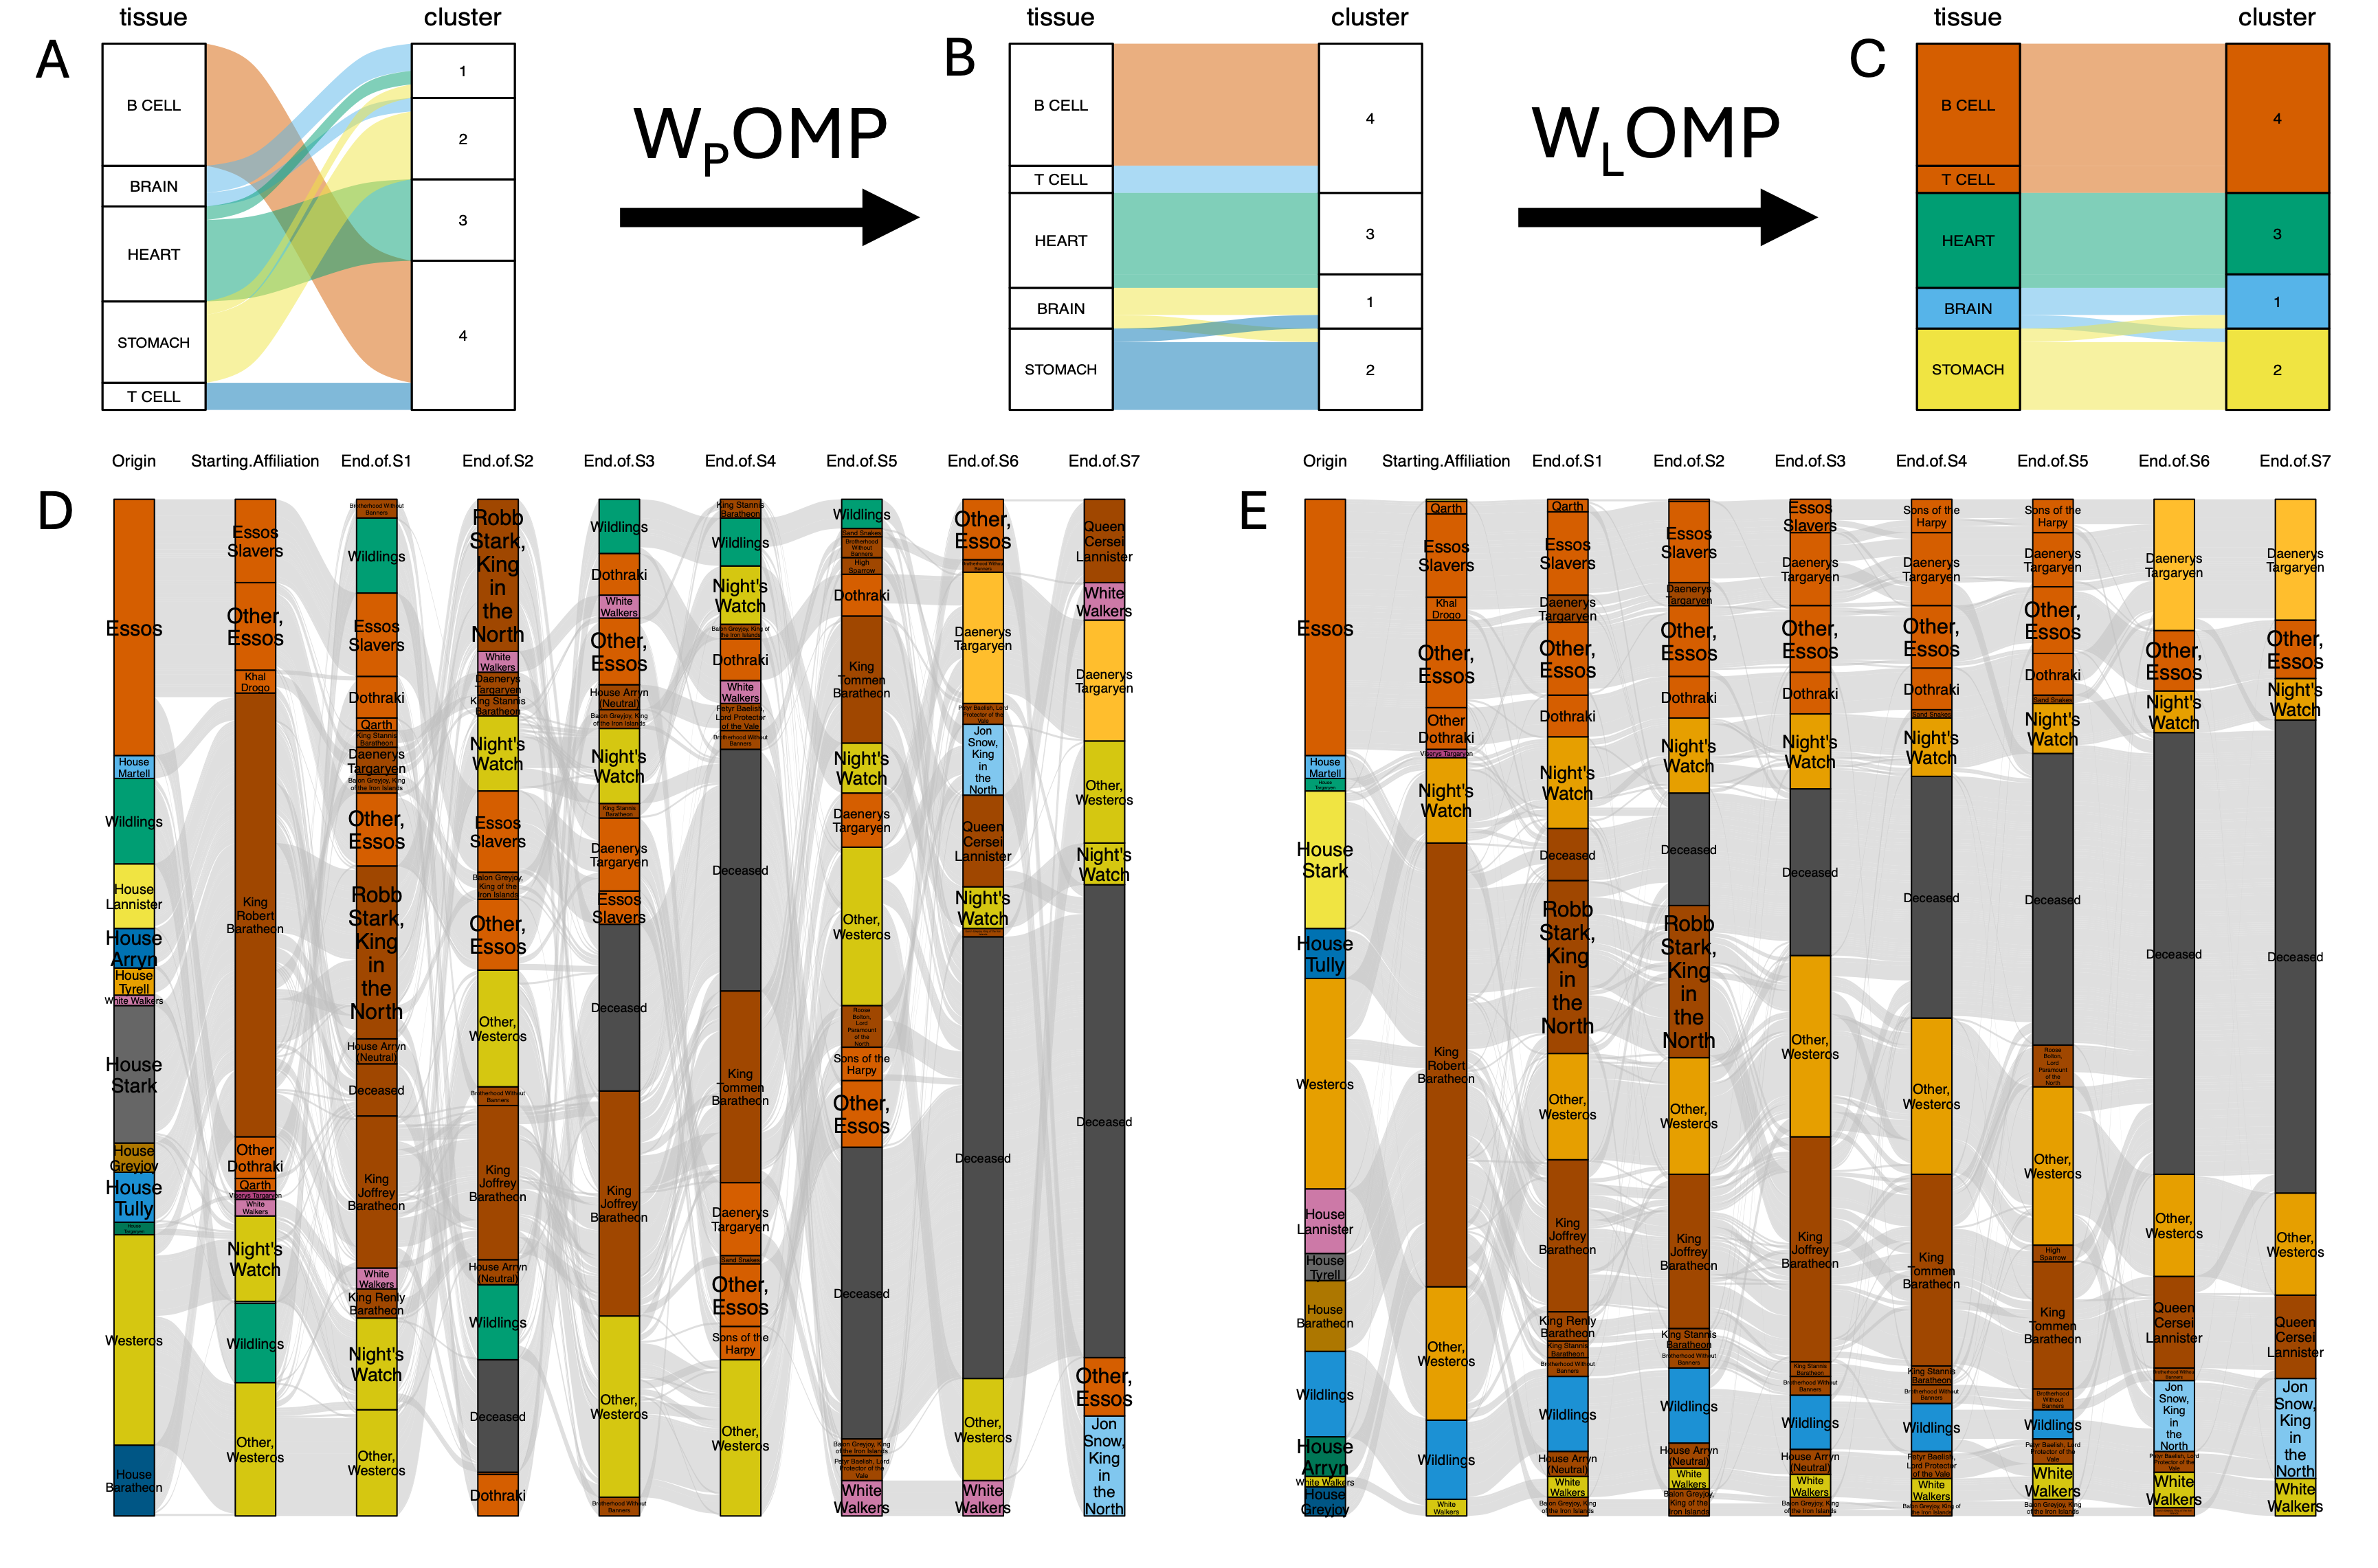
Figure 1: Overview of wompwomp, illustrating tissue-to-cluster mapping and Game of Thrones affiliation examples before and after optimization.
The alluvial plot is defined over n observations and m categorical variables, each variable inducing a partition of the observations into blocks. The visualization requires a permutation of variables (layer order) and a permutation of blocks within each layer, subject to the constraint that block membership is contiguous. The combinatorial space of valid permutations grows rapidly with the number of blocks and layers, making brute-force optimization intractable.
The first optimization, W_POMP, seeks to minimize the weighted sum of edge crossings between adjacent layers. The loss function L is defined over all pairs of observations and adjacent layers, penalizing crossings weighted by observation multiplicity. The second optimization, W_LOMP, aims to maximize the total matched weight of color assignments between blocks in adjacent layers, formalized as M.
Algorithmic Solution: NeighborNet for Block Ordering
The W_POMP problem is NP-hard, generalizing the Weighted One-Layer Free Problem (WOLF) to multipartite graphs. The authors adapt the NeighborNet algorithm, originally designed for constructing circular split systems in phylogenetics, to generate a cycle ordering of blocks that minimizes edge crossings. The approach involves:
- Constructing a Ksum×Ksum distance matrix between blocks, with entries c⋅(−log(wij)) where wij is the overlap weight.
- Running NeighborNet to obtain a circular ordering of blocks.
- Determining the optimal starting point and layer order via a TSP solver on the induced m×m distance matrix.
- Efficiently computing the objective function using a Fenwick tree for prefix sums, yielding O(m⋅nlogn) time per evaluation.
This pipeline is implemented in wompwomp::data_sort(), with options for alternative heuristics (random, alphabetical, greedy_WOLF, greedy_WBLF, TSP).
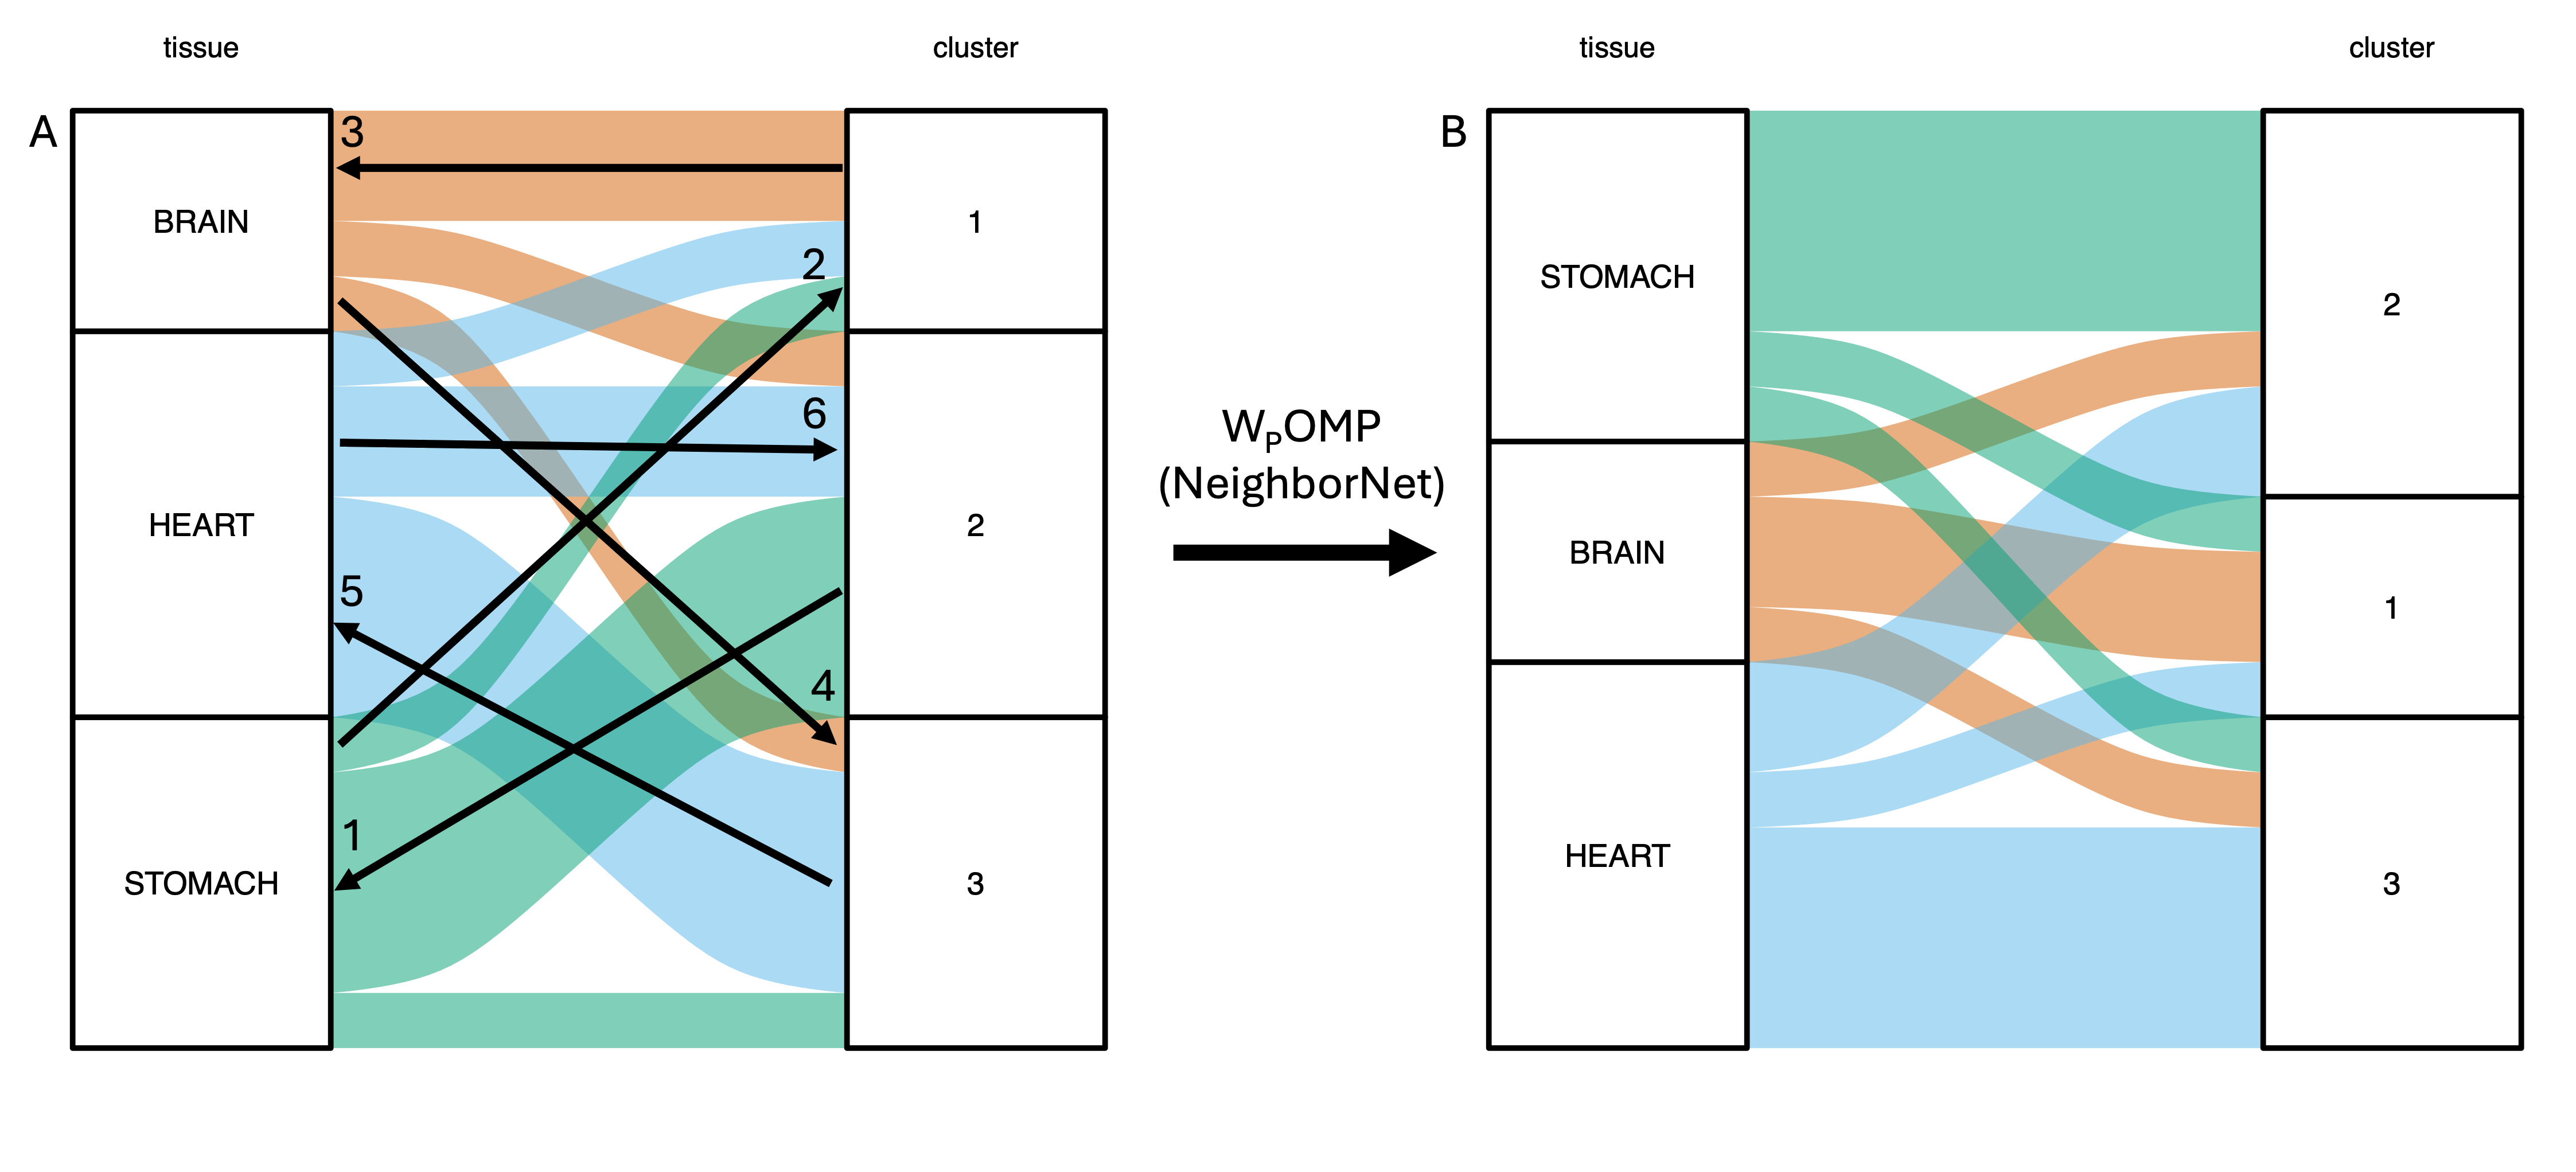
Figure 2: Walkthrough of wompwomp on a two-layer example, showing the reduction in edge crossings after NeighborNet-based sorting.
Color Assignment Optimization
For W_LOMP, the algorithm computes overlap scores between blocks in adjacent layers and applies hierarchical clustering (Leiden or Louvain) to group similar blocks for color assignment. Alternatively, a reference layer can be selected, and colors propagated based on maximal overlap. The time complexity is O(m⋅Ksum+KsumlogKsum), with O(Ksum2) space.
Empirical Results and Applications
Game of Thrones Affiliation Tracking
The utility of wompwomp is demonstrated on a dataset tracking character affiliations across nine seasons. Compared to random, alphabetical, and size-based block orderings, wompwomp achieves a substantial reduction in the objective function (from 343,087 to 62,905), clarifying persistent affiliations and transitions.
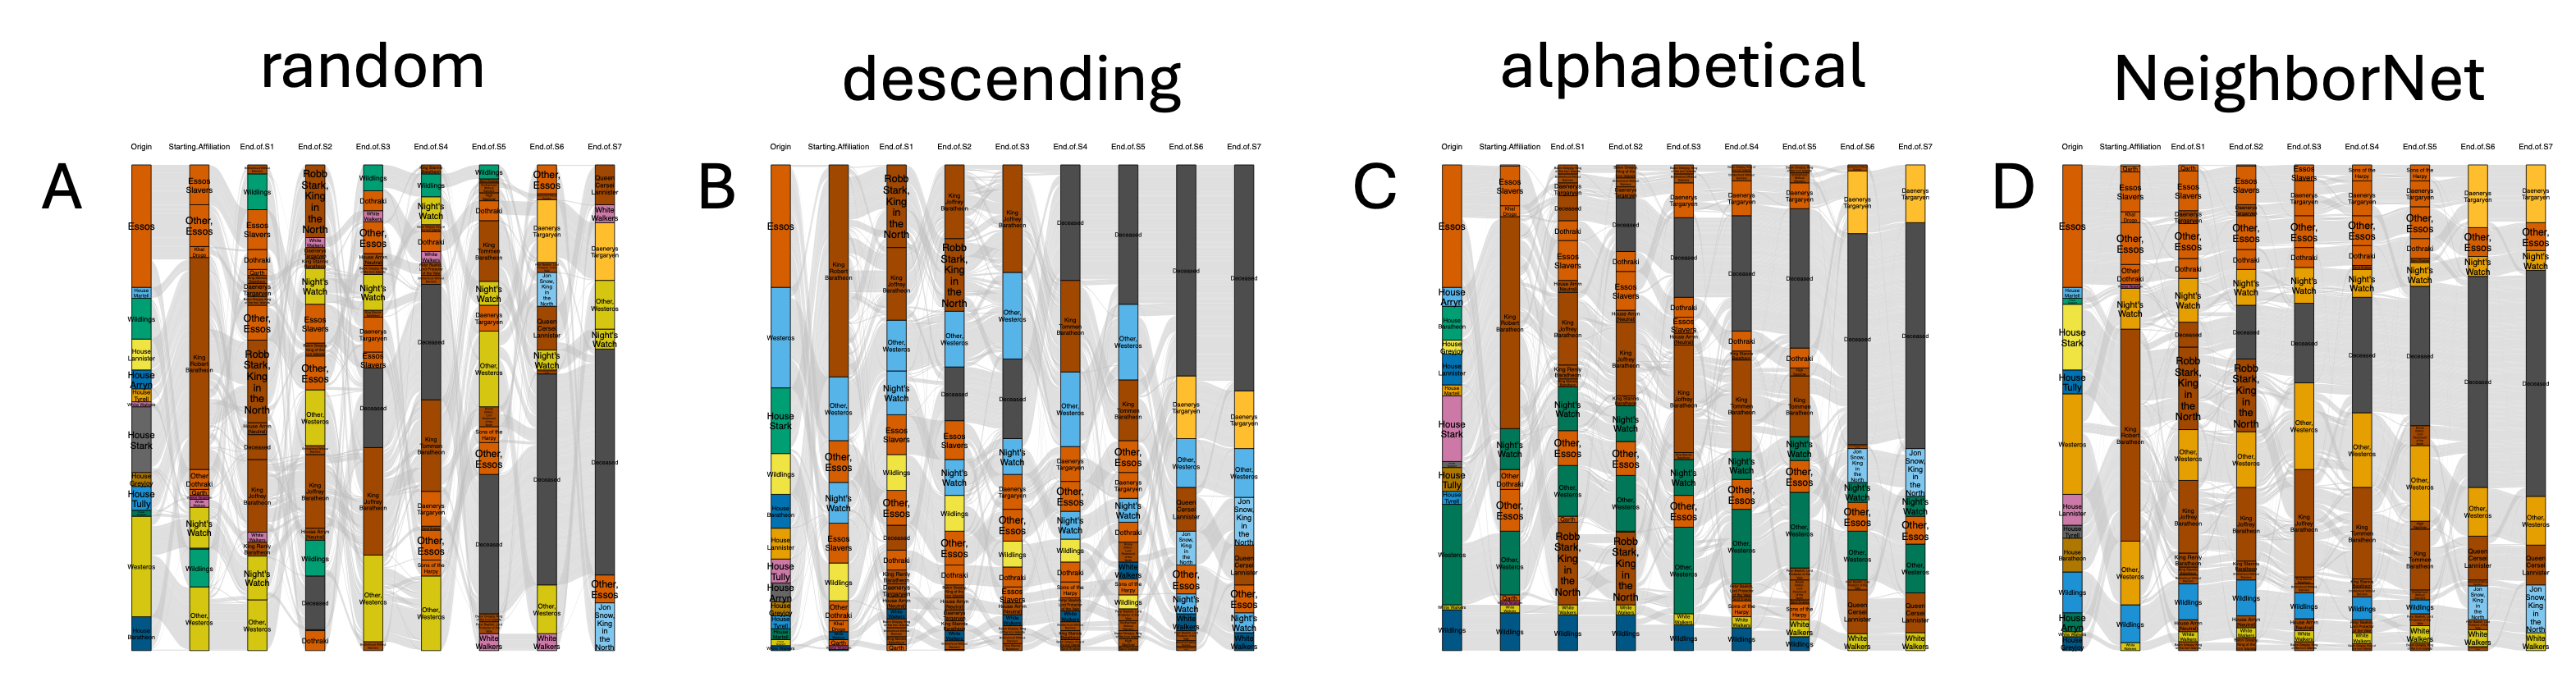
Figure 3: Game of Thrones affiliations example, comparing random, size, alphabetical, and wompwomp orderings.
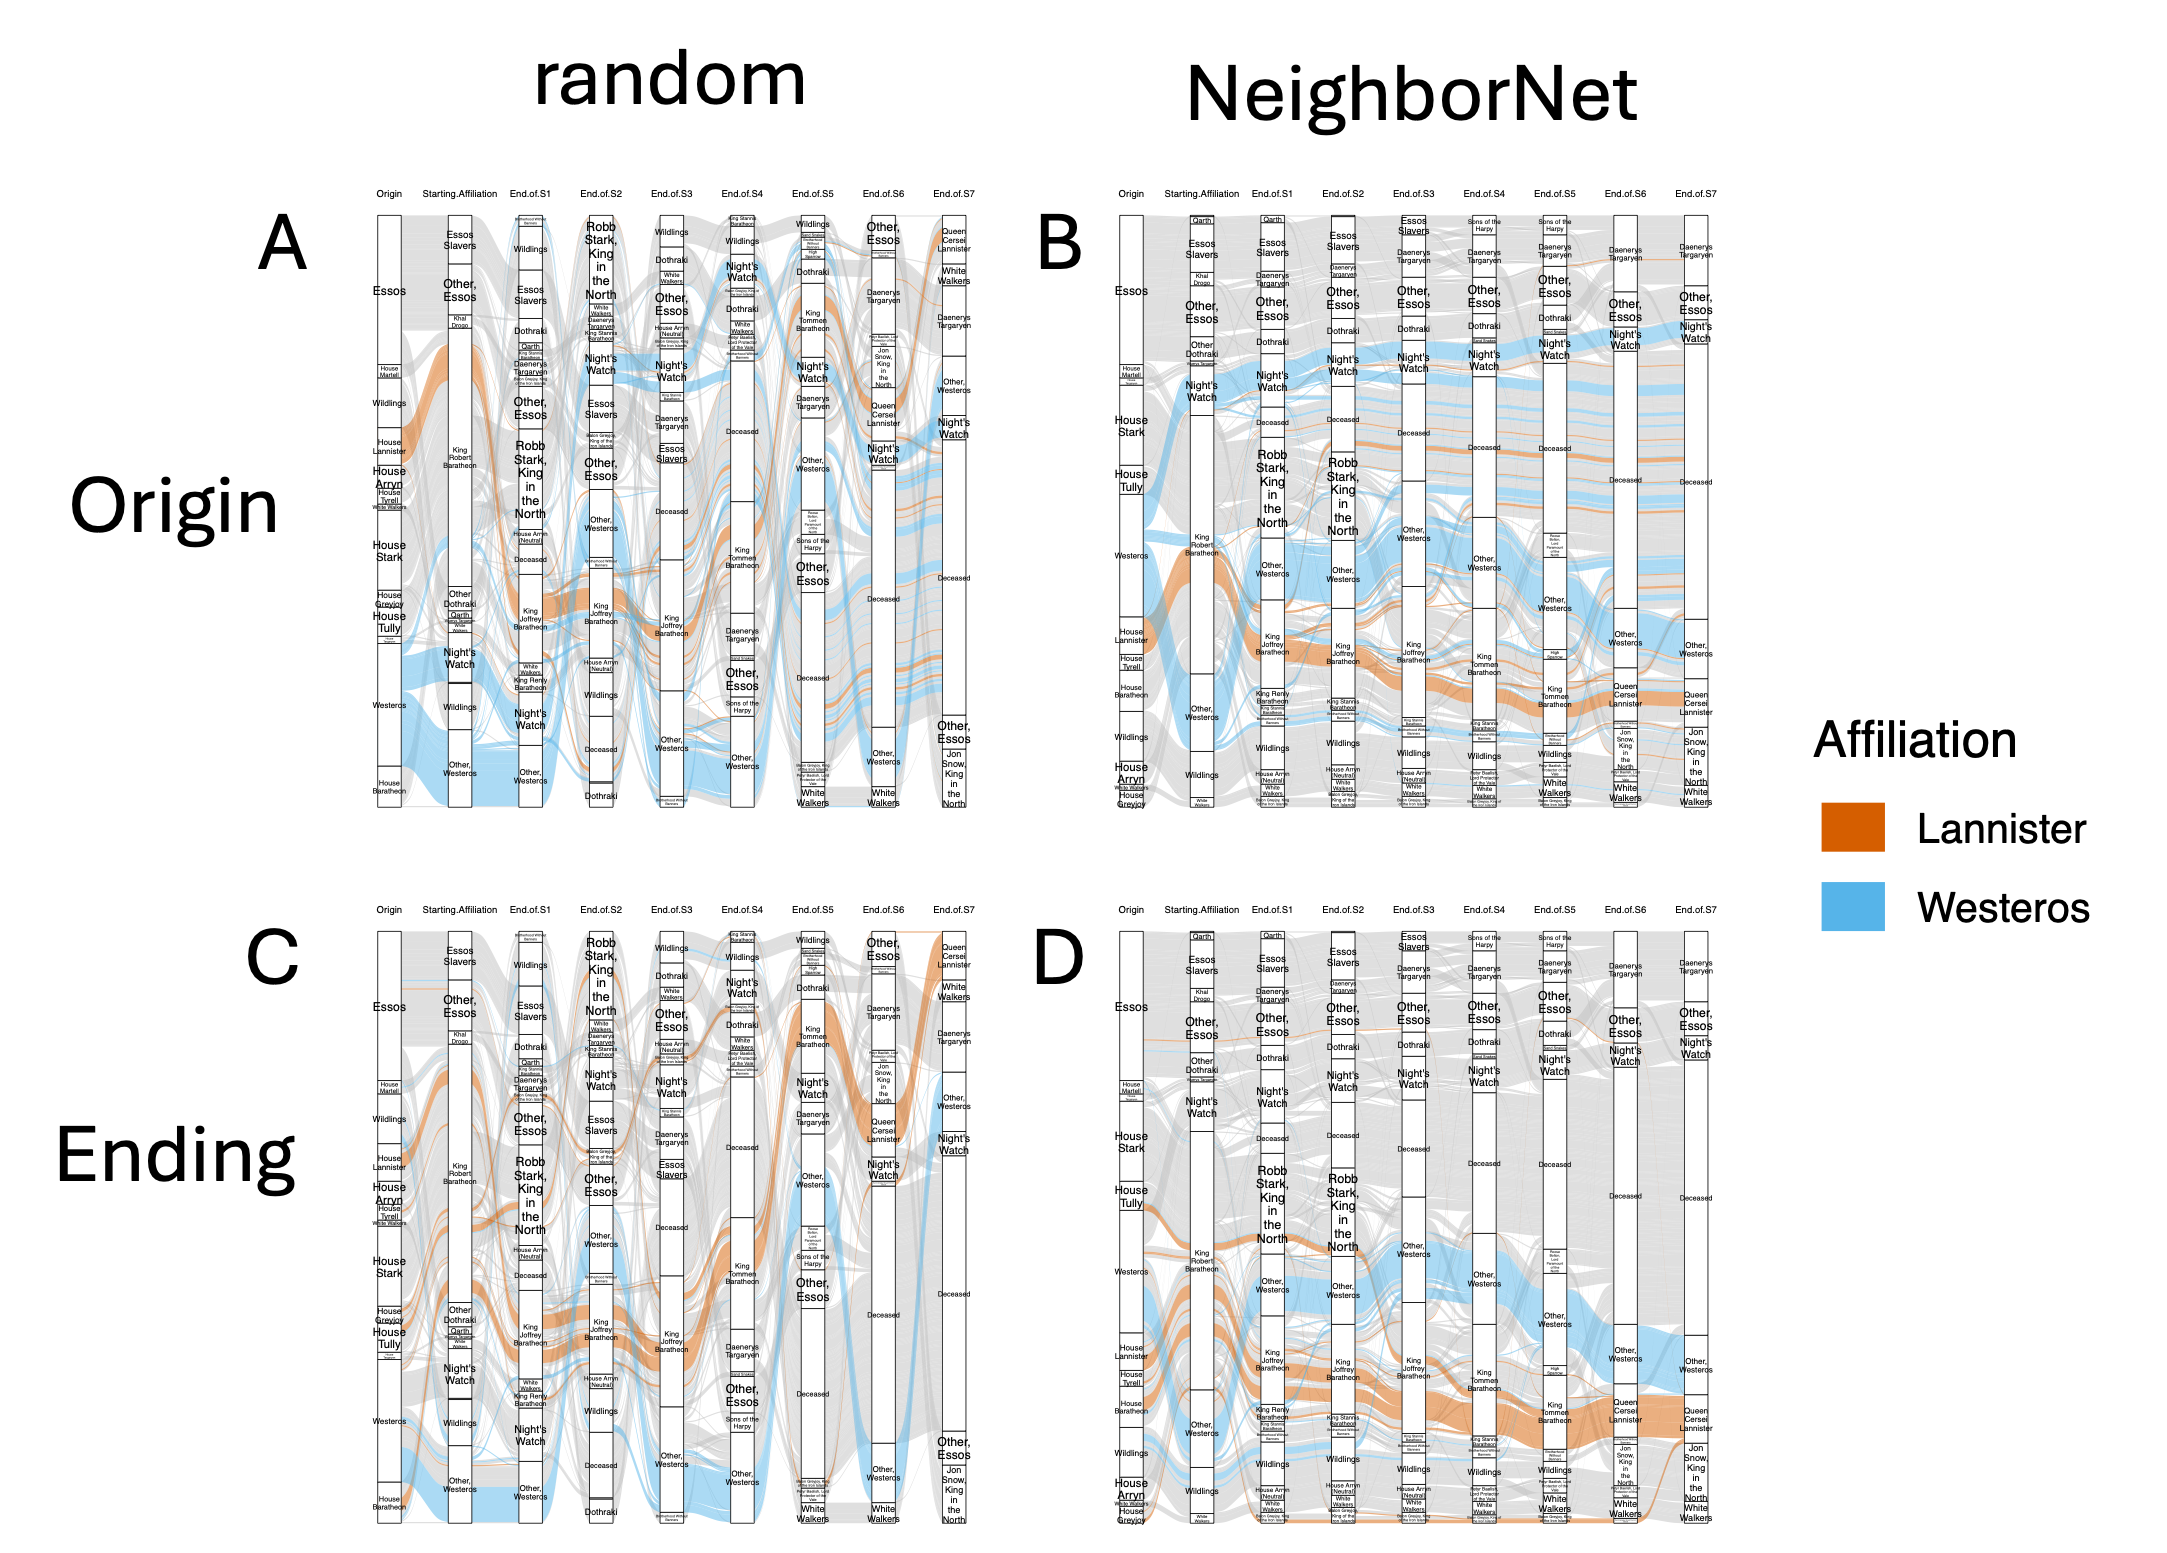
Figure 4: Band coloring by affiliation, showing improved separation and interpretability after wompwomp optimization.
scRNA-seq Gene Expression
On a scRNA-seq dataset with 8 tissues and 8 mouse strains, wompwomp reduces the objective function from 6.06×10¹⁰ to 2.81×10¹⁰, revealing interpretable biological structure such as sex- and strain-specific gene expression patterns.
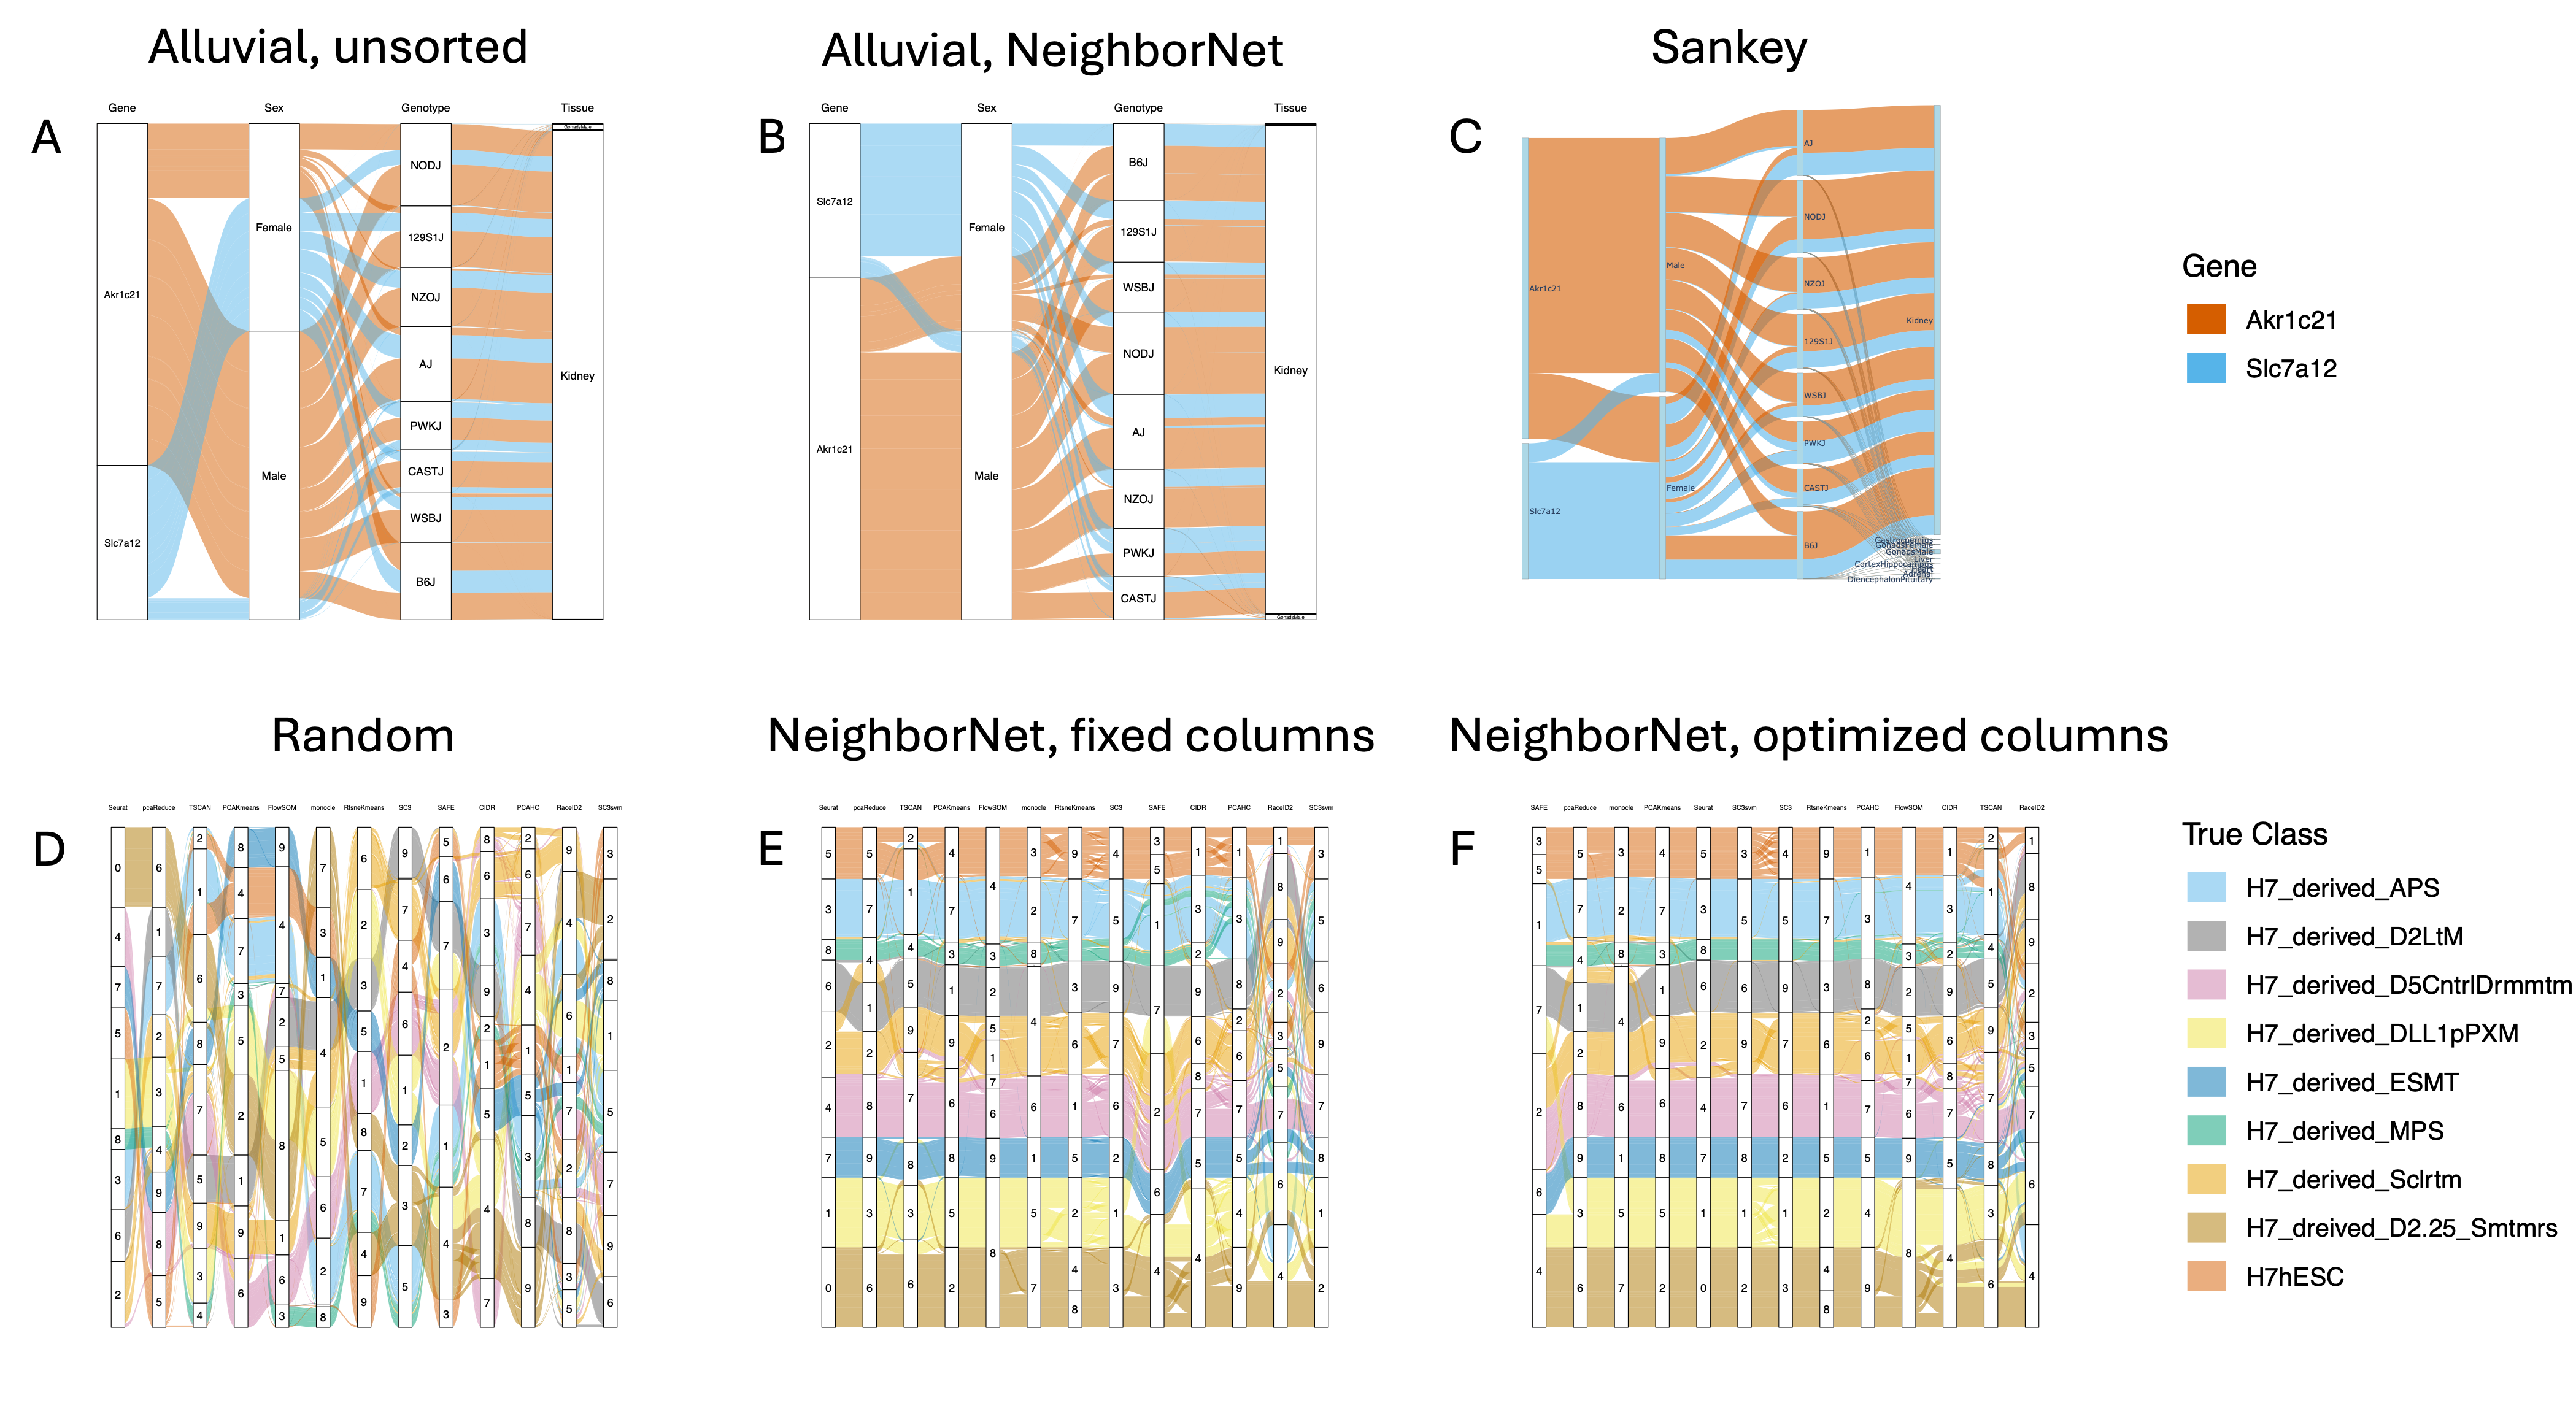
Figure 5: Alluvial plots of scRNA-seq data before and after wompwomp sorting and coloring, with Sankey diagram for comparison.
Clustering Method Comparison
Visualization of 13 clustering methods on 531 cells shows that wompwomp, with optimized layer order, reduces the objective from 625,967 (random) to 56,374, highlighting methods with high agreement and outliers.
Comparison of nnU-Net models for kidney tumor segmentation reveals that wompwomp clarifies performance differences and demographic effects, with objective reductions from 467 to 407 (model comparison) and from 1288 to 1081 (demographic stratification).
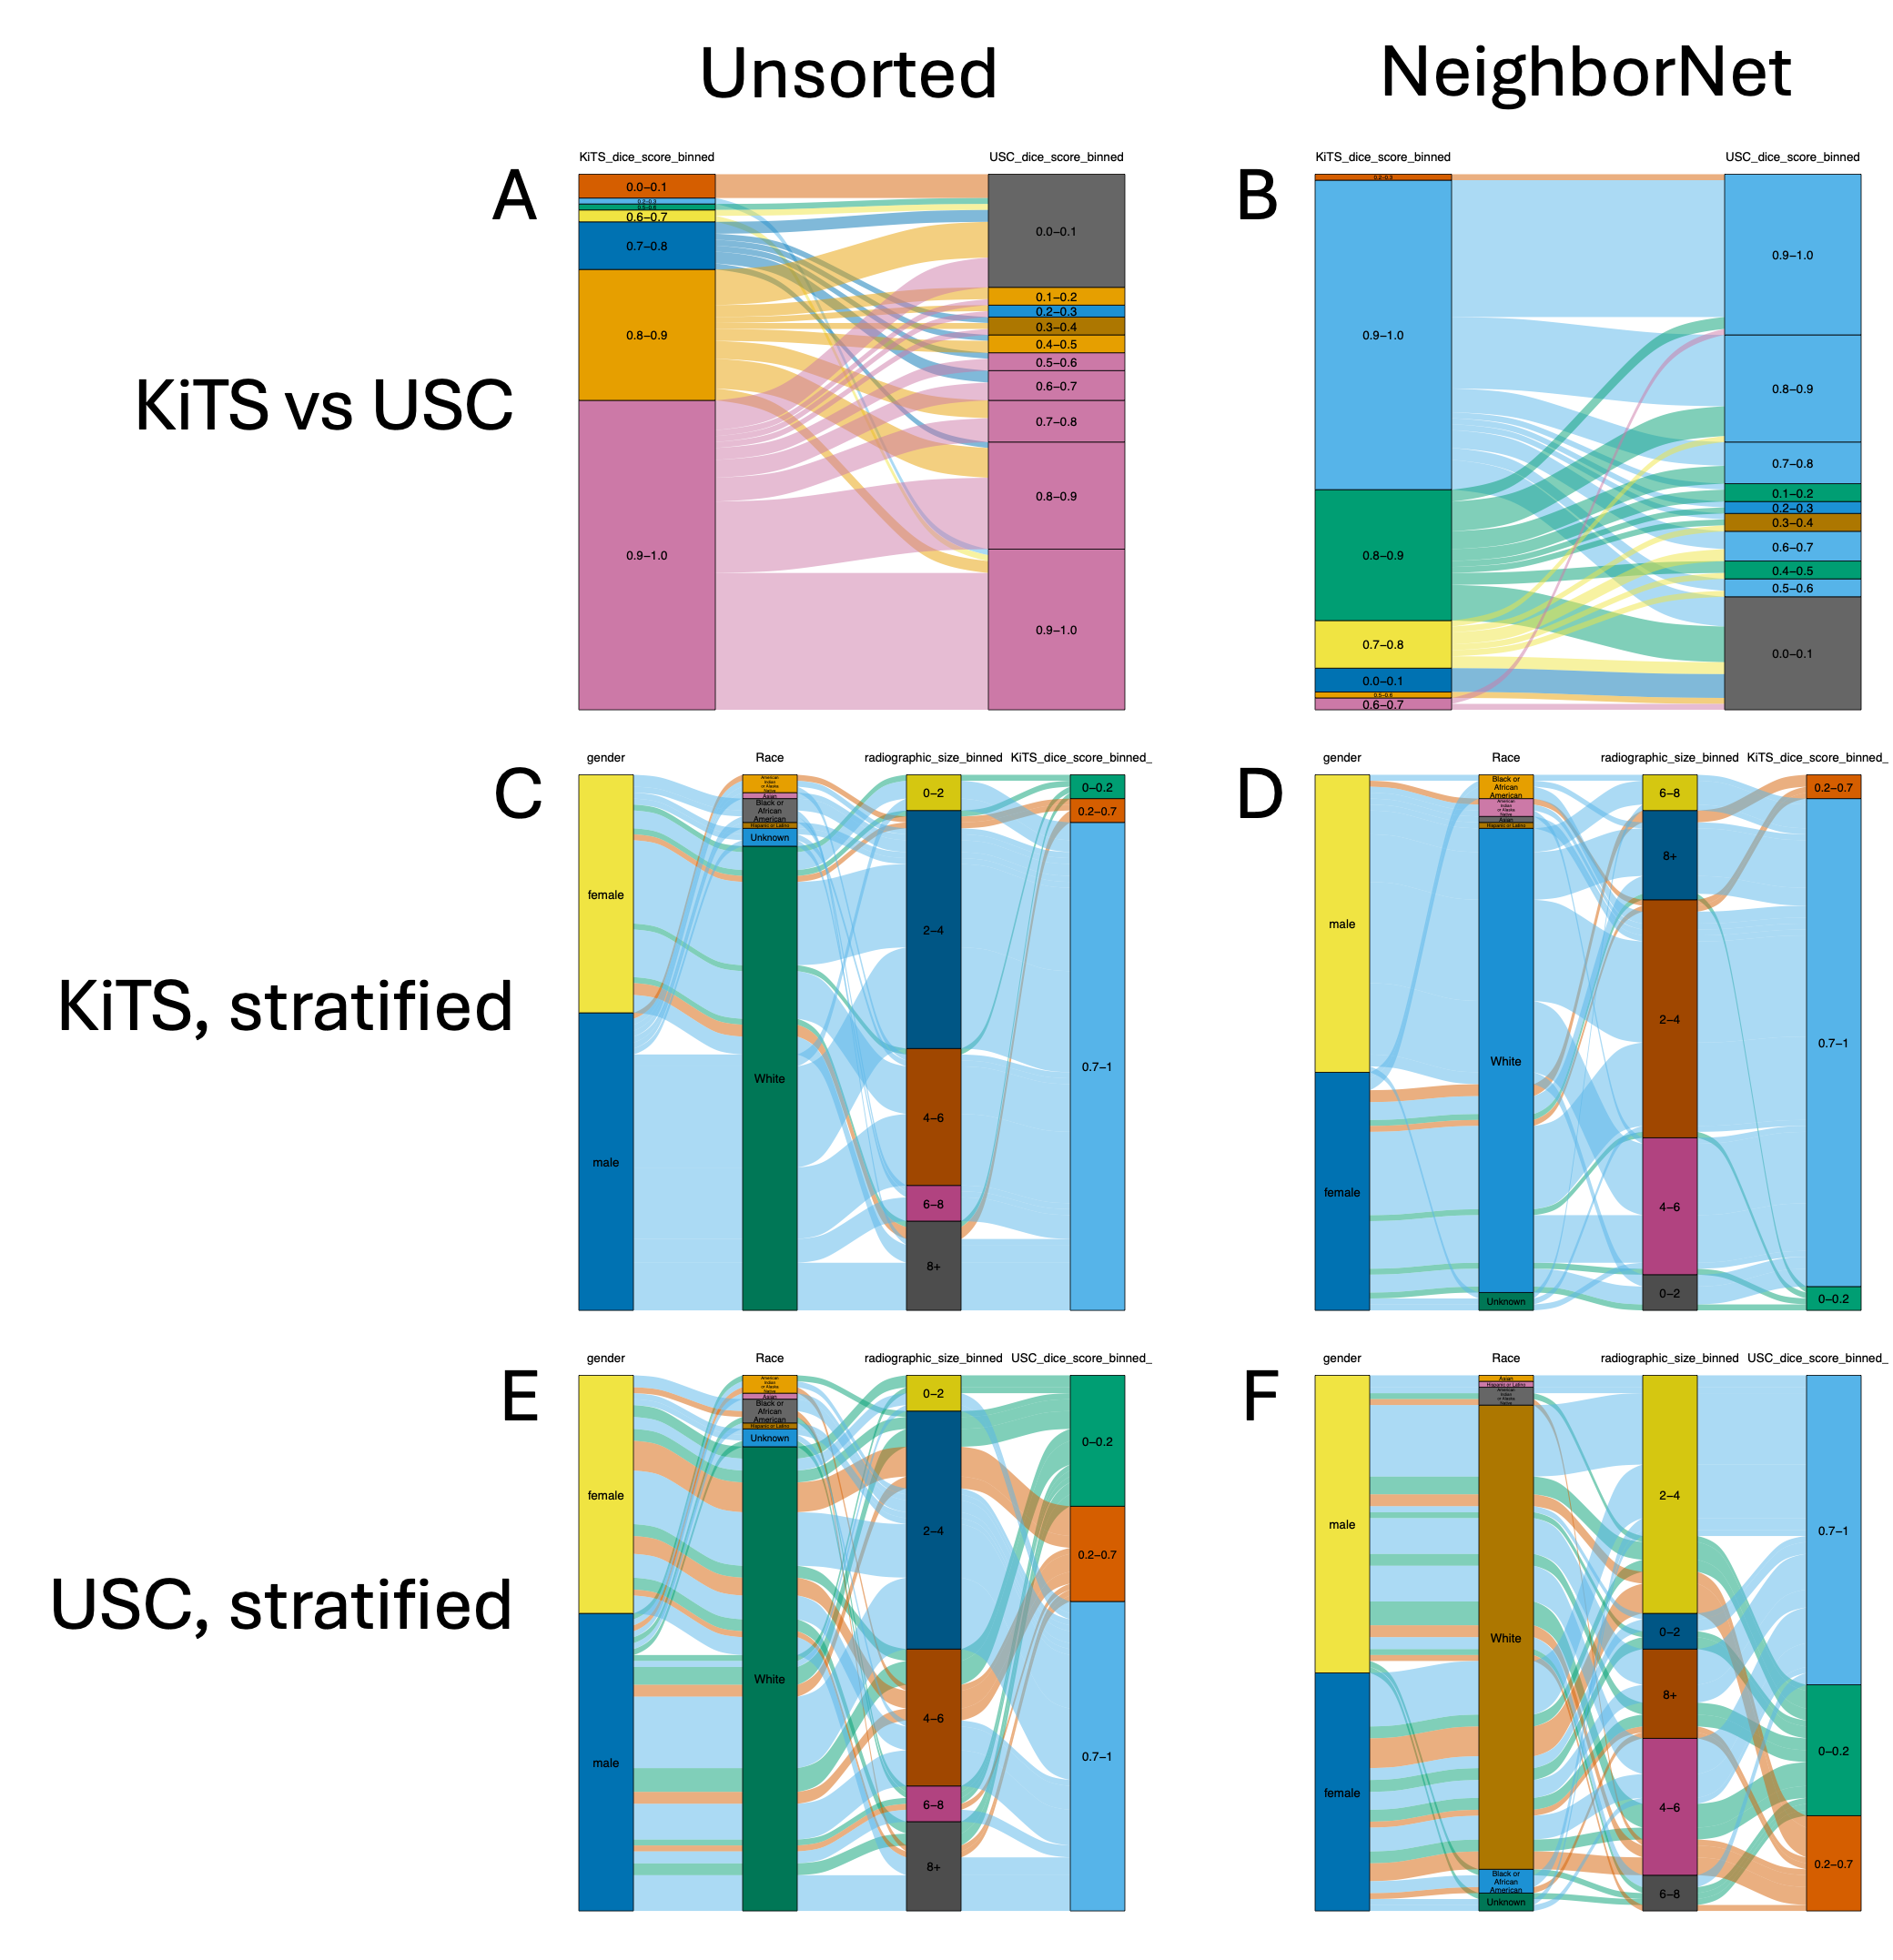
Figure 6: Machine learning model comparison and demographic stratification, showing unsorted and wompwomp-optimized alluvial plots.
Implementation and Computational Considerations
The wompwomp package is implemented in R (≥ 3.5.0), interoperating with standard data.frame structures and leveraging ggplot2 extensions for visualization. The NeighborNet algorithm is accessed via reticulate and SplitsPy, with conda/virtualenv support. The pipeline consists of data preprocessing, block/layer sorting, and color assignment, with efficient computation of crossing objectives.
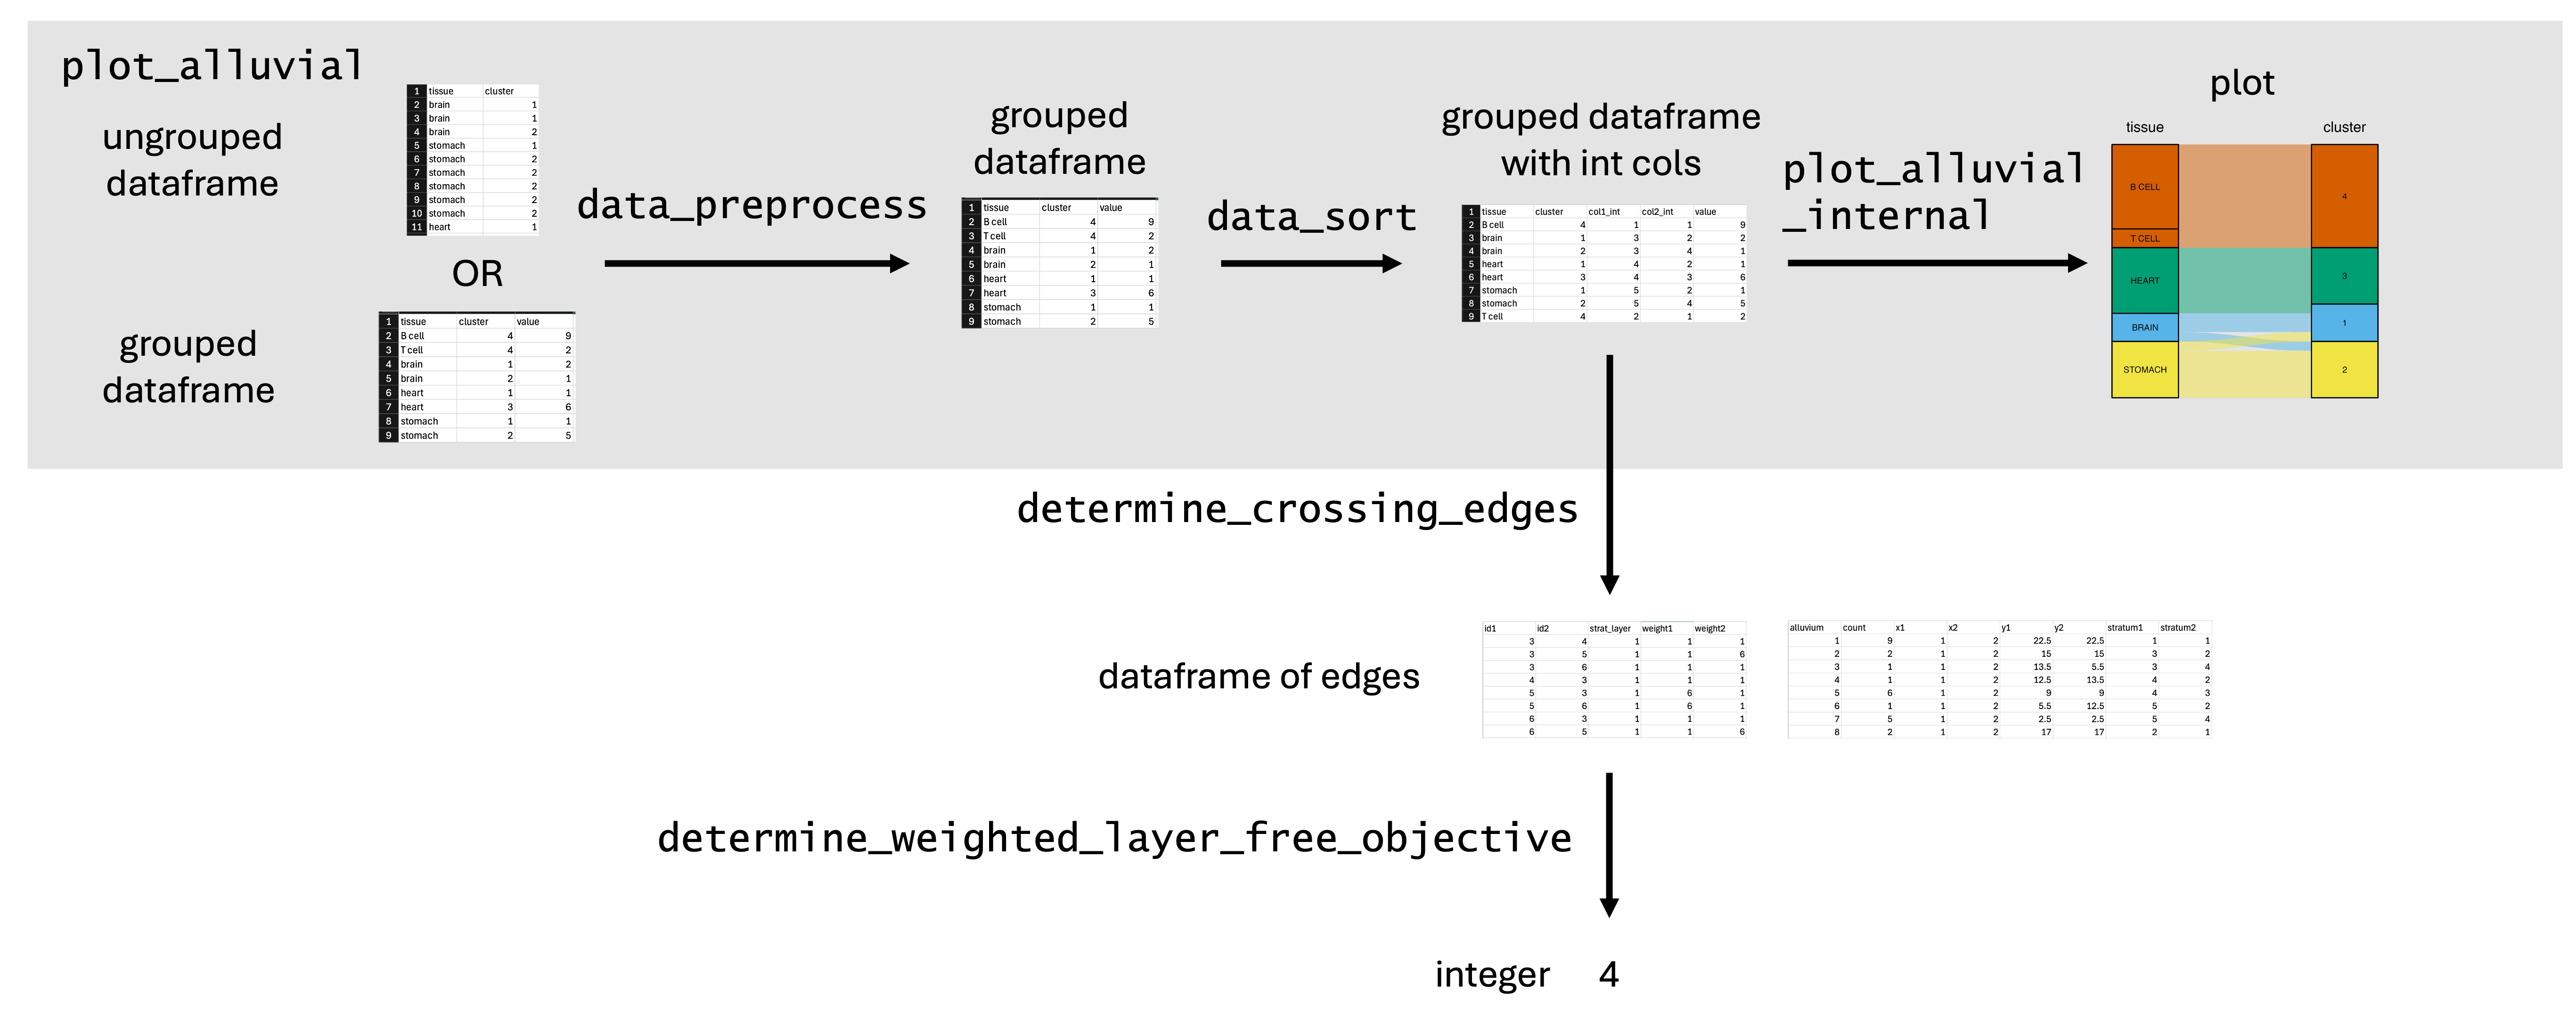
Figure 7: wompwomp schematic, illustrating the data preprocessing, sorting, and plotting workflow.
Theoretical and Practical Implications
The formalization of alluvial plot optimization as W_POMP-W_LOMP provides a principled framework for improving interpretability in multivariate categorical data visualization. The adaptation of NeighborNet offers a scalable heuristic with strong empirical performance, outperforming common manual or heuristic orderings. The approach generalizes to Sankey diagrams, with caveats regarding the preservation of individual paths and interpretability.
Limitations include handling of one-to-many relationships, lack of user-supplied priors, and difficulty in fixing layers. Future work may incorporate greedy refinement post-NeighborNet initialization, integration of domain-specific constraints, and extension to continuous variables.
Conclusion
The paper establishes a rigorous combinatorial foundation for alluvial plot optimization, introduces efficient heuristic algorithms, and demonstrates broad applicability across genomics, social network analysis, and machine learning model evaluation. The wompwomp package provides a practical tool for researchers seeking to maximize the clarity and informativeness of alluvial visualizations in complex multivariate datasets.