- The paper introduces a systematic update of the complex systems keyword diagram by integrating community feedback with quantitative literature data.
- It employs network visualization and Louvain modularity maximization to reveal misalignments between public perceptions and scientific relevance.
- The study identifies four thematic clusters and advocates for dynamic, interactive visualization tools to enhance research and educational outcomes.
Updating the Complex Systems Keyword Diagram
Introduction
The field of complex systems science is inherently interdisciplinary, involving diverse topics that require a systematic organizational approach. The original keyword diagram created in 2010 prioritized personal and subjective viewpoints, resulting in an influential albeit limited depiction utilized for educational purposes. Subsequent advancements in network modeling and AI necessitate its revision. This paper outlines an attempt to systematically update the diagram using quantitative methods grounded in community feedback and literature data. Employing data from social media, reference books, online resources, and the OpenAlex database, this paper proposes an updated networked visualization of complex systems keywords. The aim is to produce a more representative topic map aligned with current scientific discourse.
Data Collection Methodology
Data were sourced from four distinct channels: community feedback, reference books, online resources, and OpenAlex keyword association. Social media platforms such as Twitter provided user-generated insights, while academic literature from recent reference books and online platforms contributed supplementary keywords. The OpenAlex API facilitated quantitative measurement of keyword relevance in published scientific works. The synthesized data maps community perceptions against rigorous literature-based association, enabling an objective, data-driven reorganization. The methodology emphasizes comprehensive keyword extraction and network construction using paired keyword relevance derived from OpenAlex searches.
Results and Network Visualization
The contrast between community perceptions and scientific relevance emerged as a focal point. Frequently mentioned keywords like "AI" and "chaos" demonstrated limited scientific relevance, pointing to misalignments between public discourse and scientific literature. Conversely, terms such as "evolution" and "networks" retained high relevance, embodying core thematic elements of complex systems.
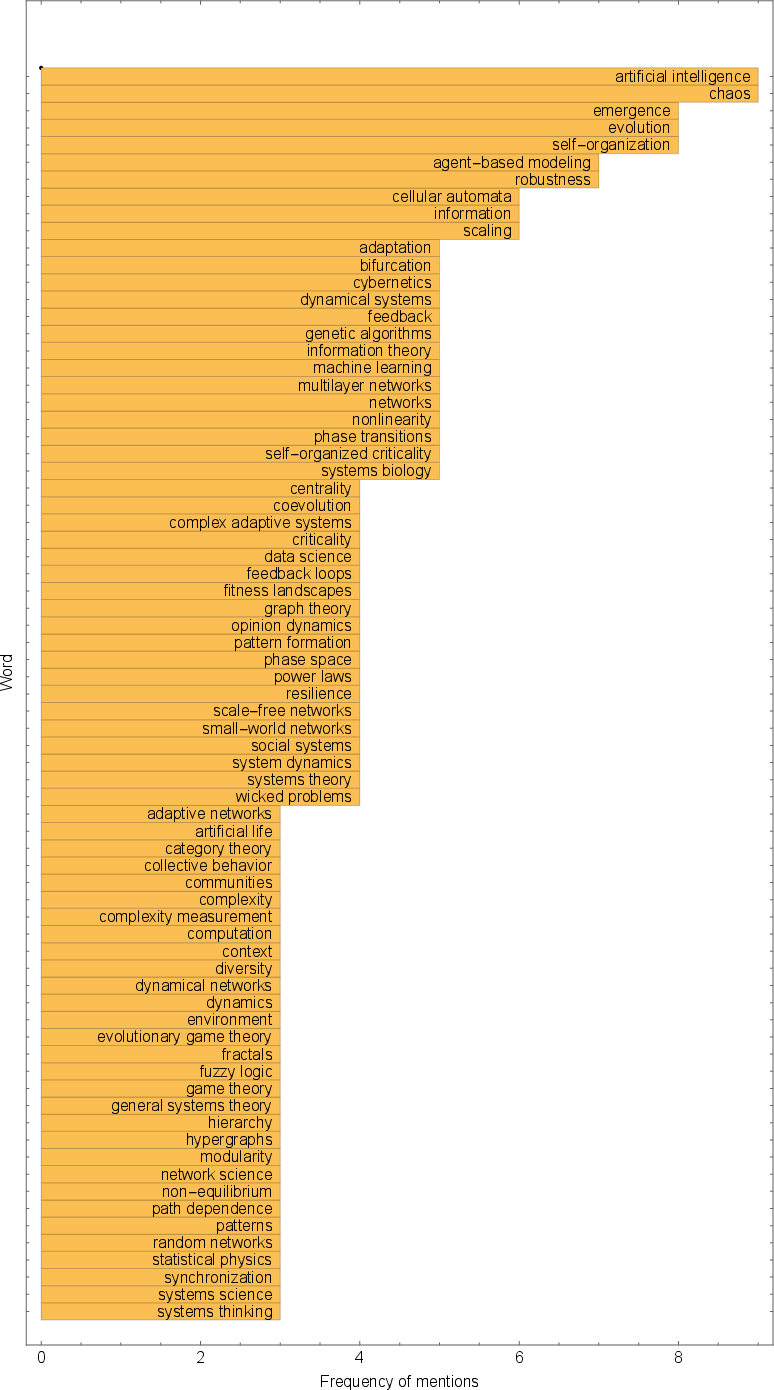
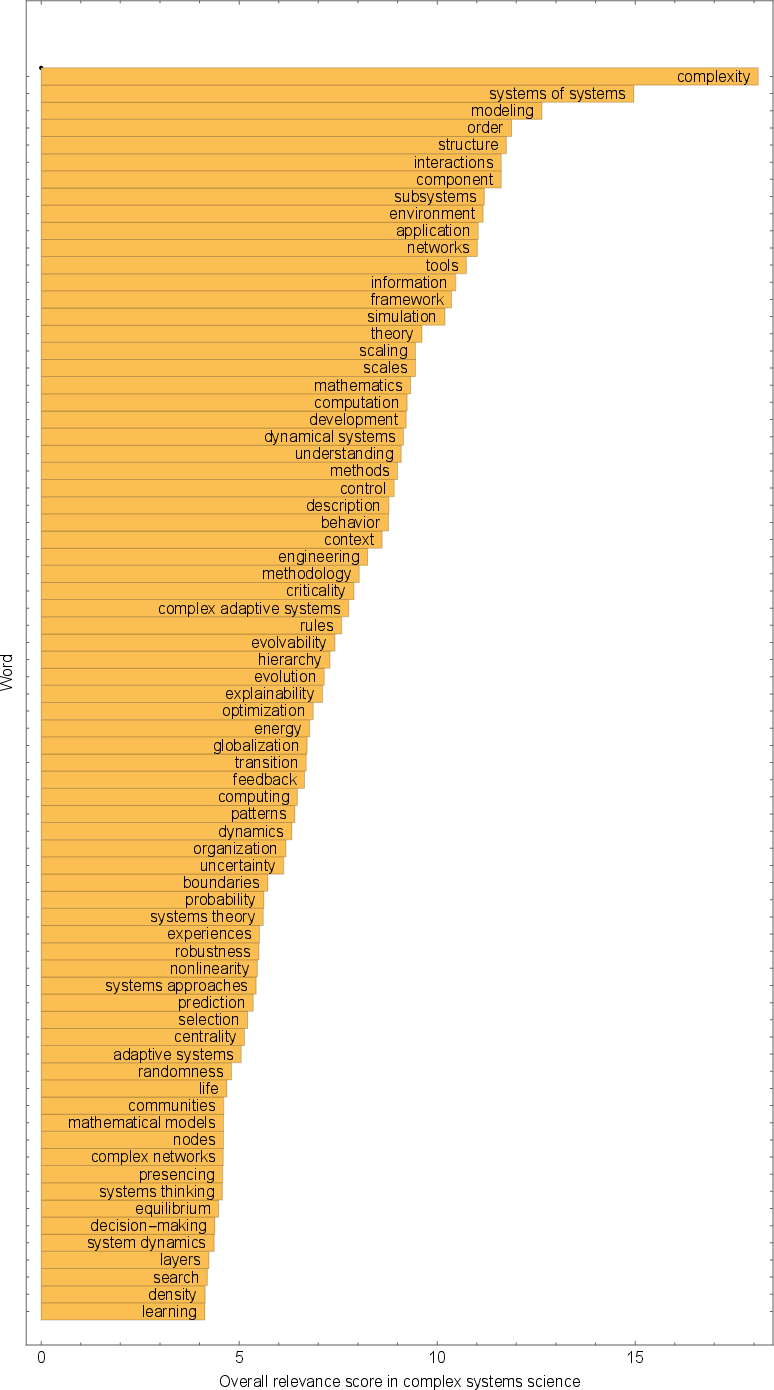

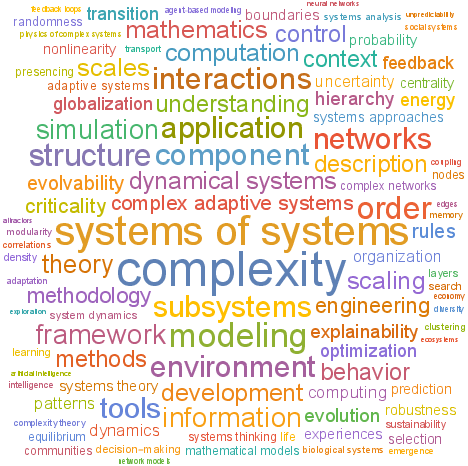
Figure 1: Keyword rankings based on mentions and relevance; disparities highlight community-scientific narrative divergence.
The adoption of Louvain modularity maximization revealed four intertwined communities, encompassing nonlinear dynamics, computational modeling, biological systems, and networks. Although distinct, these communities reflect traditional disciplinary intersections without clear separations in network visualization.
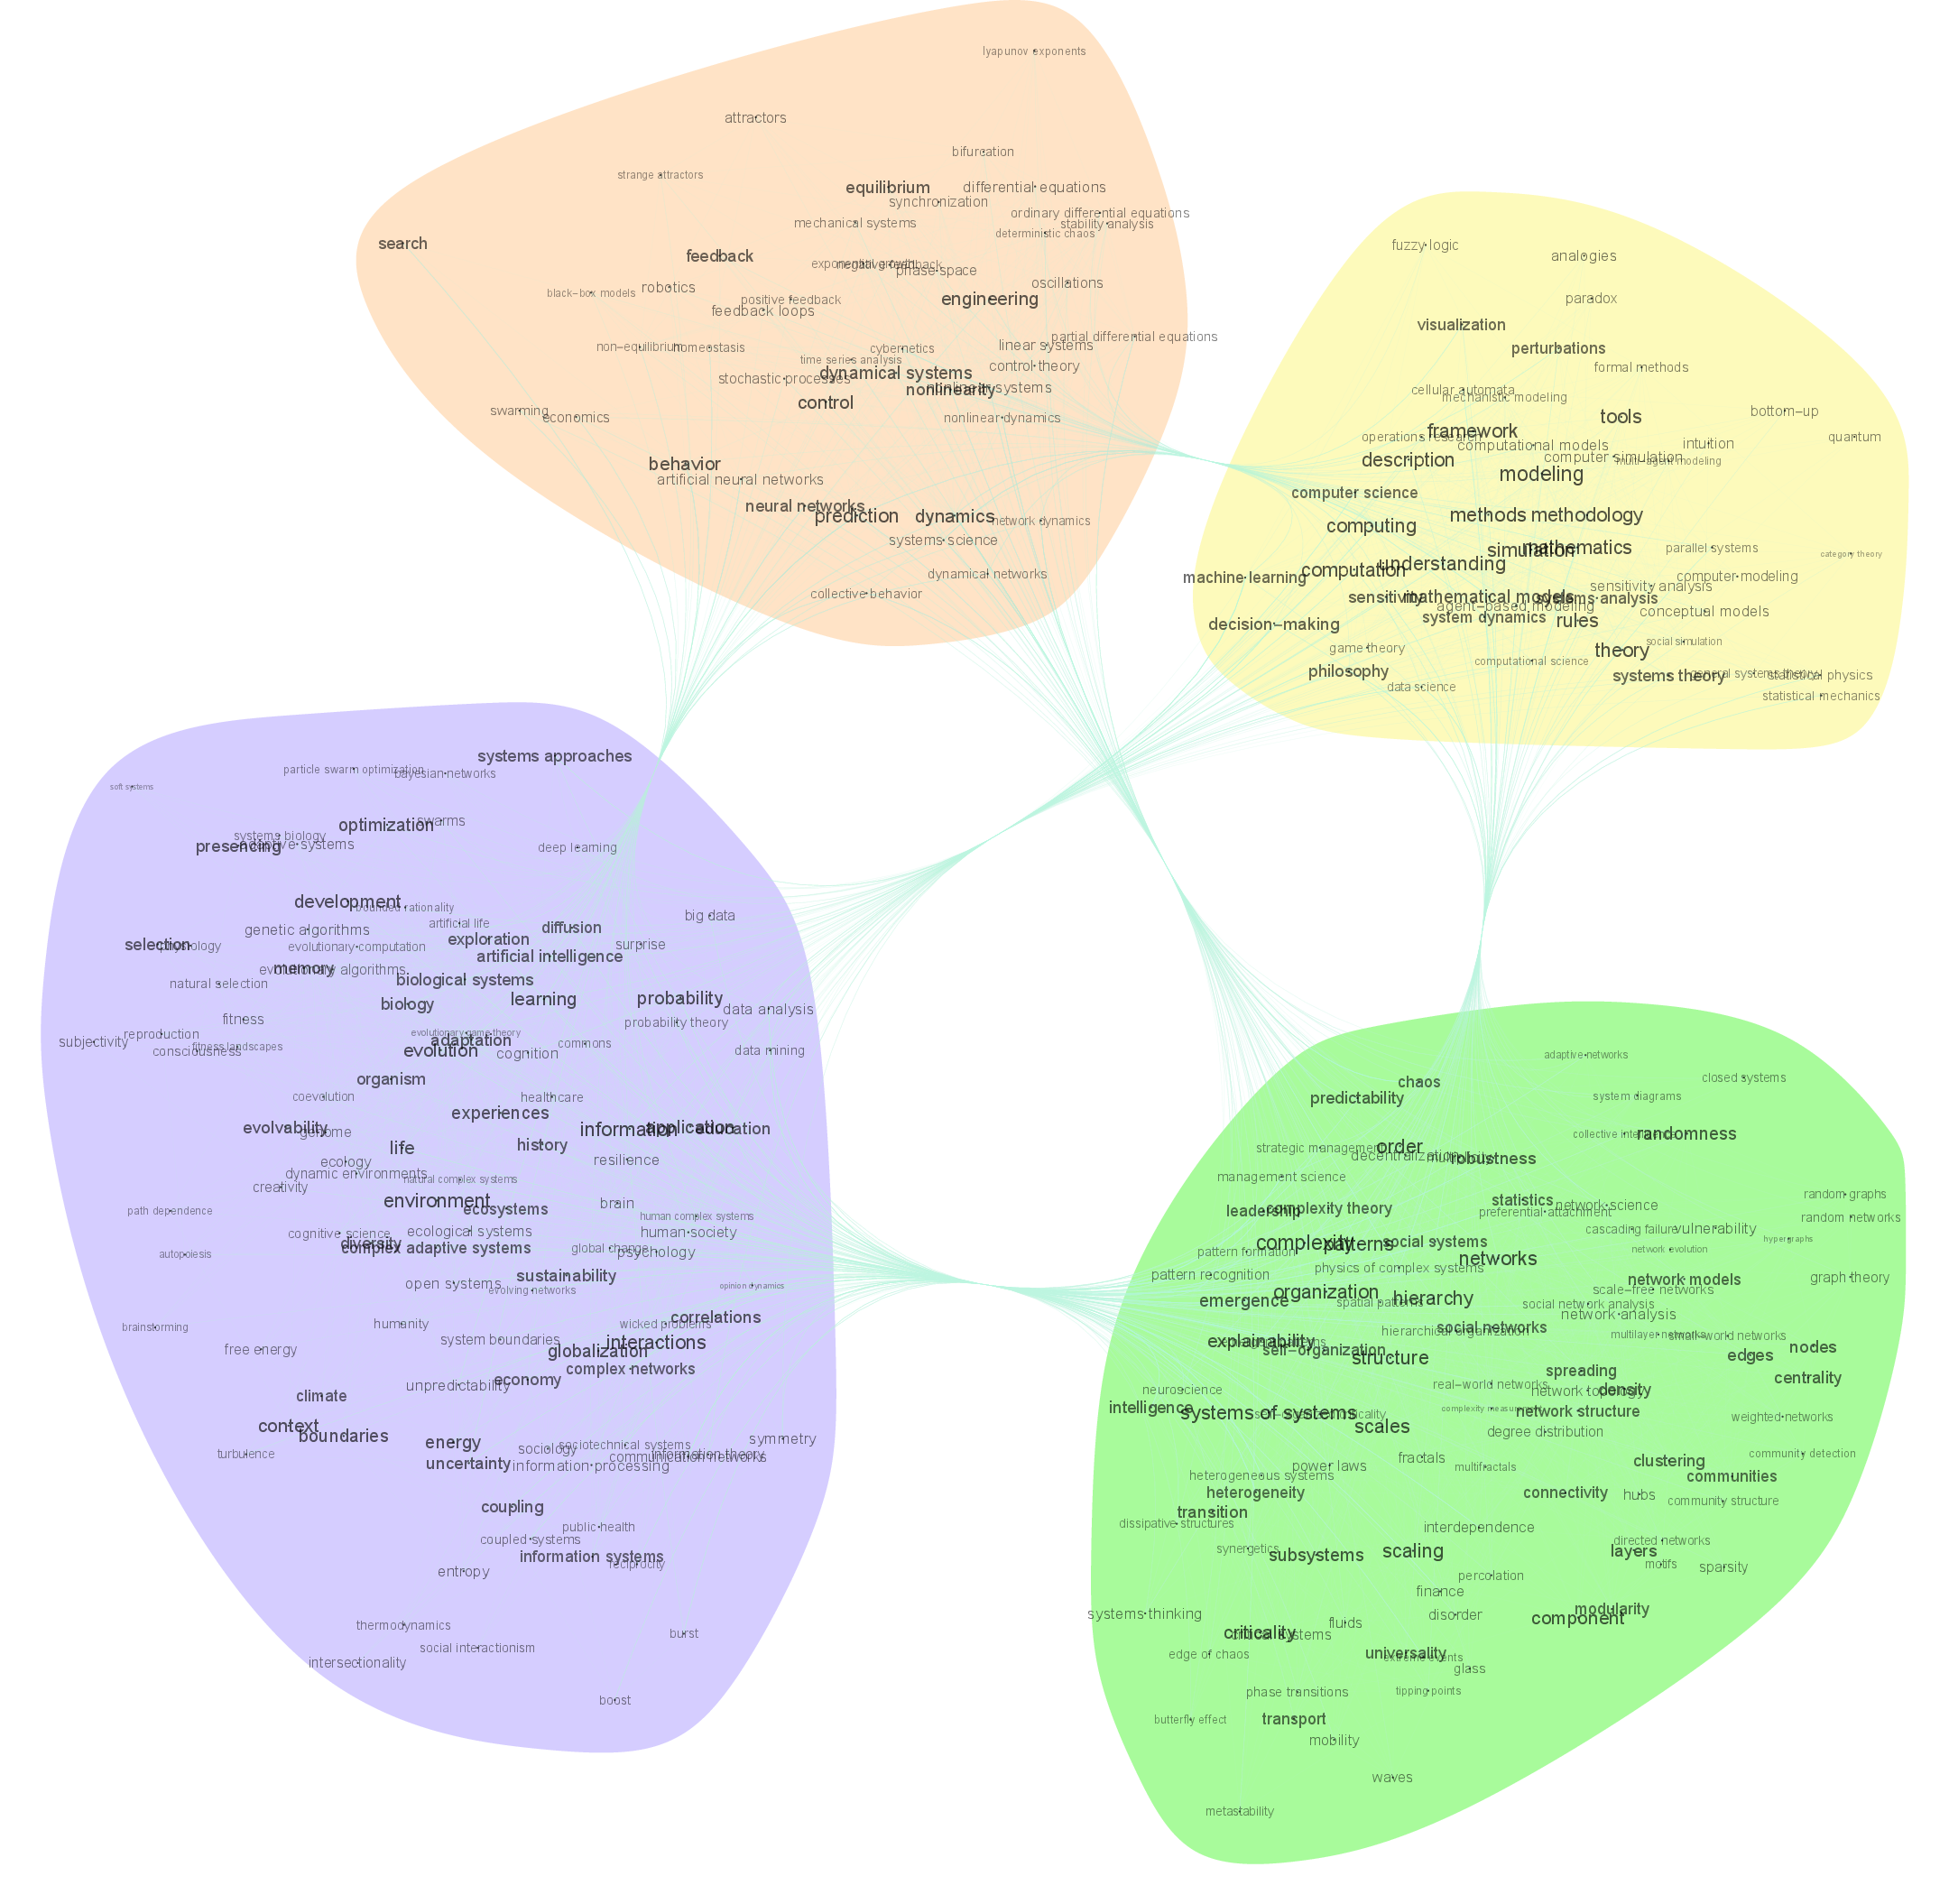
Figure 2: Louvain method detects four communities within the keyword association network, indicating thematic clusters.
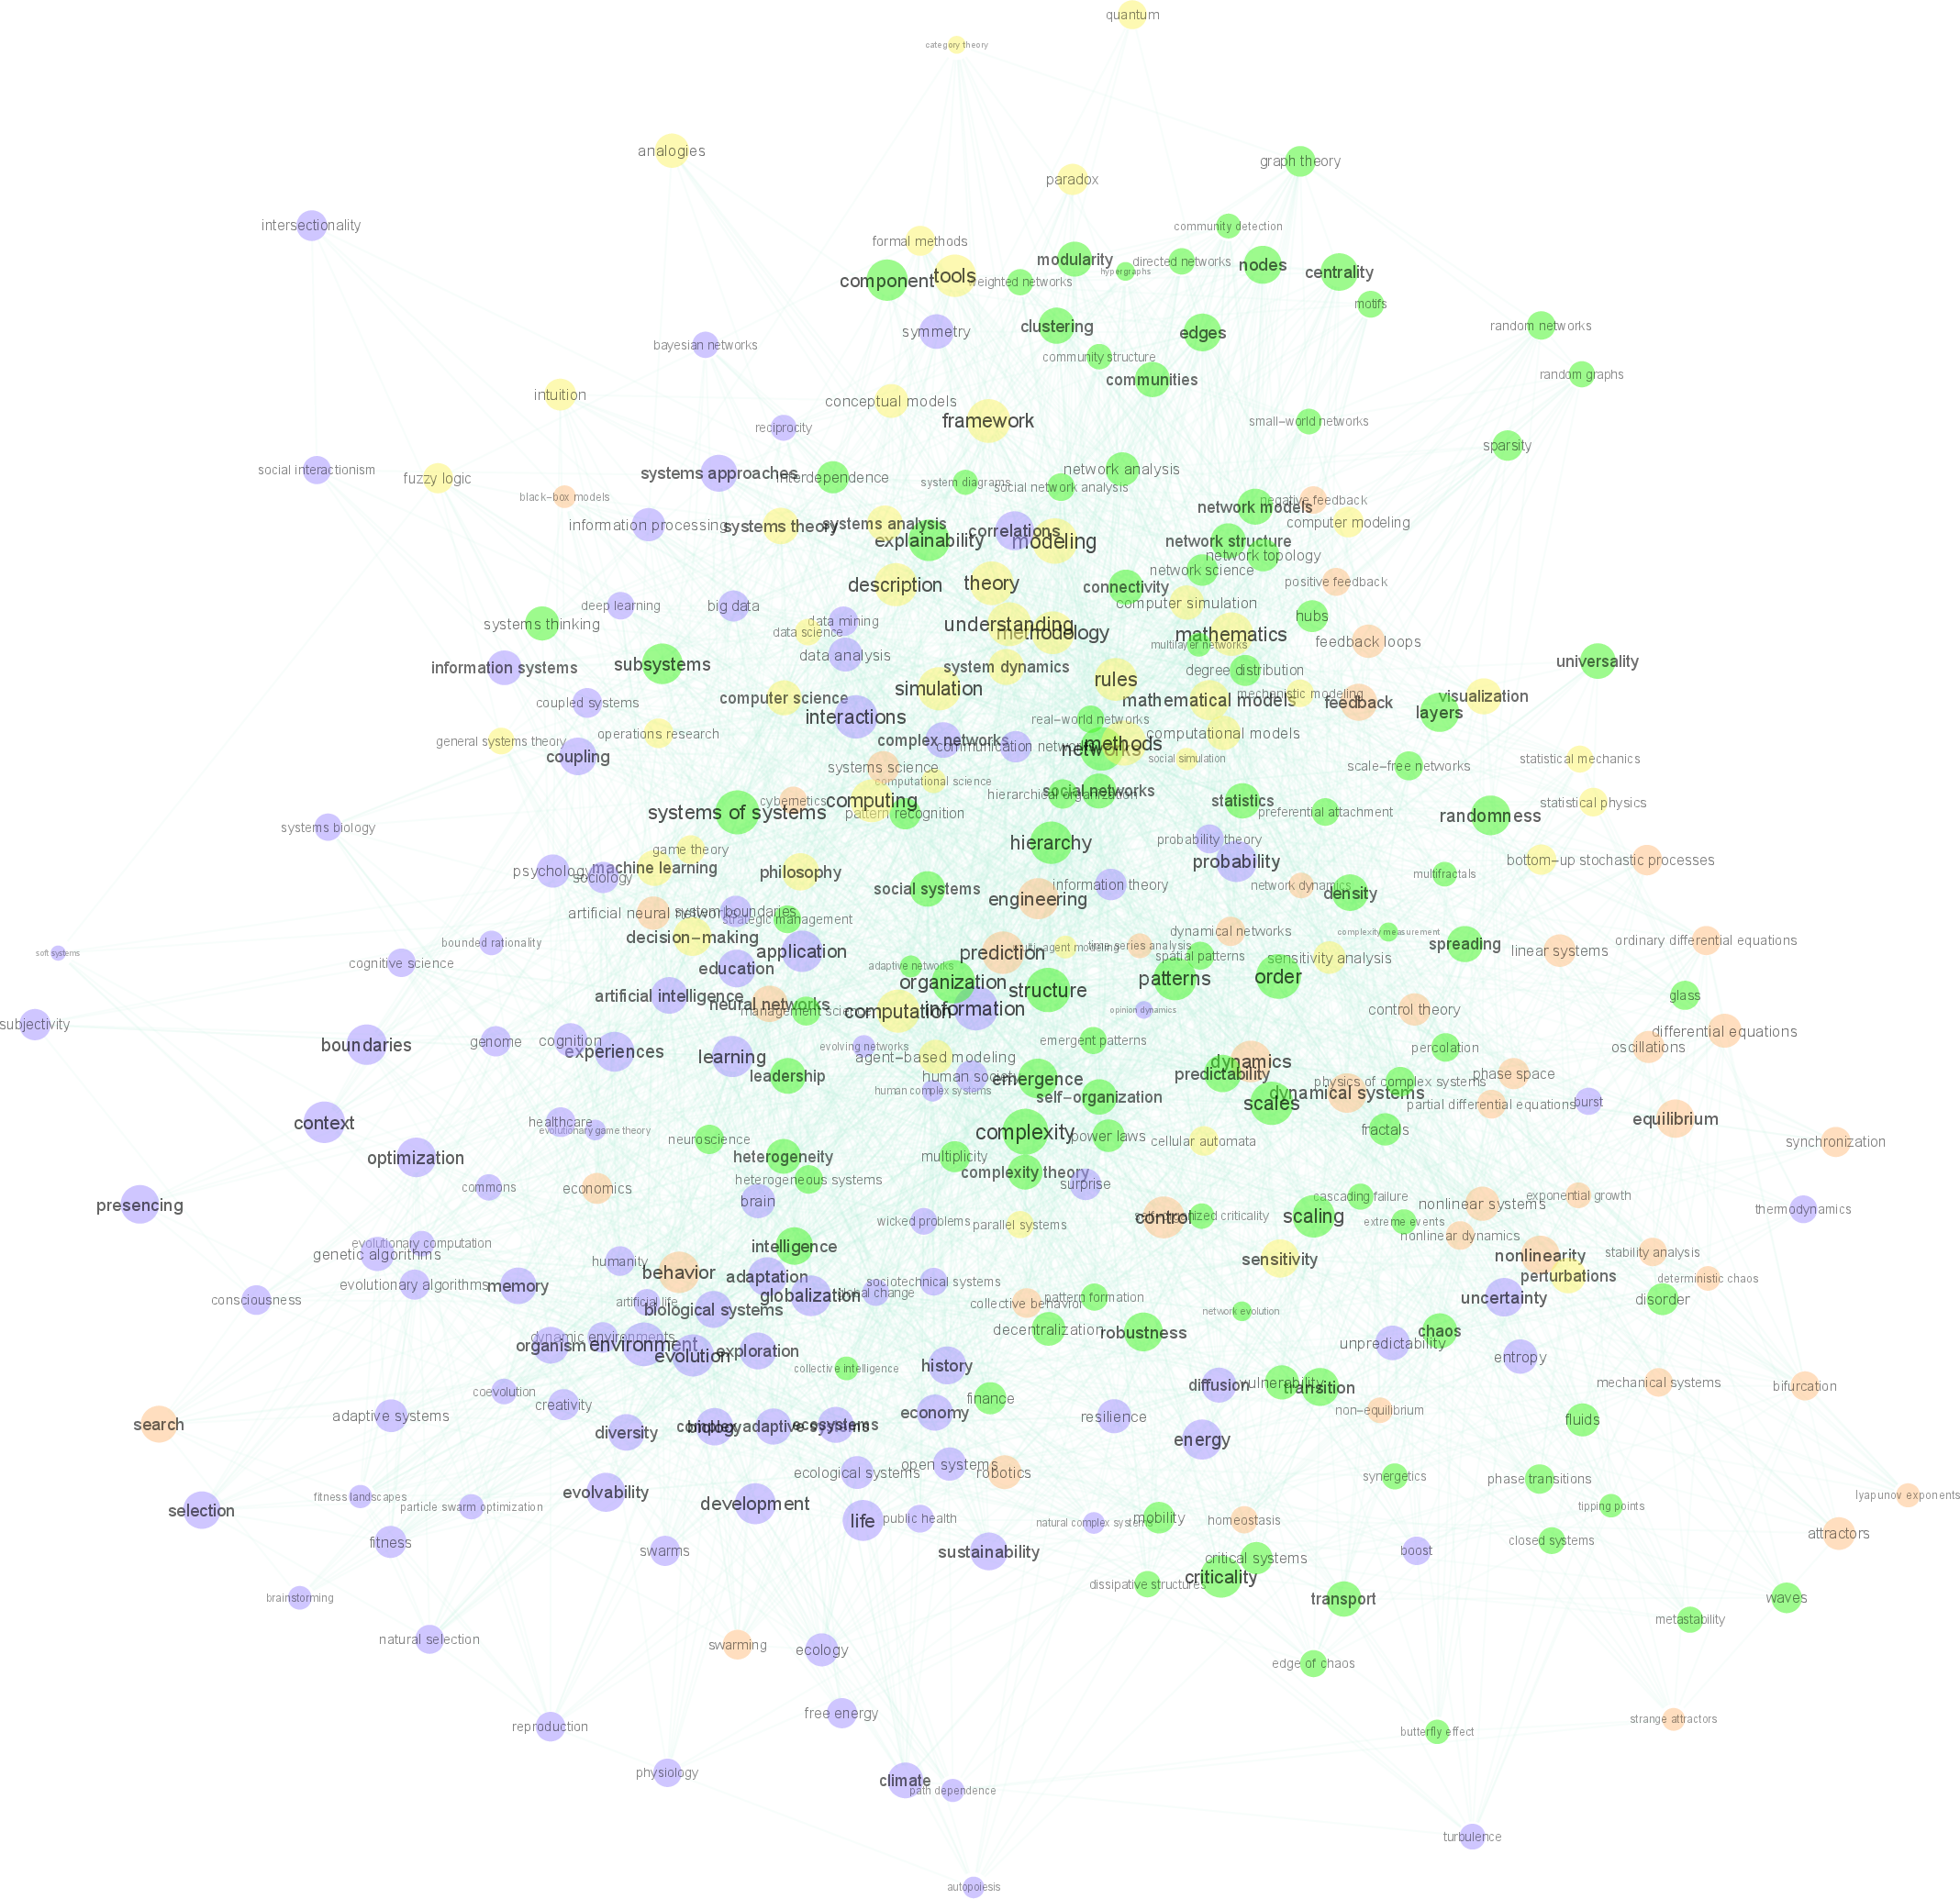
Figure 3: A detailed visualization of the keyword association network shows overlapping nodes among detected communities.
This interconnection reinforces the comprehensive role of central keywords in integrating diverse scientific topics. A thematic gradient emerges, connecting theoretical concepts to applied phenomena, and computational methods to dynamical analysis, suggesting axes for deeper exploration.
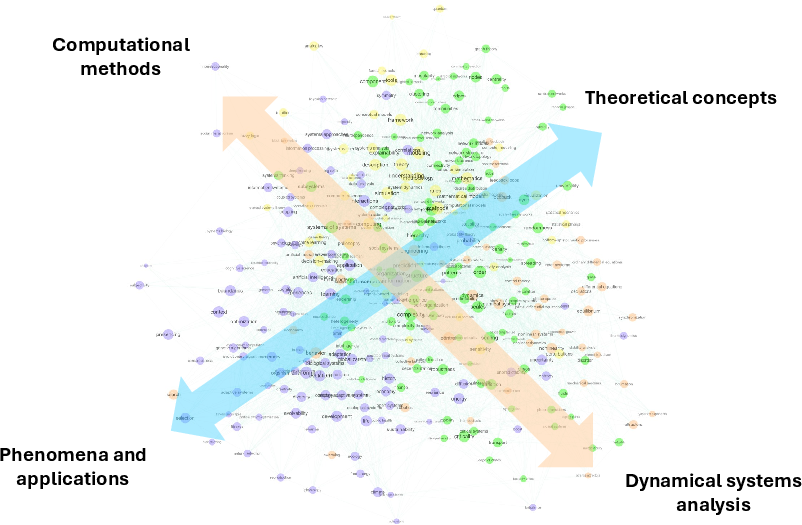
Figure 4: Large-scale gradients illustrate the broad thematic spectrum in the complex systems network.
Implications and Future Directions
The updated diagram offers a nuanced understanding of complex systems science, emphasizing the practical application and theoretical foundations while accommodating computational techniques. However, manual curation remains a limitation, highlighting the need for automated methods to derive scientific associations. Comparative analysis with other mapping endeavors may yield insights into interdisciplinary evolution. The introduction of interactive, dynamic interfaces could enhance explorative capabilities, transforming static visualizations into engaging educational resources.
Conclusions
This comprehensive revision of the complex systems keyword diagram integrates collective feedback and objective data to reflect current scientific discourse. It acknowledges previous diagram limitations and community-scientific perception divergence. The need for dynamic, interactive tools is emphasized, paving the way for enhanced pedagogical efficiency. Future efforts may explore automated association extraction and multi-project integration to track thematic evolution over time.
Readers are encouraged to explore the network visualization to appreciate the intricate tapestry of complex systems topics. The refined diagram aims to serve both educational and research functions, enhancing understanding and fostering future inquiry.## Acknowledgments
Acknowledgments reflect contributions from community members and authoritative sources, underpinning the paper's foundation. The Max Planck Institute's support facilitated project completion, ensuring global collaboration in complex systems science.