- The paper introduces the WHALES survey that targets Type Ia supernovae in the Shapley Supercluster to refine mass and bulk-flow models.
- Advanced techniques, including multi-band photometry and machine learning candidate selection, yield robust light curves and precise redshift measurements.
- Simulations indicate that a sample of 100 well-measured SNe Ia can achieve a 25% precision in estimating the total mass of the Shapley Supercluster.
The WHALES Survey: Targeted Supernova Discovery in the Shapley Supercluster
Introduction and Scientific Motivation
The WHALES (Weighing Halos Accurately, Locally, and Efficiently with Supernovae) survey represents a focused effort to discover and characterize Type Ia supernovae (SNe Ia) within and around the Shapley Supercluster, a region of significant mass concentration in the local universe. The survey is motivated by the need to constrain bulk-flow models and improve mass estimates of superclusters, which are critical for understanding the origin of the Milky Way's motion relative to the cosmic microwave background and for refining cosmological parameters such as H0 and the dark energy equation-of-state parameter wa. The Shapley Supercluster, spanning $0.02 < z < 0.06$, is a dominant structure whose gravitational influence is not fully accounted for in current peculiar velocity reconstructions due to limited redshift coverage in existing surveys.
Survey Design and Observational Strategy
WHALES utilizes the SkyMapper telescope at Siding Spring Observatory, leveraging its southern location and multi-band capabilities to overcome the challenges of high Milky Way extinction and limited survey footprints in the Shapley region. The survey design prioritizes coverage of the supercluster core and expands outward, employing a tiling strategy informed by galaxy density and instrument availability.
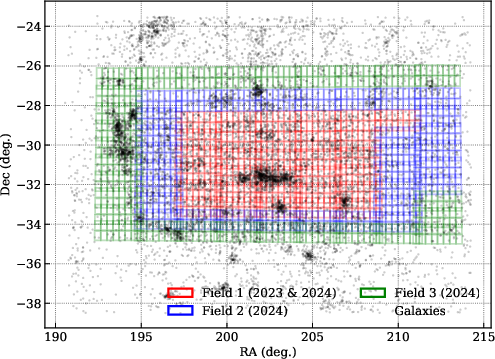
Figure 1: Visualization of the WHALES survey design, showing targeted fields overlaid on the Shapley supercluster galaxy distribution.
Observations are conducted with a 3–5 day cadence, aiming for comprehensive pre-peak and post-peak light-curve coverage. Template images are constructed from coadded exposures with optimal seeing, ensuring photometric depth sufficient for SNe Ia at z∼0.1. Spectroscopic classification is performed primarily with WiFeS on the ANU 2.3m telescope, and host galaxy redshifts are measured with high precision (σz∼10−4).
Data Reduction, Calibration, and SN Discovery Pipeline
Image processing is performed with the SkyMapper real-time pipeline, followed by custom post-processing using the Corral Framework. Zeropoint calibration employs PSF photometry and cross-matching with Pan-STARRS1, with systematic offsets quantified via synthetic photometry from NGSL. Magnitude offsets of −0.0064 (g), −0.0070 (r), and −0.0106 (i) are reported, facilitating cross-survey calibration.
SN discovery is achieved through astrometric alignment and difference imaging using HOTPANTS, with candidate selection based on S/N, magnitude, elongation, and multi-epoch/multi-filter detection criteria. A machine learning model further refines candidate selection. Forced PSF photometry is performed for all associations, yielding robust light curves.
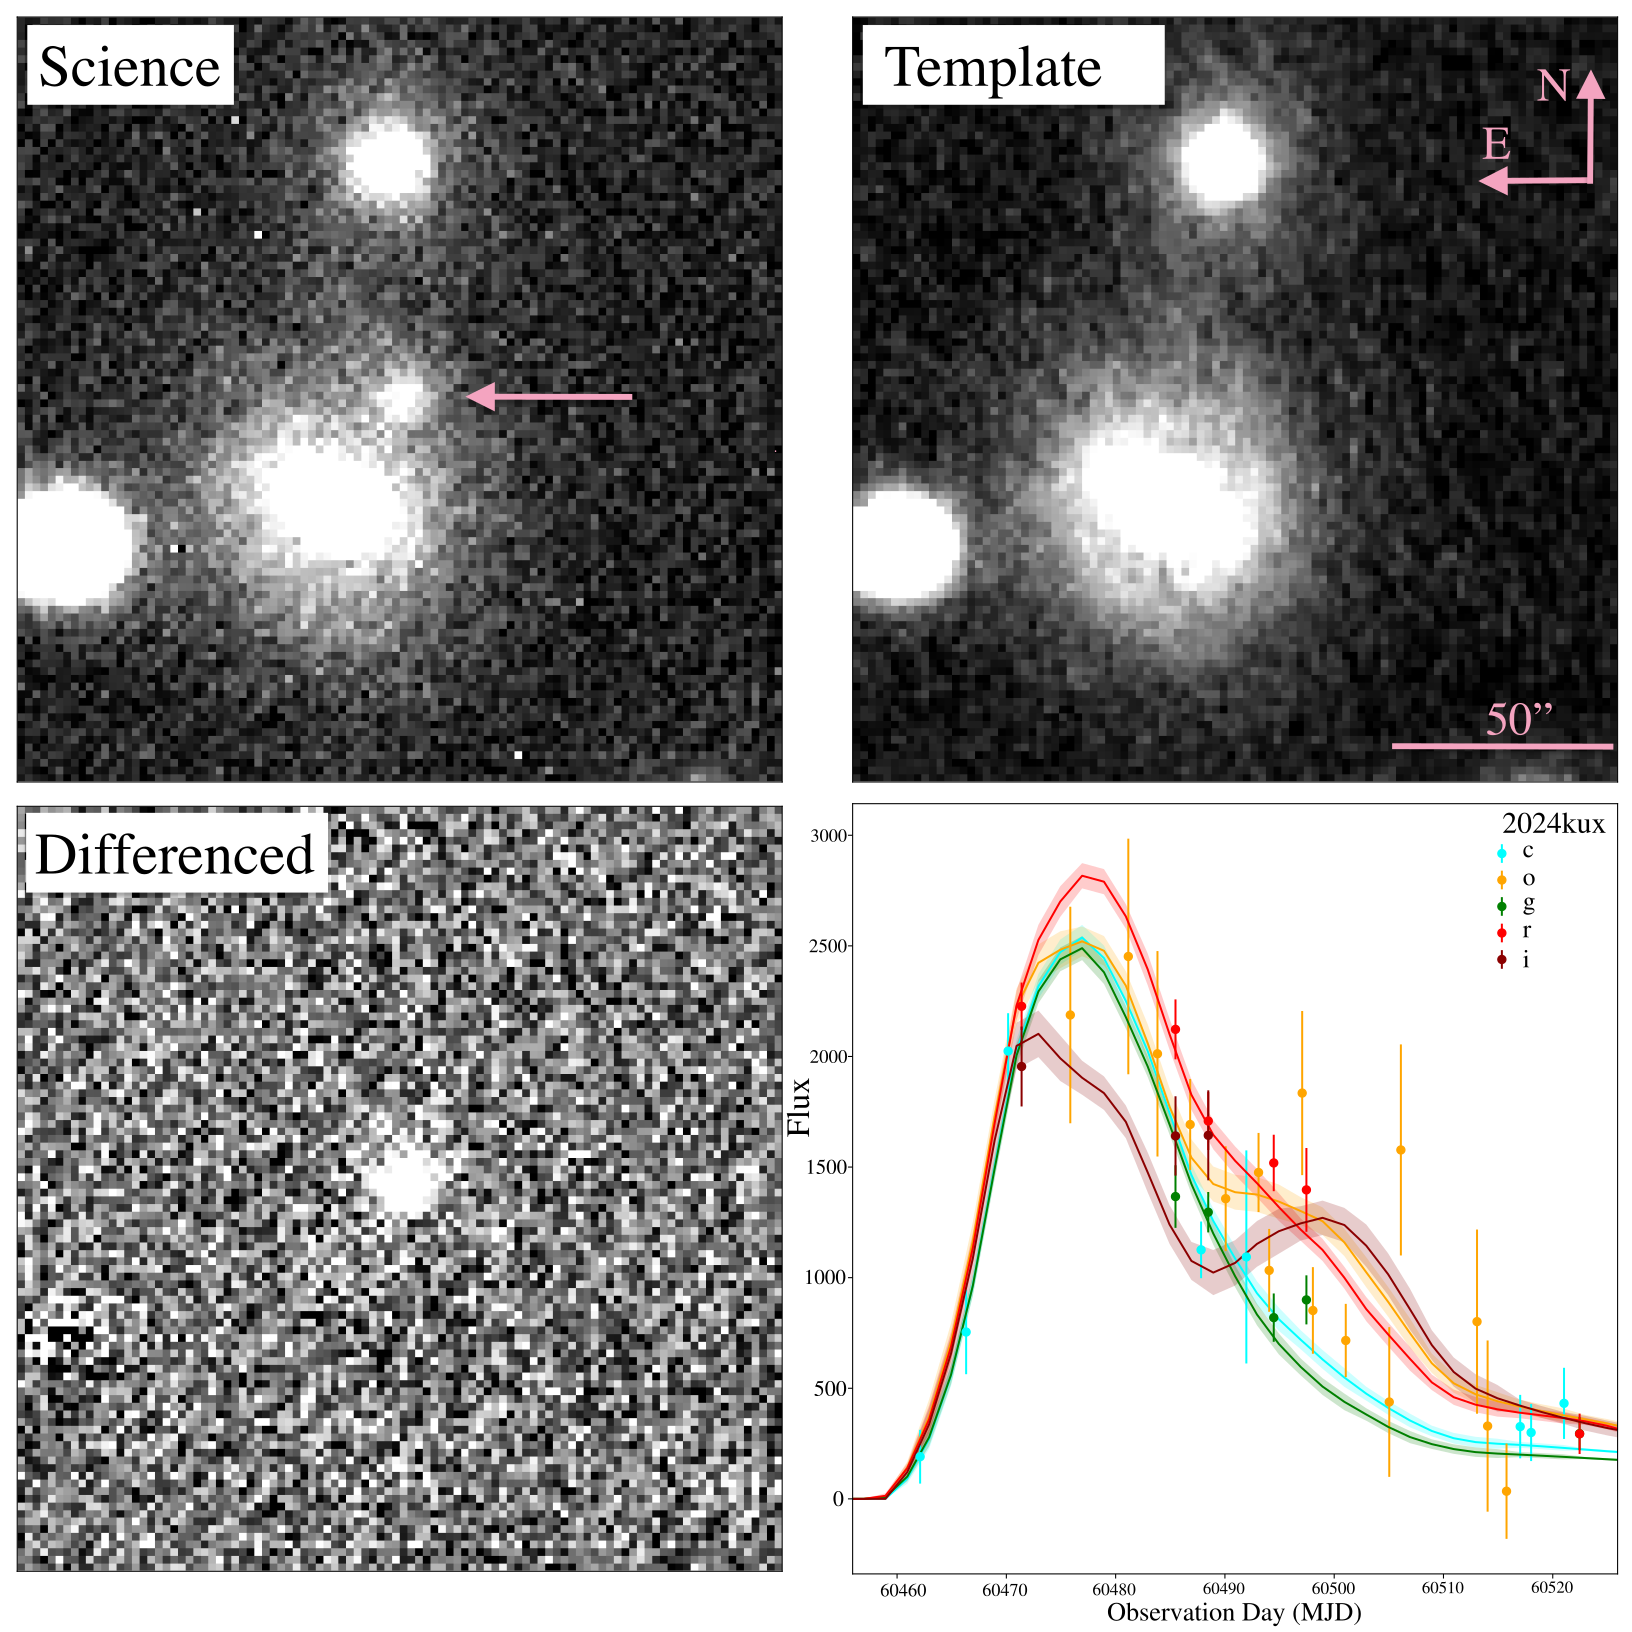
Figure 2: Example images and light-curve extraction for SN 2024kux, illustrating science, template, difference, and SALT3 fit panels.
Photometric repeatability is assessed, with a floor of 0.015 mag established from the robust median absolute standard deviation of stellar measurements.
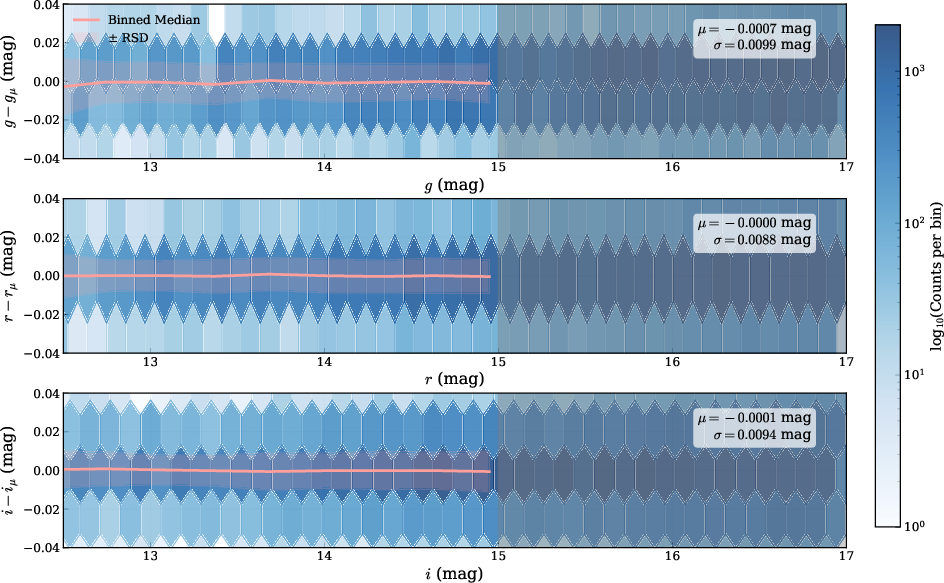
Figure 3: Distribution of measured stellar magnitudes, demonstrating photometric repeatability and error floor.
Light Curve Fitting and Hubble Diagram Construction
Light curves are fit with SNANA using the SALT3 model, extracting stretch (x1), color (c), and amplitude (x0) parameters. Quality cuts are applied (∣x1∣<3, σx1<1, ∣c∣<0.3, σtpeak<2 days), resulting in 8 high-quality SNe Ia from 12 candidates. Distance moduli are computed via the Tripp equation with fixed α and β.
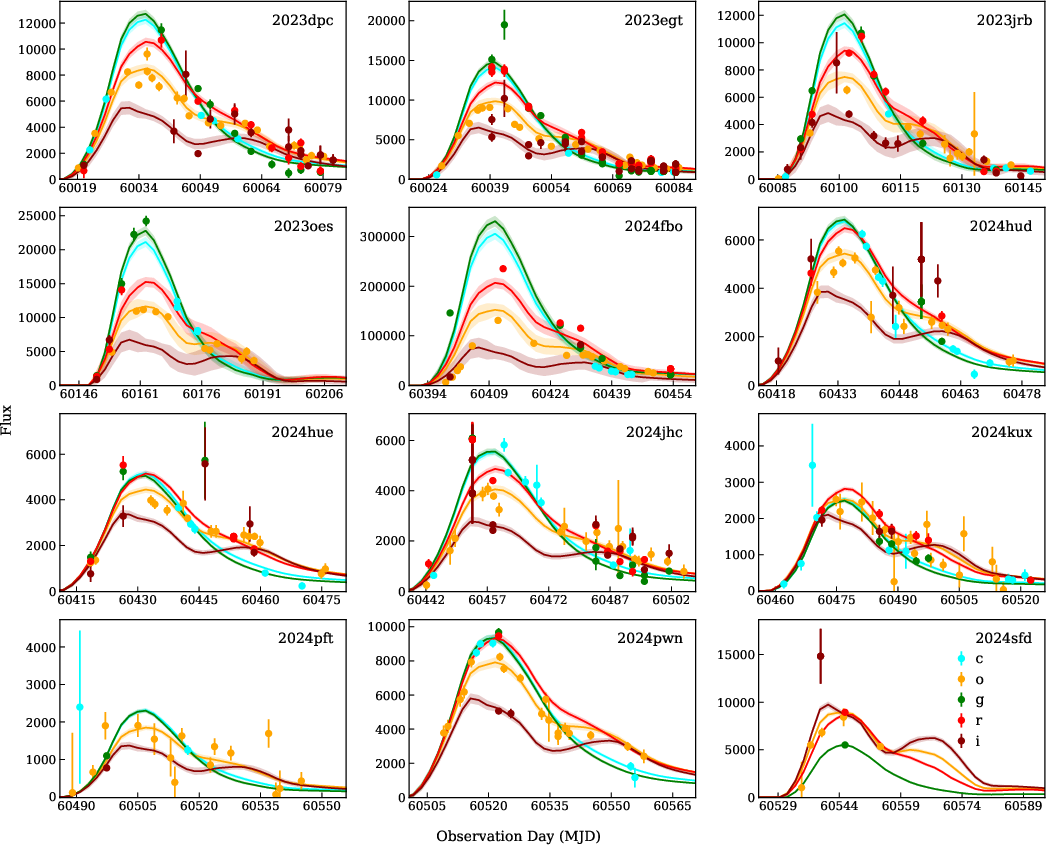
Figure 4: SALT3 light curves for the combined WHALES and ATLAS SNe Ia sample.
The Hubble diagram and residuals are presented, with the Shapley redshift range highlighted.
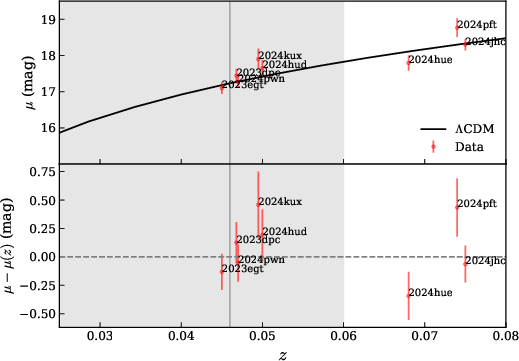
Figure 5: Hubble diagram and residuals for WHALES SNe Ia, with the Shapley Supercluster redshift range shaded.
Simulations and Mass Constraints
Simulations using the Uchuu cosmological simulation and a modified friends-of-friends algorithm model the impact of Shapley-like superclusters on the distance-redshift relation. The simulations reveal pronounced Fingers-of-God effects and subcluster structure, complicating mass reconstruction.
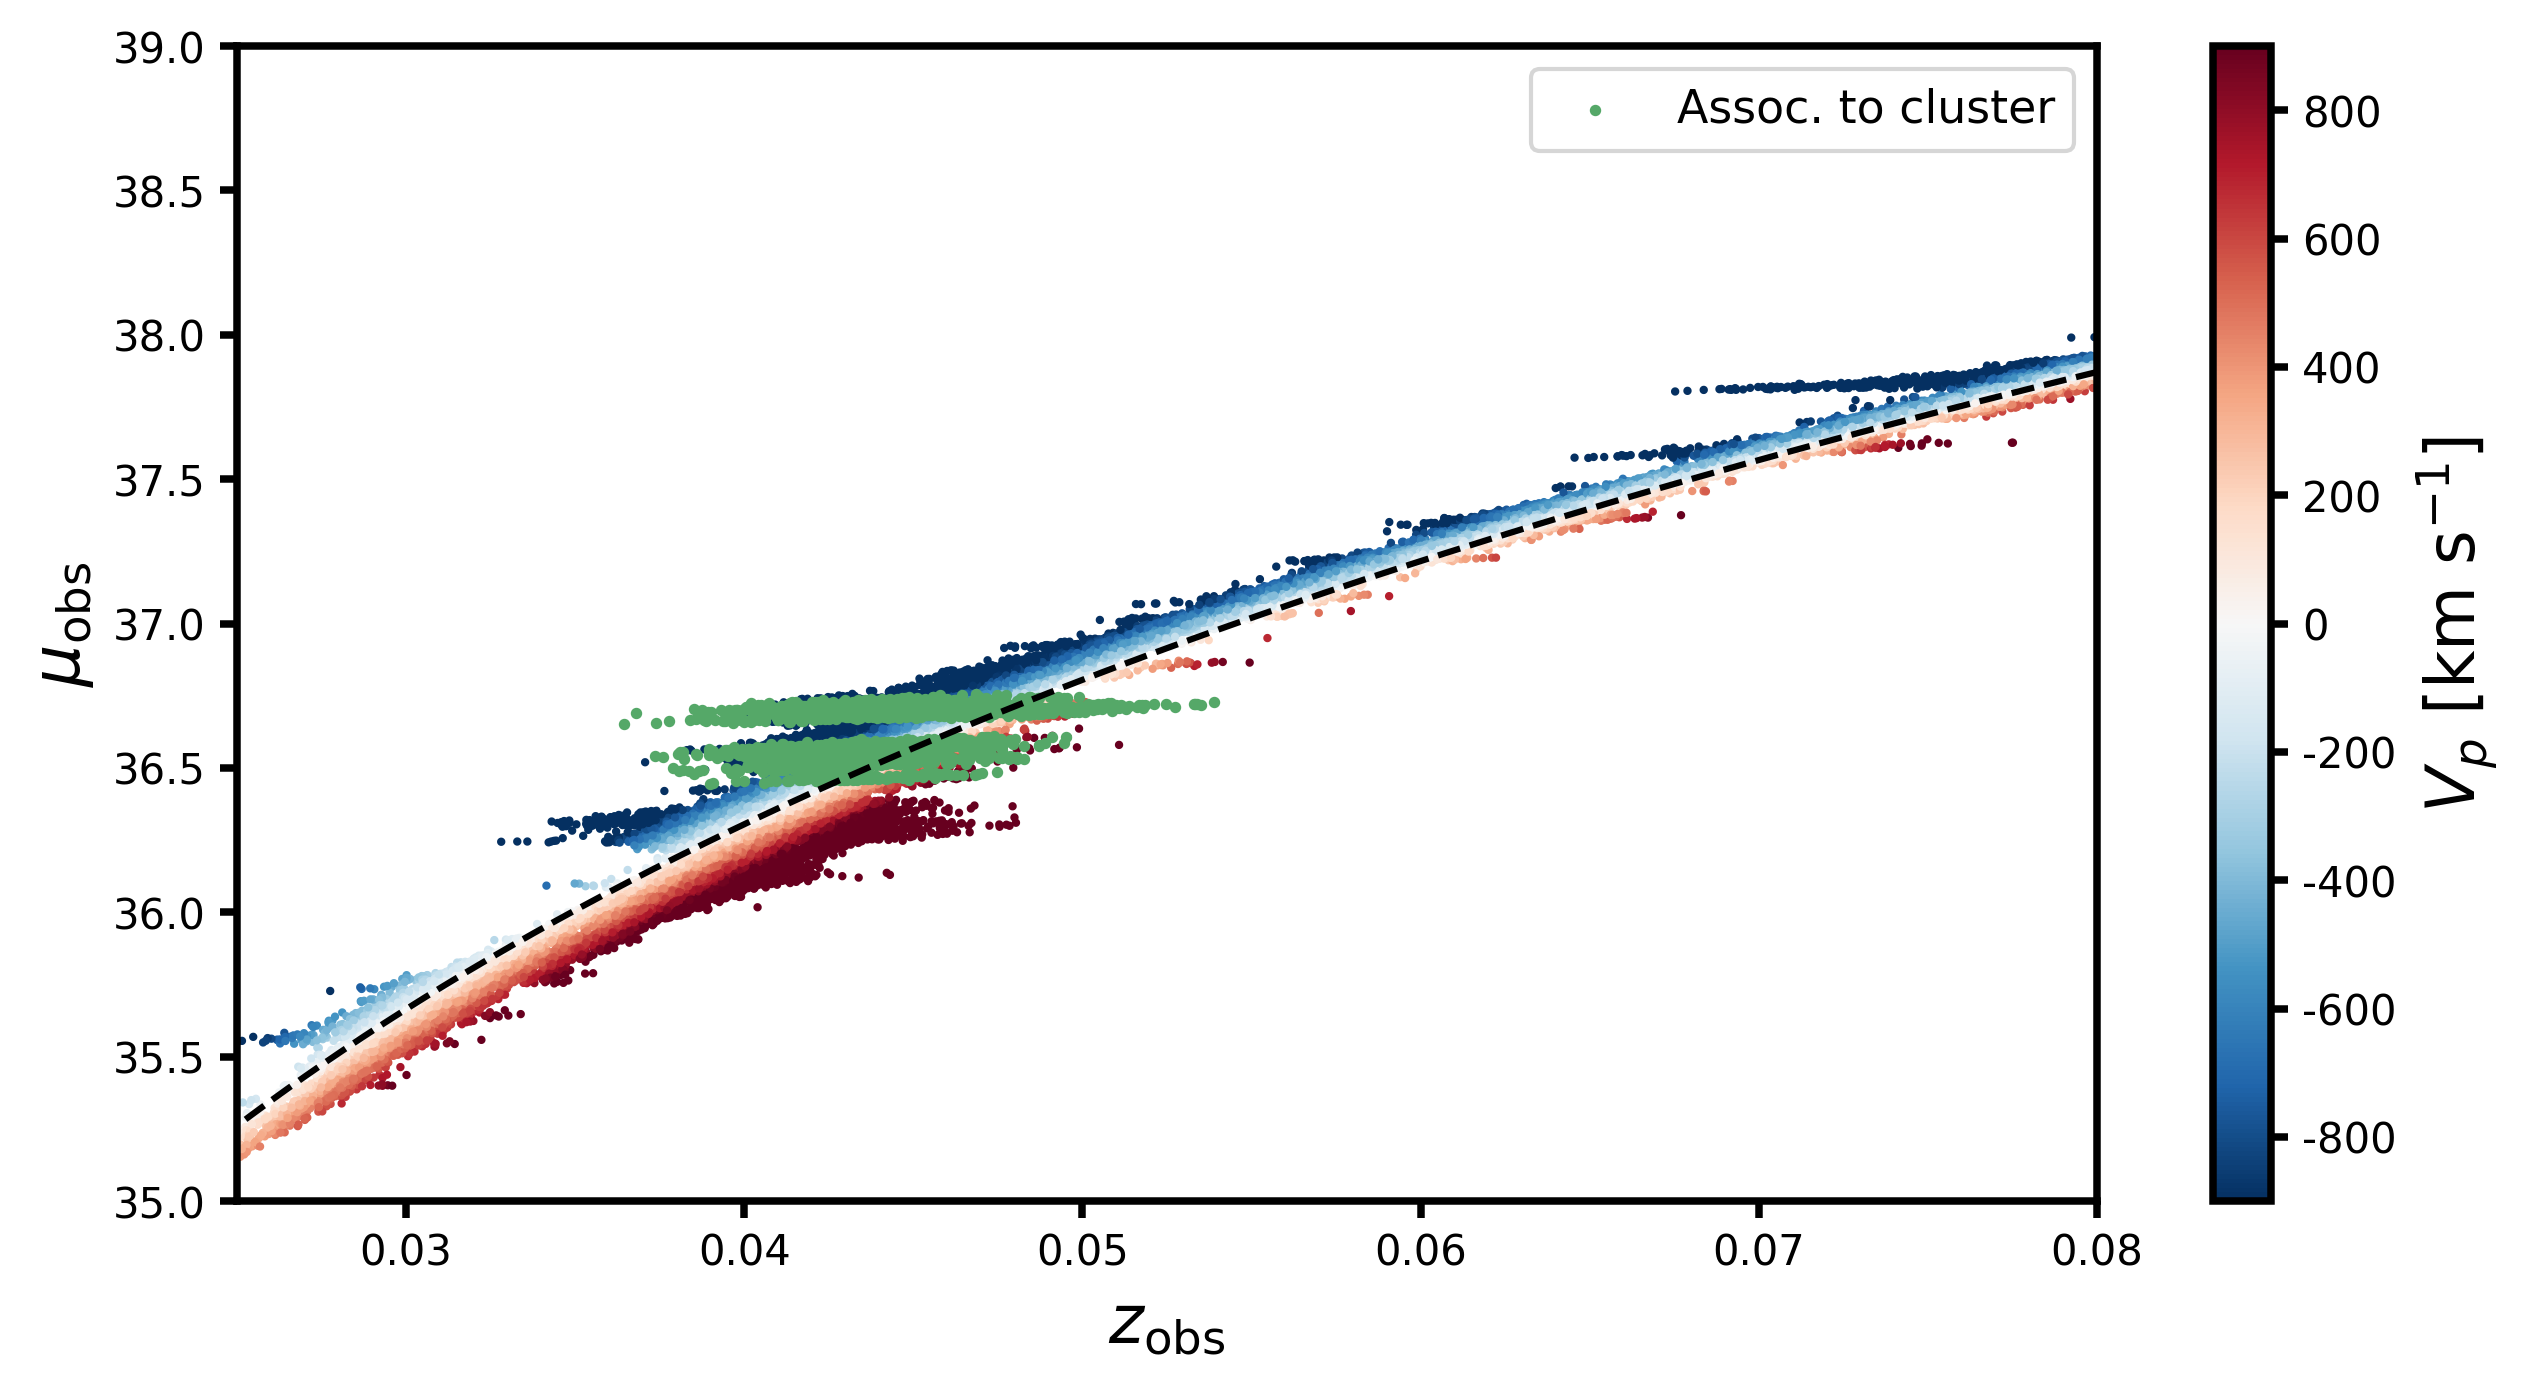
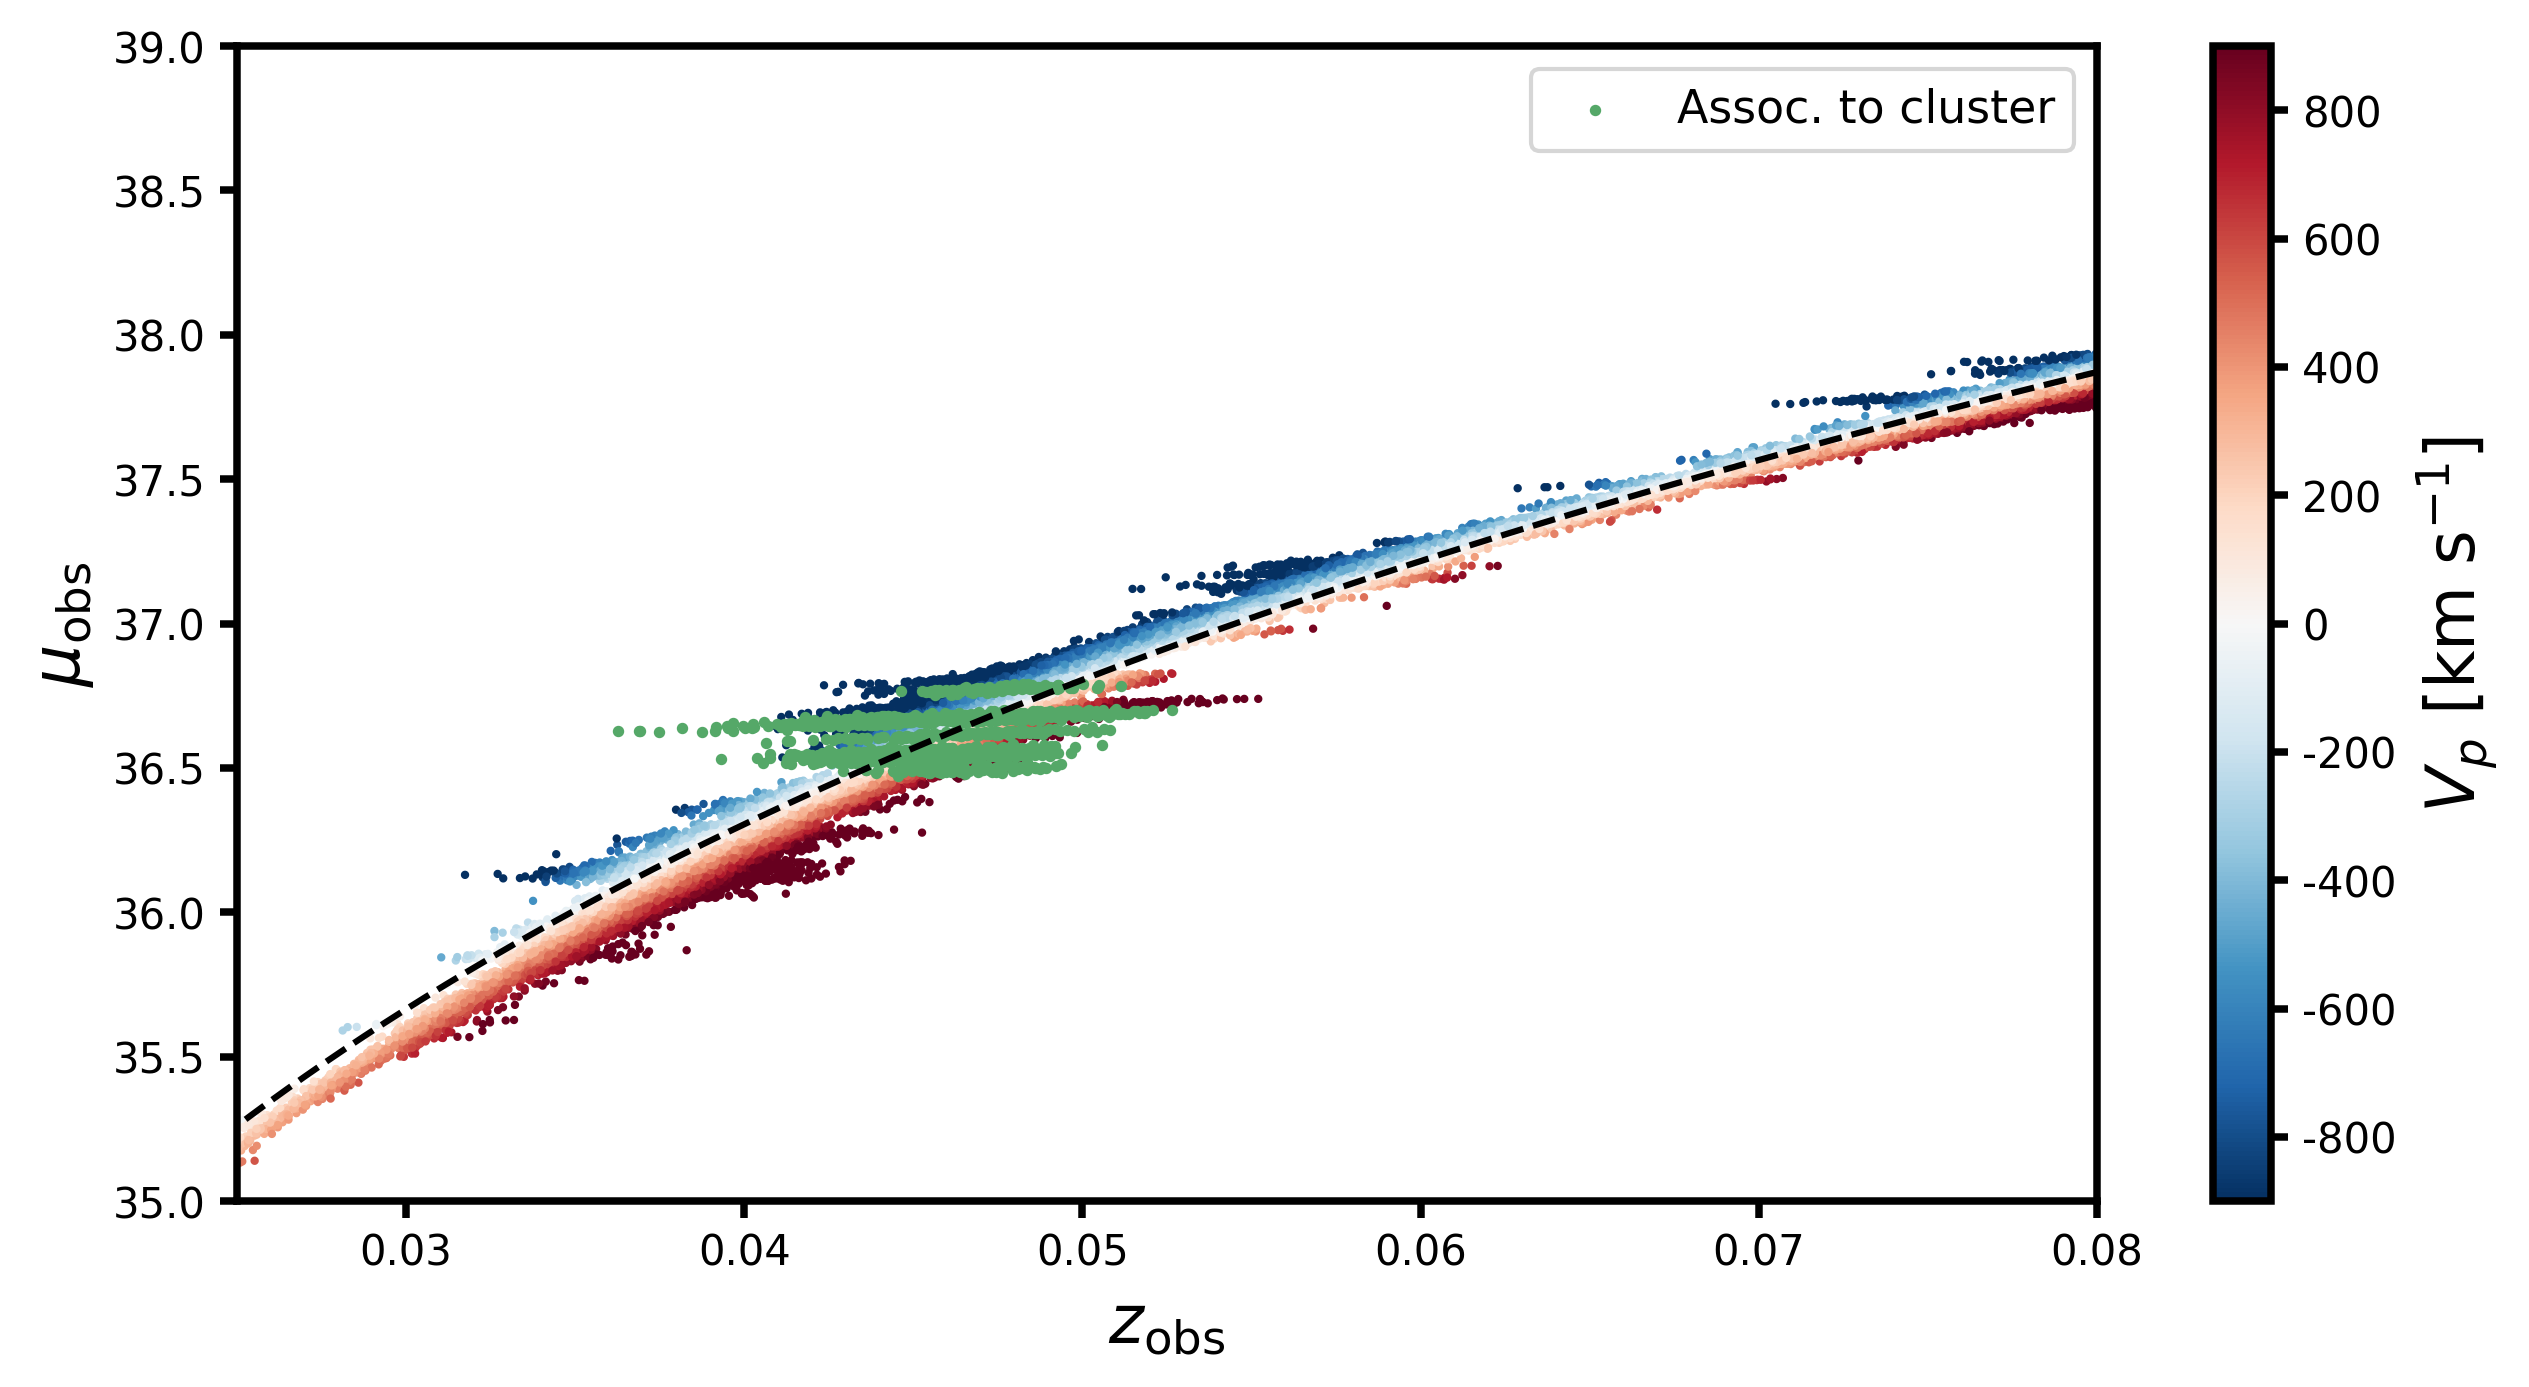
Figure 6: Simulated Hubble diagrams for SNe Ia in Shapley-like superclusters, color-coded by peculiar velocity.
A Fisher forecast, following the formalism of Benisty et al., demonstrates that a sample of 100 well-measured SNe Ia enables a 25% precision measurement of the total Shapley mass, provided SNe are located beyond 10 Mpc/h from the cluster center to avoid virialized regions.
Supernova Rates and Survey Completeness
The observed SN Ia rate in Shapley is consistent with both volumetric and mass-based estimates (∼10 SNe Ia per season), supporting the survey's completeness. The volumetric rate is derived from PTF measurements, while the mass-based rate uses the specific SN Ia rate per stellar mass. The convergence of these estimates reflects large-scale homogeneity and the statistical compensation of overdensities and underdensities.
Implications and Future Directions
The WHALES survey establishes the feasibility of targeted SN Ia discovery in superclusters, providing a foundation for improved mass estimates and bulk-flow constraints. The results highlight the necessity of accounting for subcluster structure and internal dynamics in mass reconstruction. The demonstrated photometric precision and cross-survey calibration enable integration with future wide-field surveys such as LSST.
Theoretical implications include the refinement of peculiar velocity models and the reduction of systematic uncertainties in cosmological parameter estimation. Practically, the survey methodology and pipeline design are extensible to other massive structures and can inform the design of next-generation transient surveys.
Conclusion
The WHALES survey delivers the first dedicated SN Ia sample in the Shapley Supercluster, with robust data reduction, calibration, and light-curve analysis. Simulations underscore the complexity of supercluster mass estimation and the critical role of SNe Ia as precision distance indicators. The survey's results and methodology provide a template for future efforts to constrain the mass and dynamics of large-scale structures, with direct relevance to cosmological analyses and the interpretation of bulk flows. Continued monitoring and expansion of the SN Ia sample, particularly with LSST, will be essential for achieving the precision required to disentangle subcluster contributions and refine cosmological models.