- The paper introduces an automated gradient-based algorithm that isolates and classifies the topside electron density bulge in Venus’s ionosphere.
- It reveals that prominent Type 1 bulges occur predominantly at low latitudes and small solar zenith angles, with a prevalence greater than 80% in the analyzed profiles.
- The study demonstrates strong solar wind influences on bulge morphology, challenging traditional photochemical-diffusive models and informing future mission strategies.
Identification and Characterization of the Topside Bulge of the Venusian Ionosphere
Introduction and Context
Venus’s dayside ionosphere consistently exhibits a persistent feature—a localized enhancement or “bulge” in electron density at 160–200 km altitude, positioned above the primary V2 layer. Earlier missions (Mariner, Venera, Pioneer Venus Orbiter) qualitatively reported this bulge, but systematic, quantitative classification was lacking. "Identification and Characterization of the Topside Bulge of the Venusian Ionosphere" (2512.10464) delivers a novel, rigorous analysis by leveraging >200 carefully selected electron density profiles derived from the VeRa radio occultation experiment onboard Venus Express (VEX). The study introduces an automated, gradient-based algorithm for identifying and morphologically classifying the bulge, assessing its planetary geographic, solar activity, and solar zenith angle dependencies.
Data Selection, Methodological Advances, and Morphology Identification
The study selects 234 dayside electron density profiles based on robust coverage, SZA ≤ 85°, and vertical extension above 350 km to ensure both subsolar and higher-latitude conditions are appropriately constrained. Preference is given to dual-frequency (differential Doppler) observations to optimize inversion quality and minimize systematic errors. The spatial distribution of the dataset reflects the VEX orbit, mainly sampling equatorial and southern latitudes.
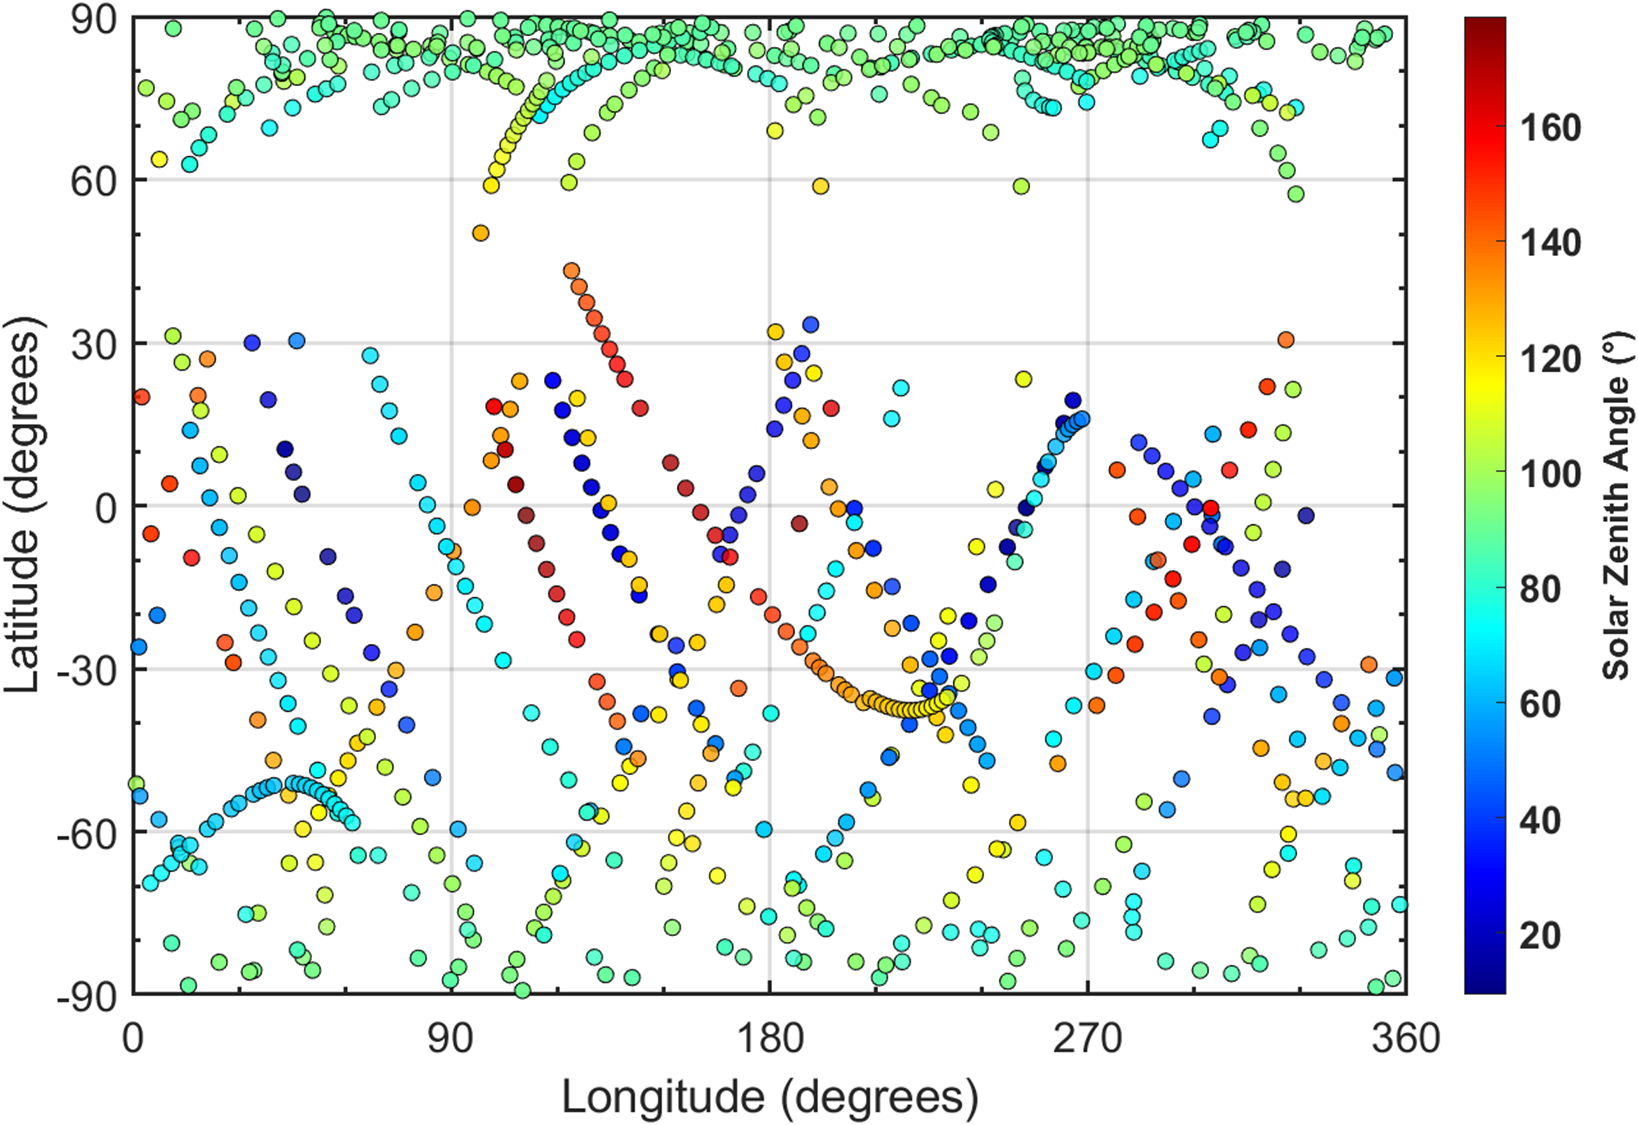
Figure 1: Latitude–longitude map showing the distribution of VeRa profiles, with a clear observational gap from 40∘ to 60∘ latitude due to orbital constraints.
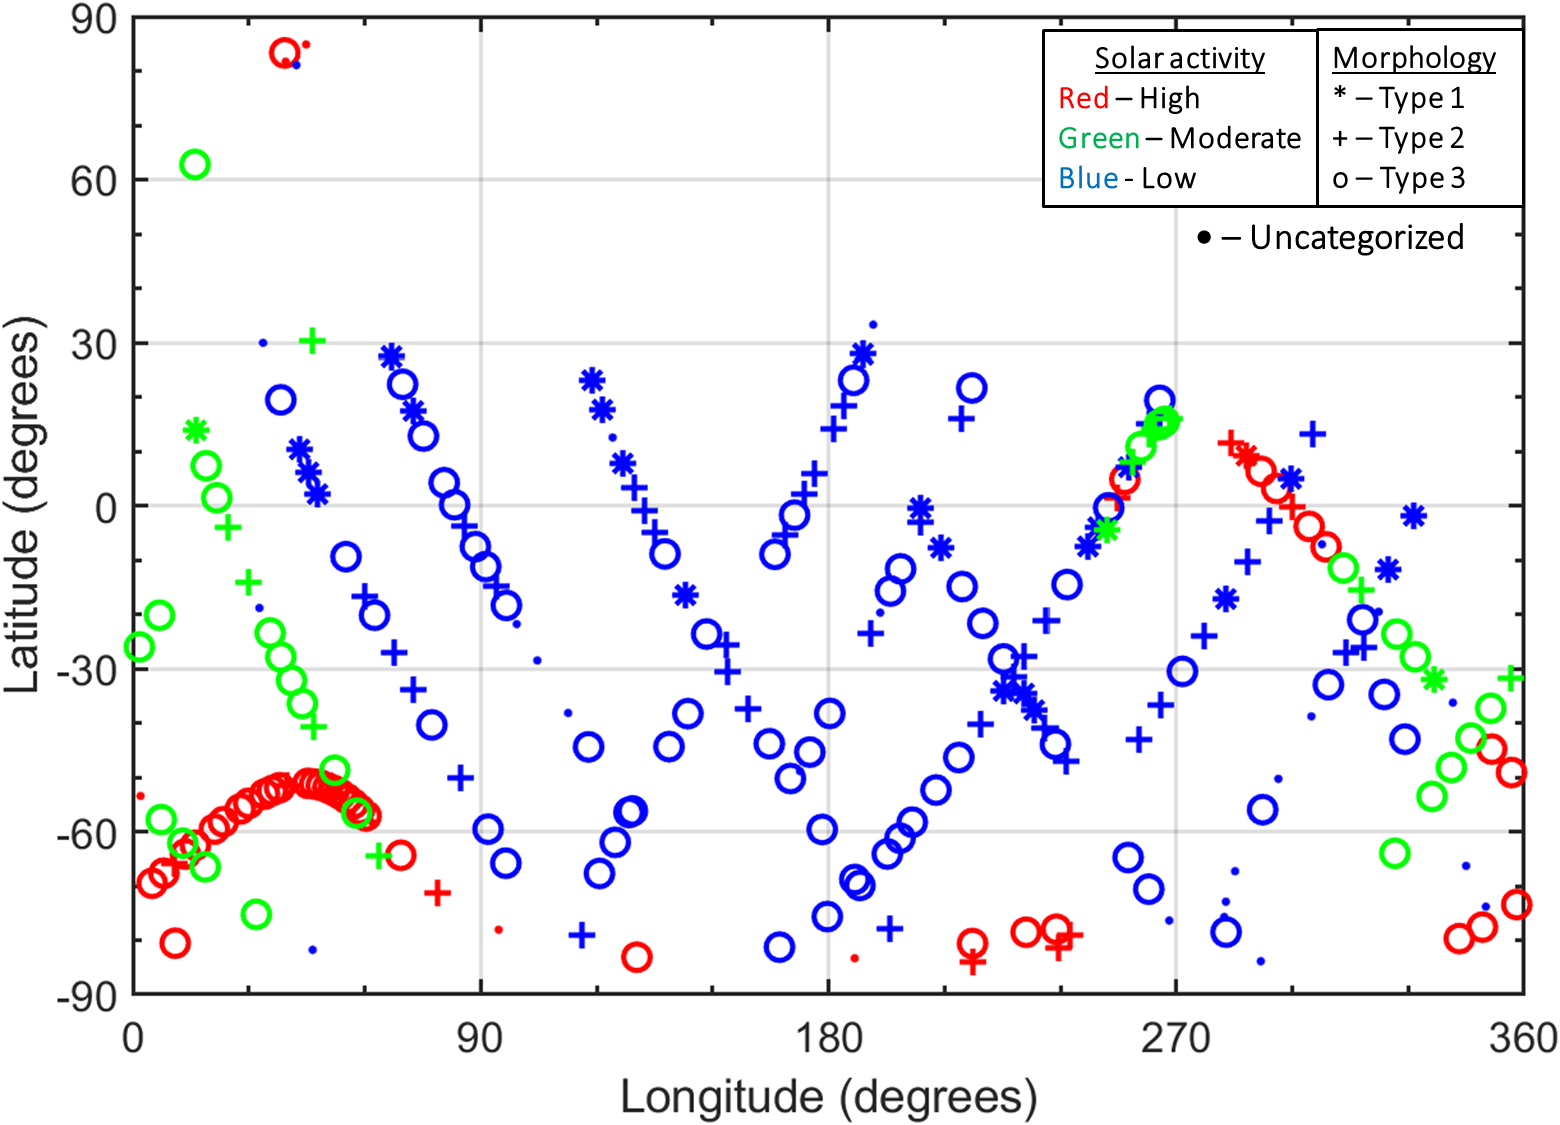
Figure 2: Distribution of the subset of 234 analyzed profiles used in this study, coded by solar activity and bulge morphology.
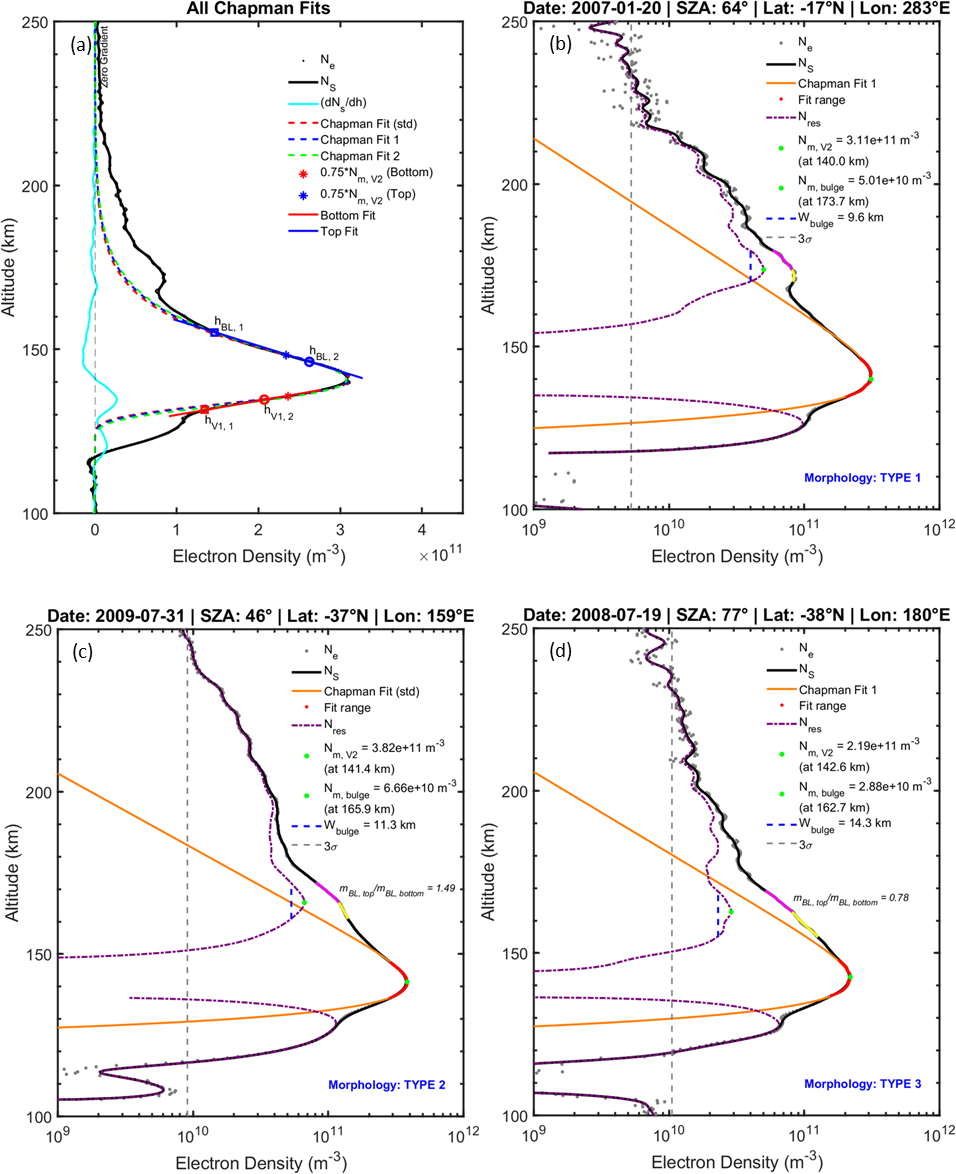
Bulge identification proceeds by sequentially smoothing the electron density profile to suppress retrieval noise, then subtracting a Chapman-function fit to the main V2 peak—this removes the canonical photochemical-diffusive background and isolates the residual signal above the Chapman-predicted electron density. The authors' algorithm unambiguously categorizes residuals as three distinct morphologies:
The automation and gradient-based classification provide a reproducible, quantitative framework for distinguishing between subtle and prominent bulge structures—an advance over previous visual/by-eye methods.
Statistical Characteristics, Solar Cycle, and Geospatial Trends
Bulges are present in >80% of the analyzed profiles—a higher prevalence and geospatial extent than previously suggested. The occurrence rate and morphology exhibit strong dependencies:
- Latitude: Type 1 bulges (clear secondary peaks) are tightly confined to low latitudes (|lat| < 40°). At higher latitudes, only Type 2 and 3 morphologies are observed.
- Solar Zenith Angle: Type 1 bulges are frequent at small SZA but vanish above SZA ~80°. The transition from Type 1 to weaker morphologies is accompanied by increasing SZA.
- Solar Activity: The overall bulge presence is highest during low solar activity and at small SZA; only a small minority of Type 1 bulges are found during high activity periods.
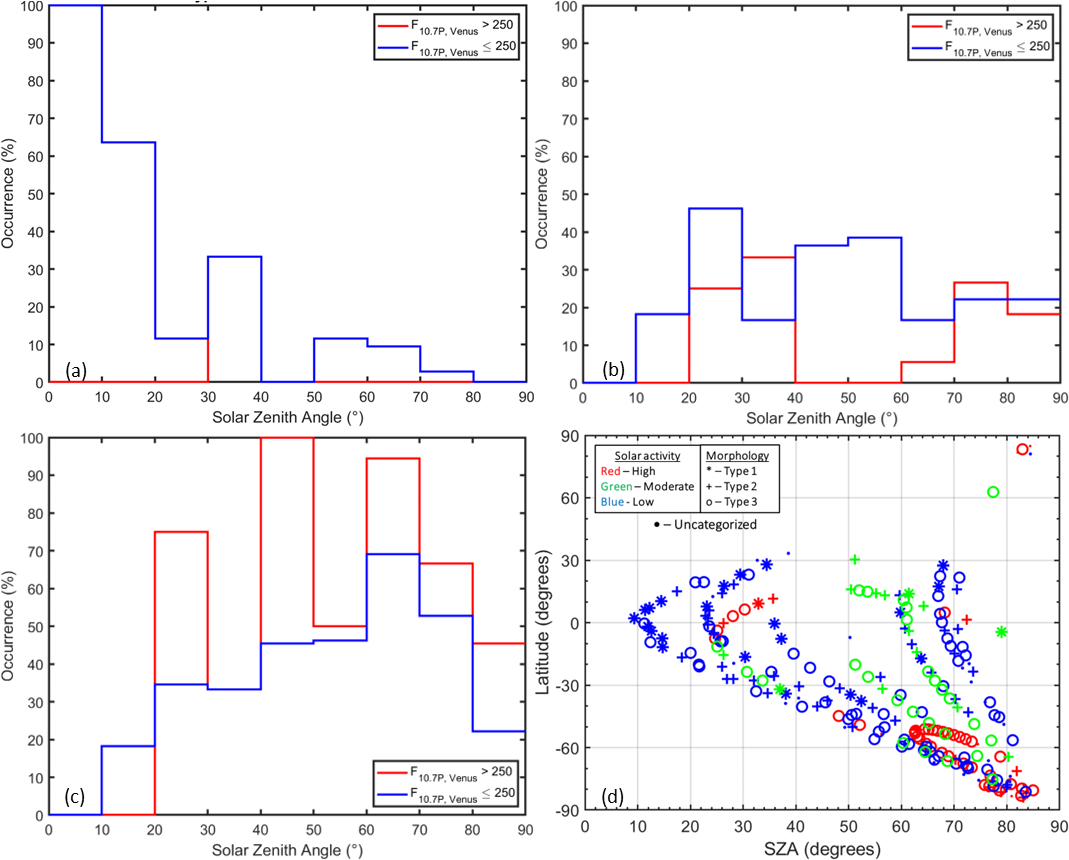
Figure 4: SZA dependence of bulge occurrence rates for Type 1, 2, and 3 morphologies—Type 1 occurrence falls sharply with increasing SZA, while Type 2 and Type 3 also decline, but less steeply.
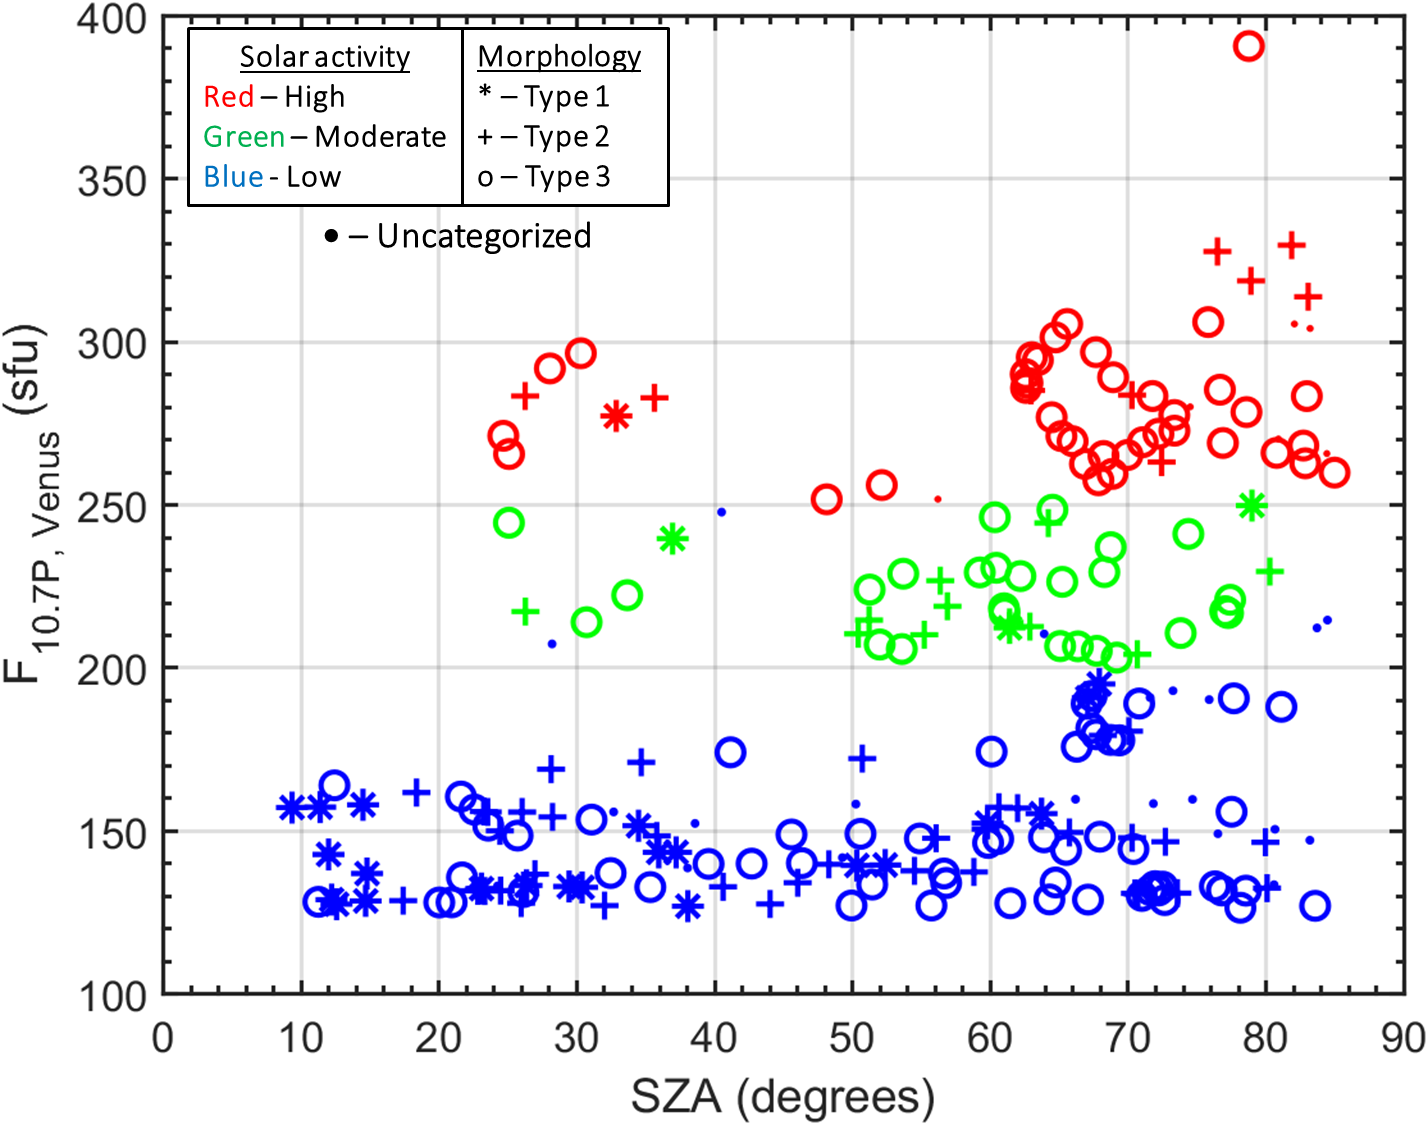
Figure 5: Distributions of bulge observations as a function of solar activity and SZA.
This latitudinal and SZA confinement of the most prominent bulge manifestations, and the absence of Type 1 bulges at high latitudes and high SZA, constitute a robust empirical result.
Altitude and Density Variability of the Bulge
Analysis of the bulge altitude (hm,BL) and peak density (Nm,BL) yields several non-trivial results:
- Bulge altitude decreases with SZA, in contrast to the main V2 and V1 layers, whose peak altitudes are nearly invariant at SZA < 80°. This altitude sensitivity is attributed to the pronounced SZA-driven collapse of the thermospheric neutral background at higher altitudes/late local times, which is more significant for the bulge than for photoionization-controlled layers.
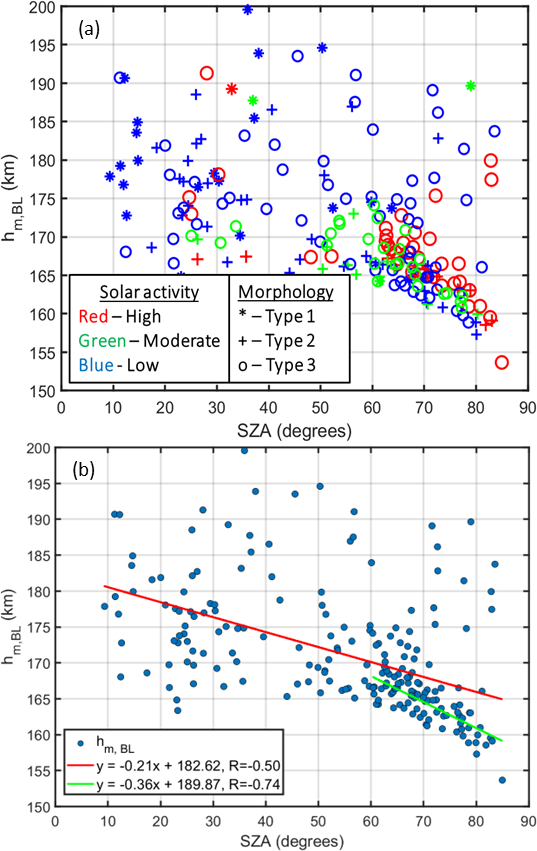
Figure 6: SZA dependence of bulge peak altitude, showing a strong negative correlation, especially at SZA > 60°, hm,BL decreases sharply.
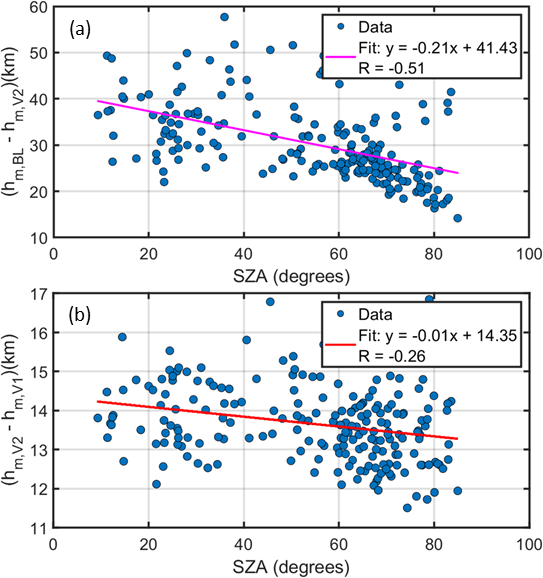
Figure 7: The difference in altitude between the bulge and V2 layers shrinks with SZA, supporting the conclusion that the bulge altitudinal location is SZA-sensitive while V2 is not.
- Peak density (Nm,BL) exhibits only a weak correlation with SZA, in stark contrast to the Chapman-law-like decrease of Nm,V2 and Nm,V1 with SZA. Instead, Nm,BL is more sensitive to solar activity, increasing at high solar fluxes.
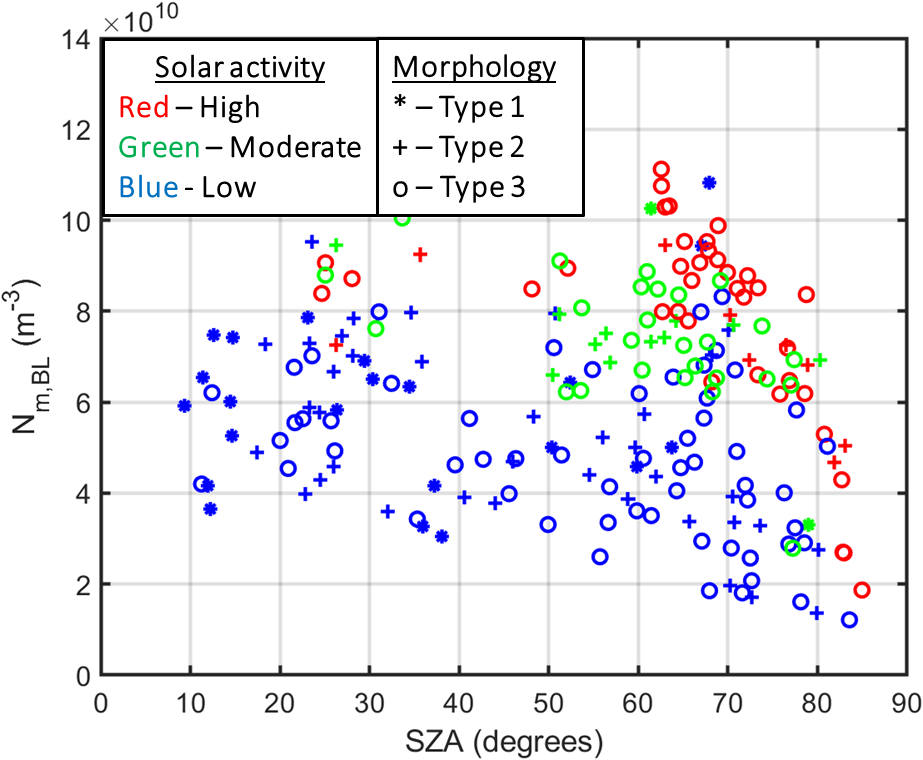
Figure 8: Bulge peak density as a function of SZA and solar activity—density increases at high solar activity but is nearly independent of SZA.
- The ratio Nm,BL/Nm,V2 increases with both SZA and solar activity, while Nm,V1/Nm,V2 is nearly SZA-invariant, signifying that bulge-related processes are fundamentally different from those dominating the lower ionospheric layers.
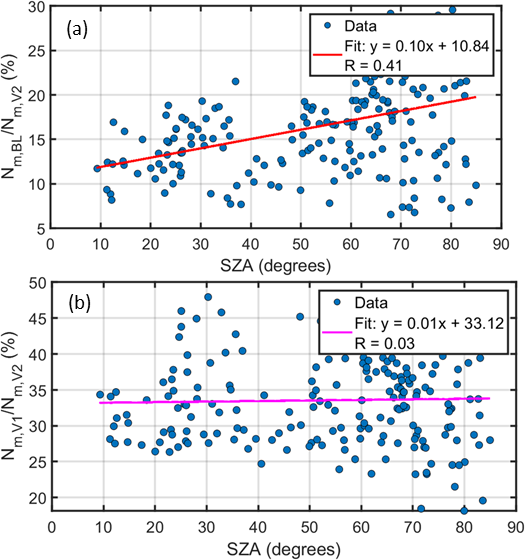
Figure 9: Nm,BL/Nm,V2 rises with SZA as Nm,V2 drops, while Nm,V1/Nm,V2 remains constant.
- No clear altitude trend with solar activity is discerned for hm,BL.
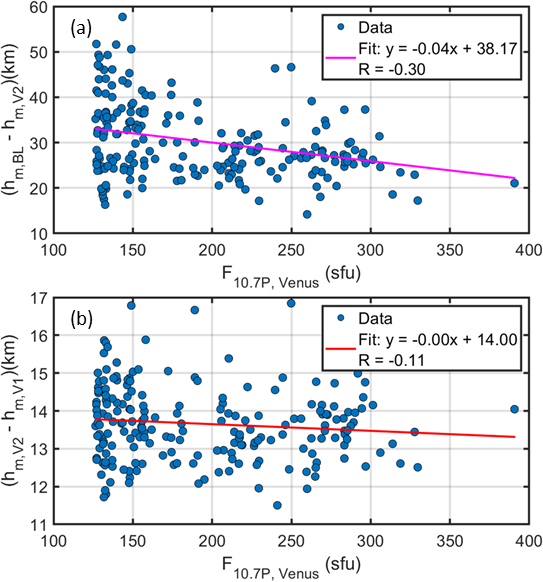
Figure 10: Difference in peak altitudes of bulge and V2/V1 layers as a function of solar activity index F10.7P,Venus (no strong trend).
- Nm,BL/Nm,V2 increases with solar activity, likely related to thermospheric expansion and increased topside O/O2 ratio at high EUV flux.
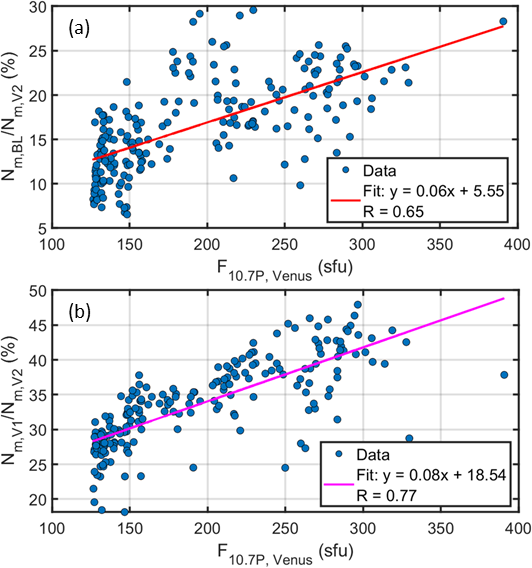
Figure 11: Ratios of Nm,BL/Nm,V2 and Nm,V1/Nm,V2 versus solar activity: a positive trend for the bulge but not the lower layer.
Solar Wind Effects
In the absence of an intrinsic planetary magnetic field, the solar wind directly interacts with the Venusian topside ionosphere. Profiles exhibiting Type 1 bulges or disrupted topside structure coincide with enhanced solar wind dynamic pressure. At identical solar activity/SZA, a high-pressure interval may yield a Type 1 bulge or pronounced disturbance, whereas comparable conditions with subdued dynamic pressure may lack a clear bulge.
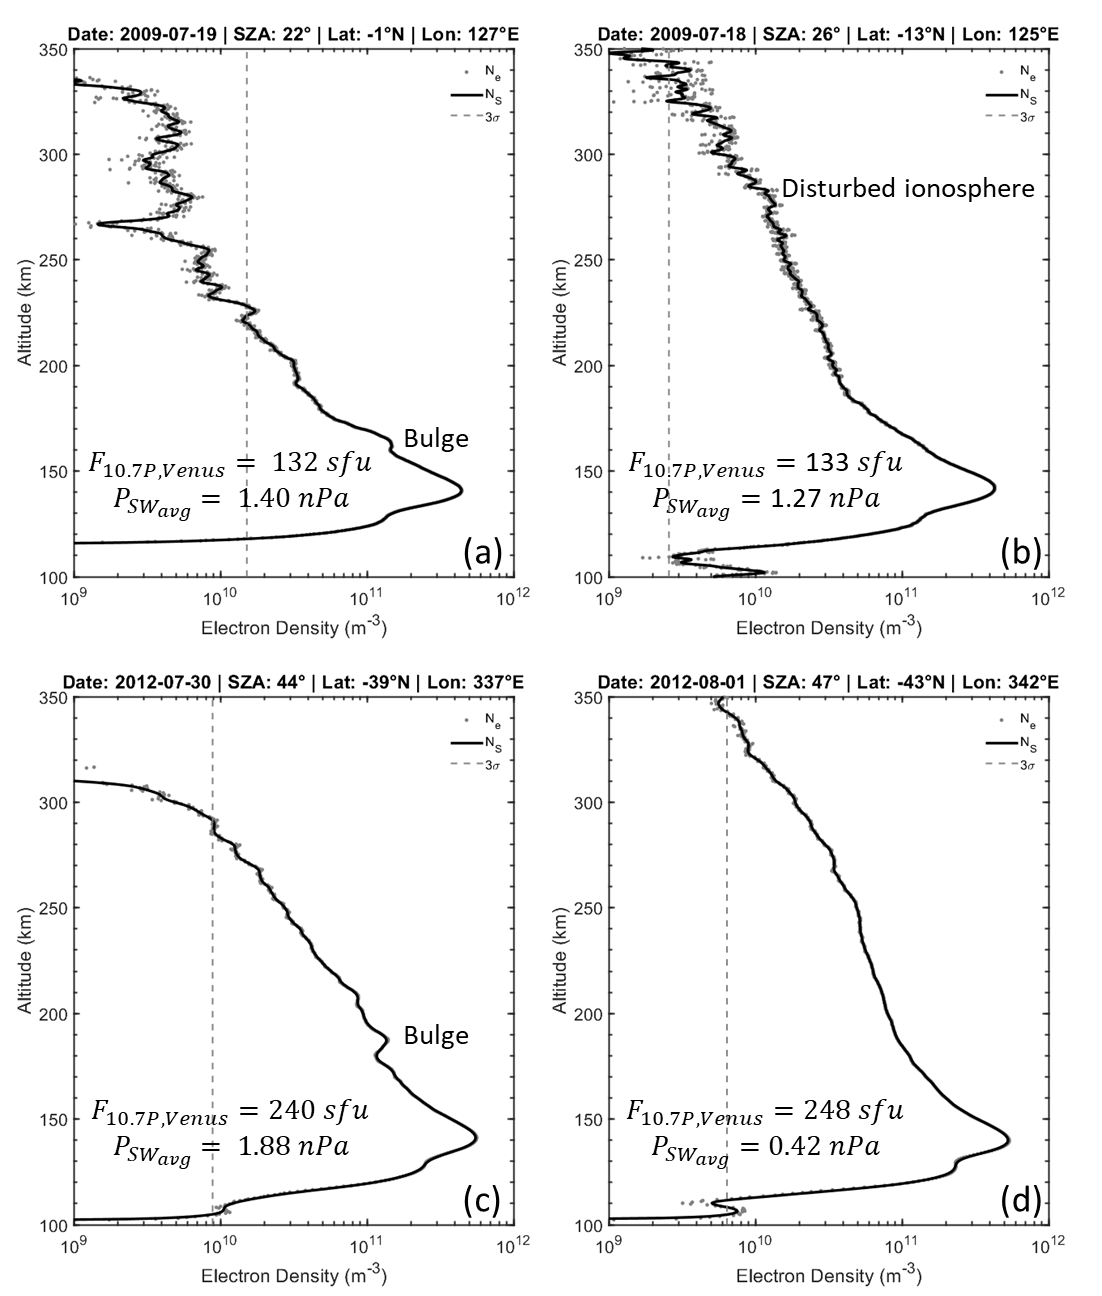
Figure 12: Examples of the relationship between solar wind pressure and bulge/disturbance morphology. High PSW correlates with Type 1 bulges or topside disruption, low PSW with bulge absence.
While no deterministic threshold in PSW for bulge formation is identified, the data implicate variable coupling between the solar wind and ionosphere as a controlling factor—either via induced magnetic field penetration (magnetization), vertical convection, or particle precipitation.
Theoretical Implications and Outstanding Issues
- Photochemical-diffusive models fail to account for observed bulge prevalence, morphology, and variability. Chapman-based models do not predict secondary topside maxima of the observed magnitude/frequency.
- The best empirical tracer for bulge occurrence and strength is not solar EUV flux (i.e., not strictly photochemical origin), but the convolution of solar wind parameters and background thermospheric density.
- Hybrid MHD models, and observed magnetic signatures (induced magnetic field enhancements at bulge altitudes during high PSW intervals), support scenarios with externally driven, rather than internal or steady-state, generation mechanisms for the bulge.
- Direct solar wind connection—plausibly via downward convective flows, localized magnetic field pile-up, and/or energetic electron precipitation—remains the most physically consistent mechanism but requires further quantification.
Practical and Theoretical Implications for Venus and Aeronomy
The study explicitly demonstrates that ionospheric structure above V2 in Venus’s dayside ionosphere is multivariate and cannot be reduced to steady-state photochemistry or diffusion. Bulge morphology should be regarded as a diagnostic for solar wind-ionosphere coupling strength, background neutral thermospheric structure, and planetary latitude. The methodology sets a precedent for comparative aeronomy with Mars and exoplanet analogs.
The findings have operational consequences for forthcoming missions, especially those equipped with both in-situ particle monitors and radio science payloads (e.g., India’s Venus Orbiter Mission). Optimal analysis will require the integration of in-situ and remote electron density measurements with sophisticated data-model assimilation to unravel possible feedbacks between atmospheric circulation, ion composition, and external forcing in the absence of a planetary dipole field.
Conclusion
This study offers the most systematic and quantitatively robust characterization to date of the Venusian ionospheric bulge, incorporating advanced algorithmic classification and a comprehensive survey of parameter dependencies. The results robustly isolate the topside bulge as a predominantly externally forced feature, strongly dependent on solar wind momentum flux, geospatial location, and background atmospheric state, while being largely unaccounted for by canonical photochemical models. This advances the interpretation of planetary ionospheres, especially those lacking strong intrinsic magnetic fields, and calls for further theoretical and observational work into transient, spatial, and energetic couplings across the Venusian space environment.