AIFloodSense: A Global Aerial Imagery Dataset for Semantic Segmentation and Understanding of Flooded Environments
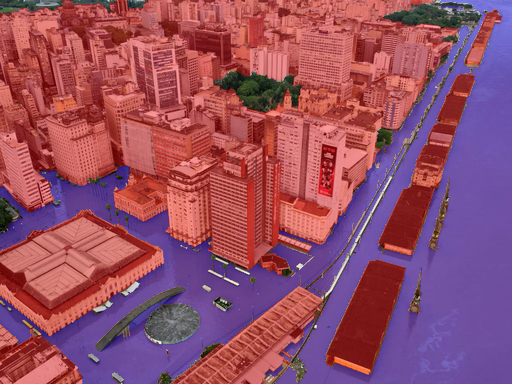
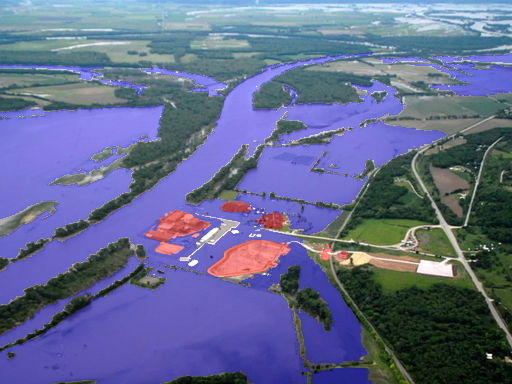
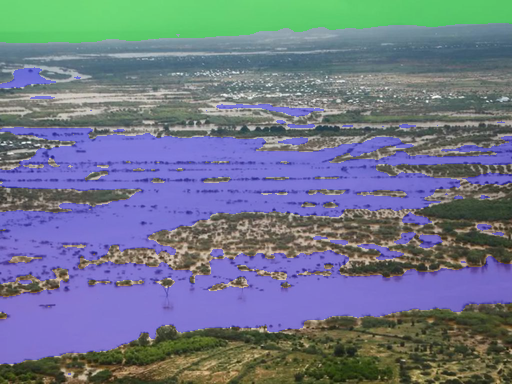
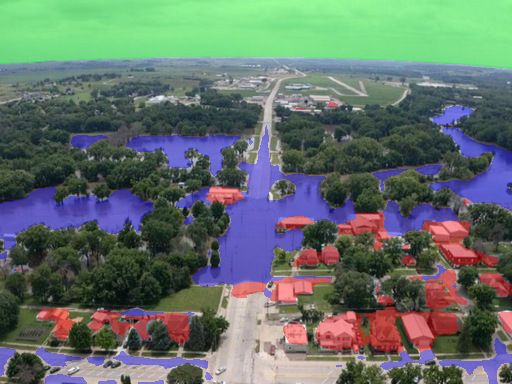
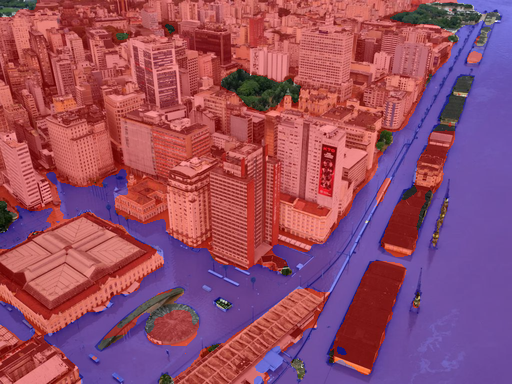
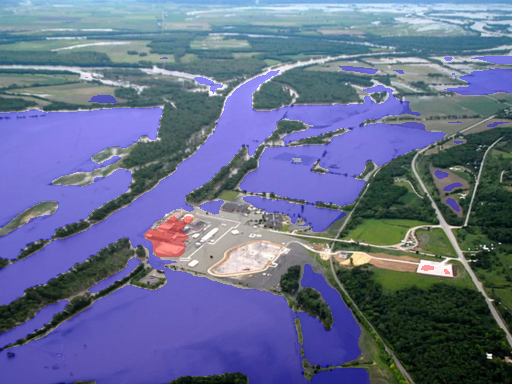
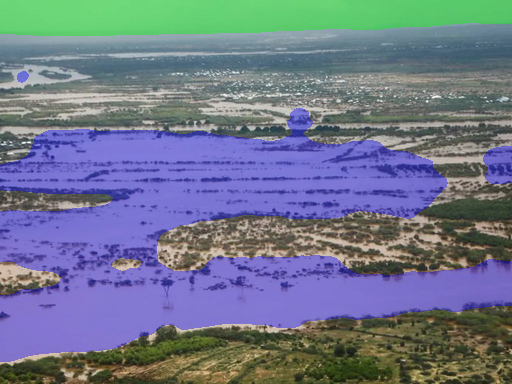
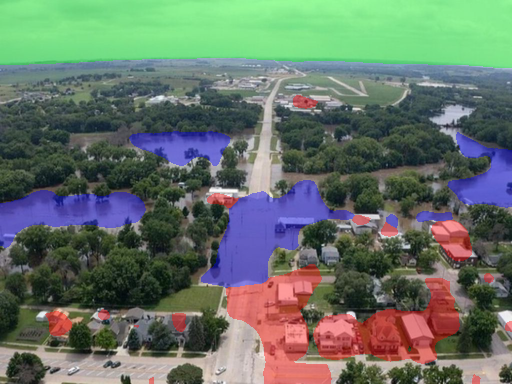
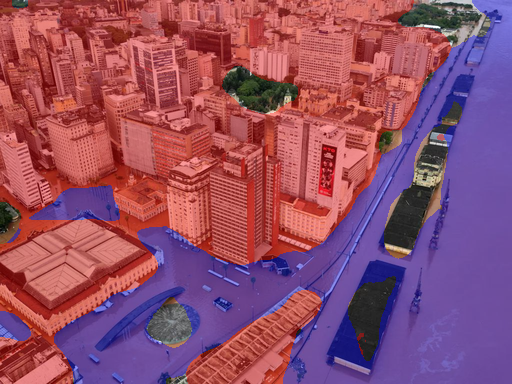
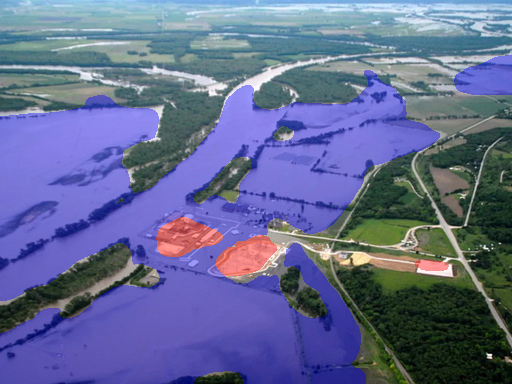
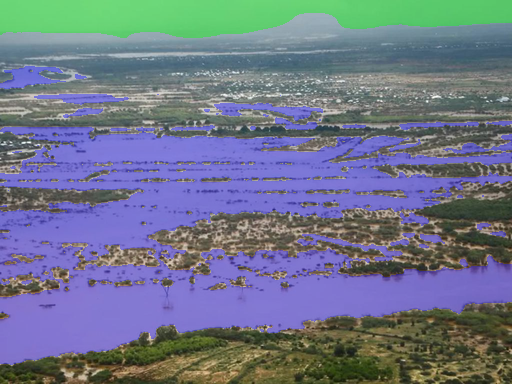
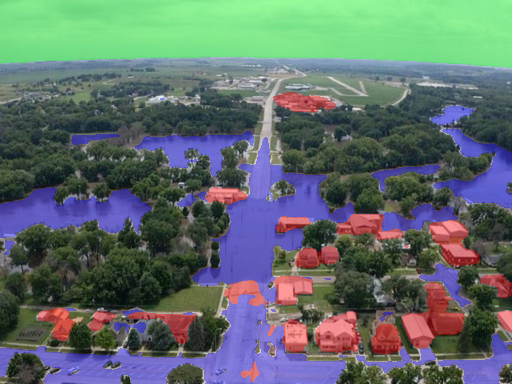
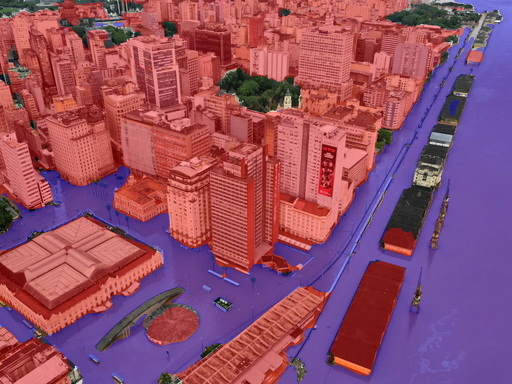
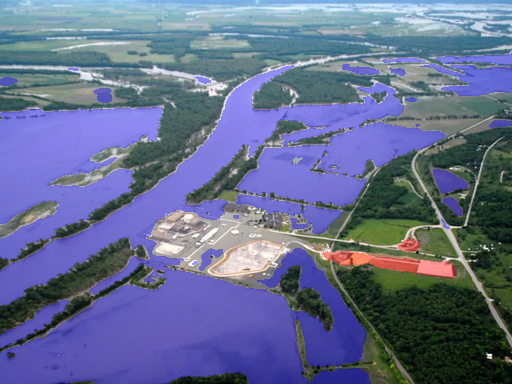
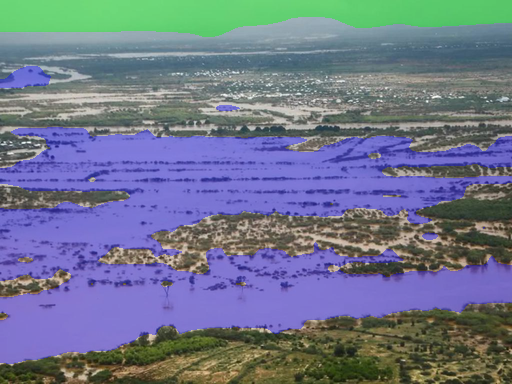
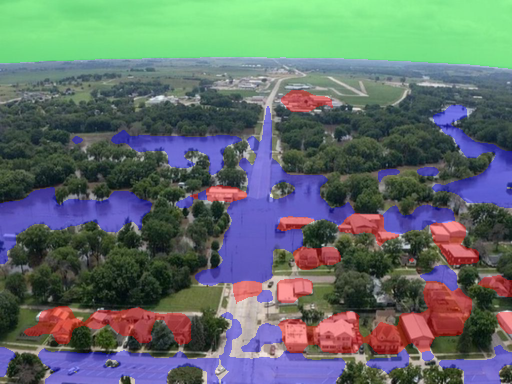
Abstract: Accurate flood detection from visual data is a critical step toward improving disaster response and risk assessment, yet datasets for flood segmentation remain scarce due to the challenges of collecting and annotating large-scale imagery. Existing resources are often limited in geographic scope and annotation detail, hindering the development of robust, generalized computer vision methods. To bridge this gap, we introduce AIFloodSense, a comprehensive, publicly available aerial imagery dataset comprising 470 high-resolution images from 230 distinct flood events across 64 countries and six continents. Unlike prior benchmarks, AIFloodSense ensures global diversity and temporal relevance (2022-2024), supporting three complementary tasks: (i) Image Classification with novel sub-tasks for environment type, camera angle, and continent recognition; (ii) Semantic Segmentation providing precise pixel-level masks for flood, sky, and buildings; and (iii) Visual Question Answering (VQA) to enable natural language reasoning for disaster assessment. We establish baseline benchmarks for all tasks using state-of-the-art architectures, demonstrating the dataset's complexity and its value in advancing domain-generalized AI tools for climate resilience.


Paper Prompts
Sign up for free to create and run prompts on this paper using GPT-5.
Top Community Prompts
Explain it Like I'm 14
AIFloodSense: What this paper is about
This paper introduces AIFloodSense, a new collection of aerial photos taken during real floods around the world. The goal is to help computers learn to spot flooded areas, understand what’s in the scene (like buildings and sky), and answer simple questions about the flood from the image. The dataset is large, diverse, and recent, making it useful for building better AI tools that can work in many different places.
Main purpose in simple terms
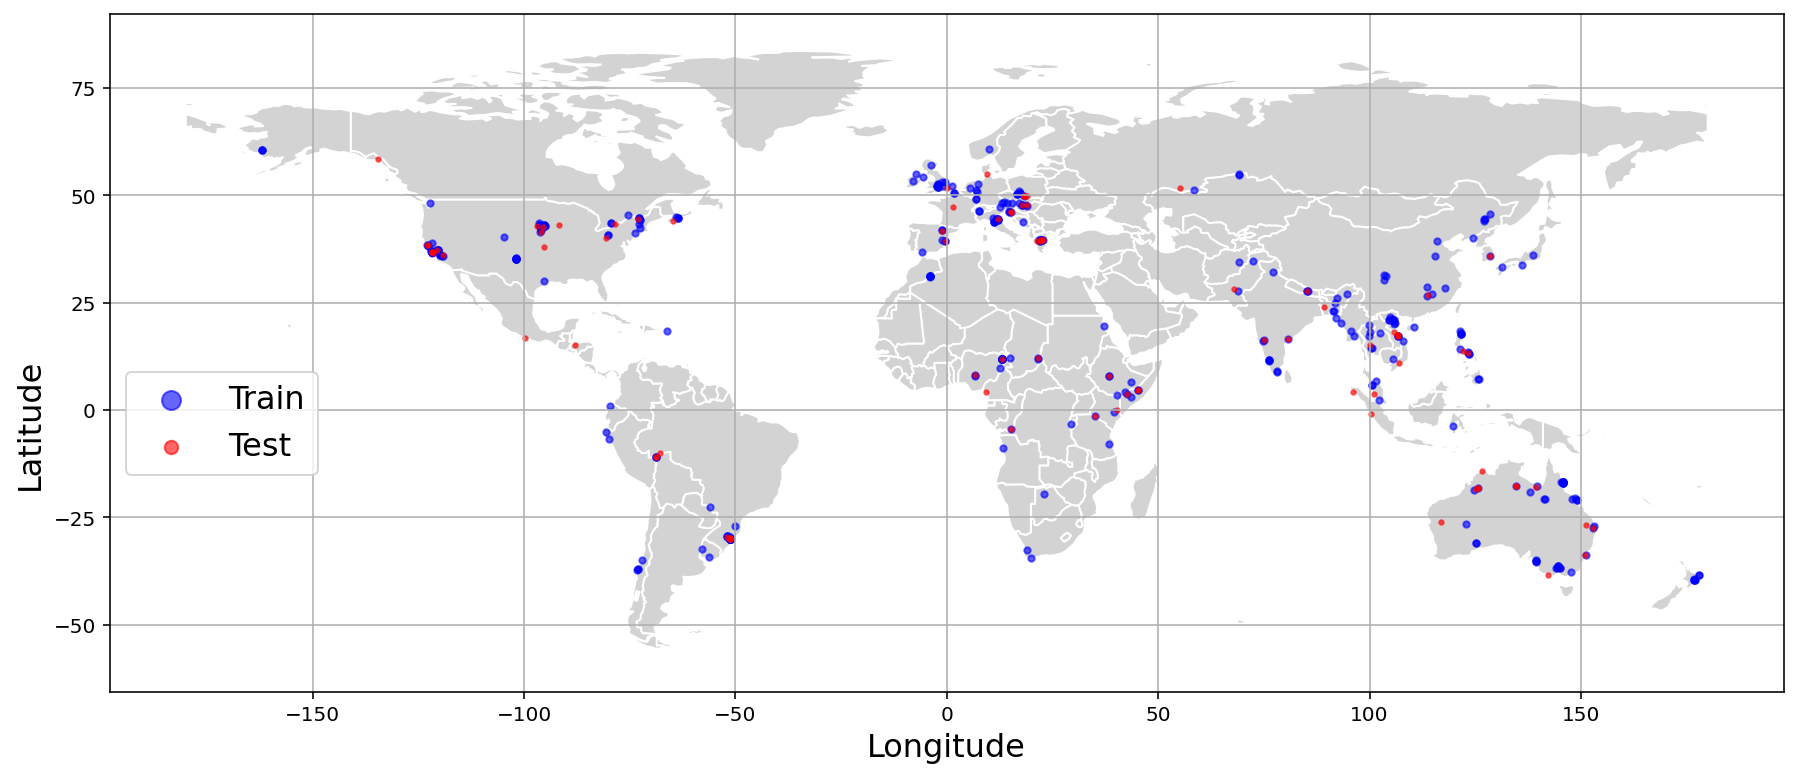
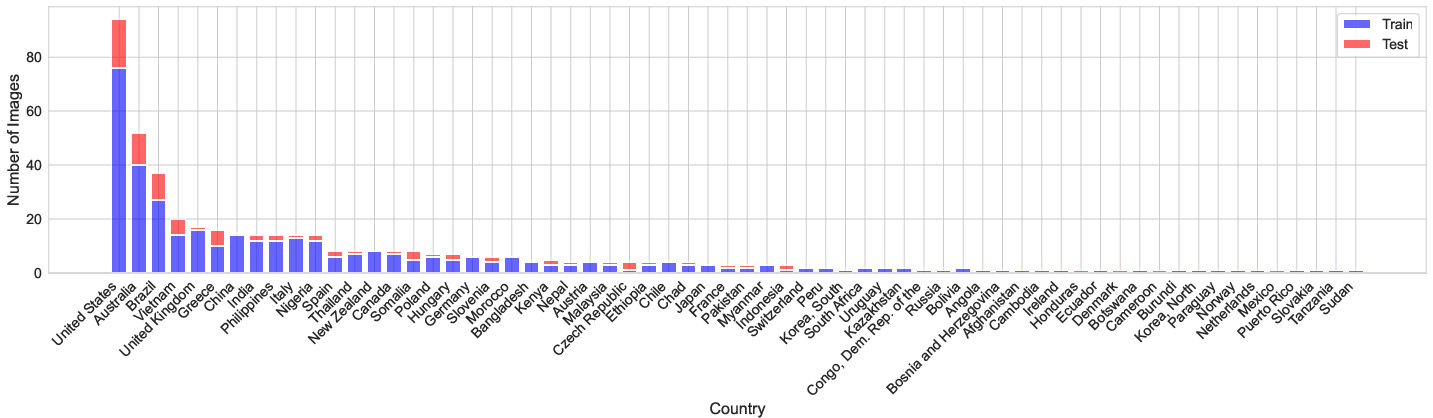
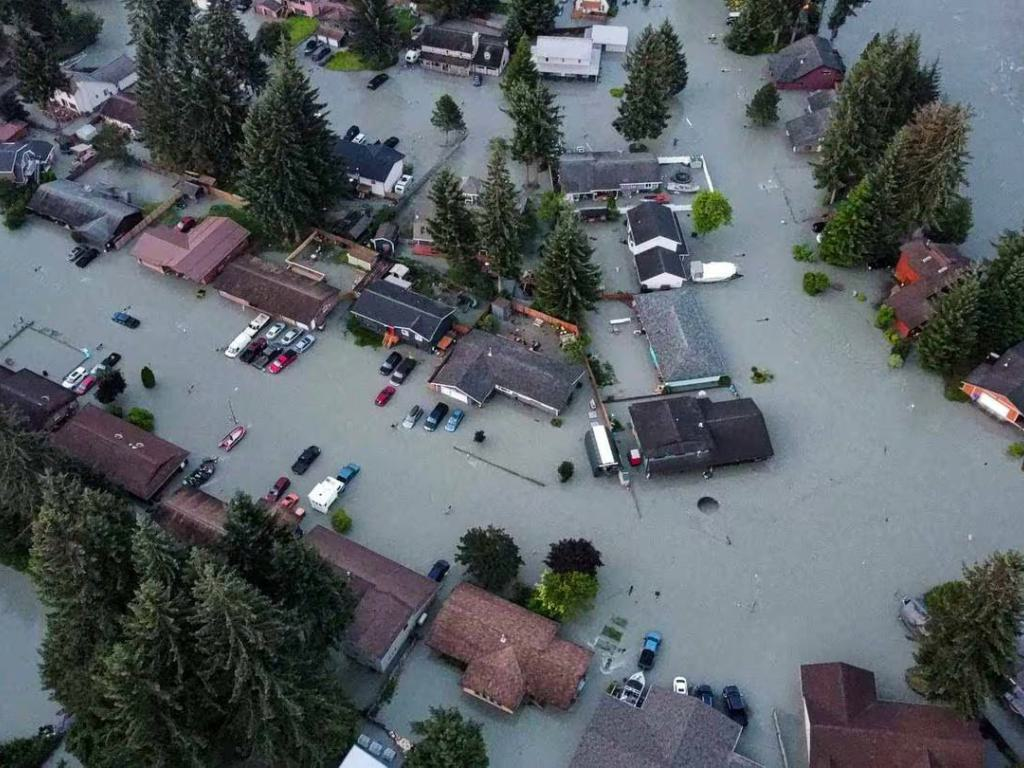
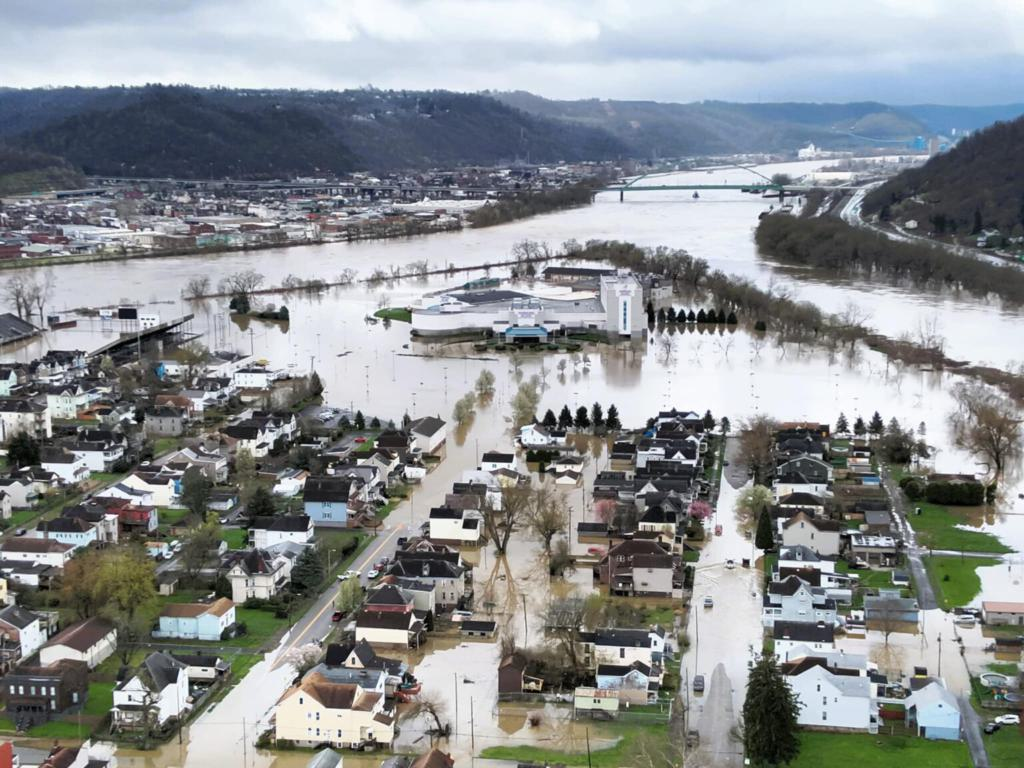
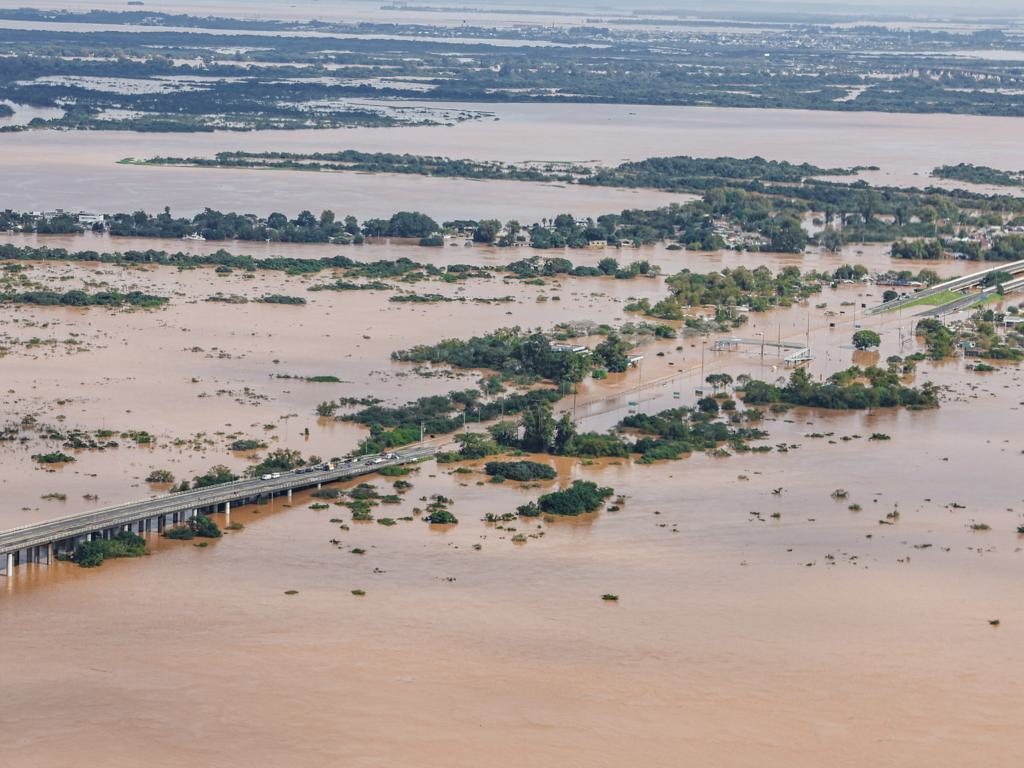
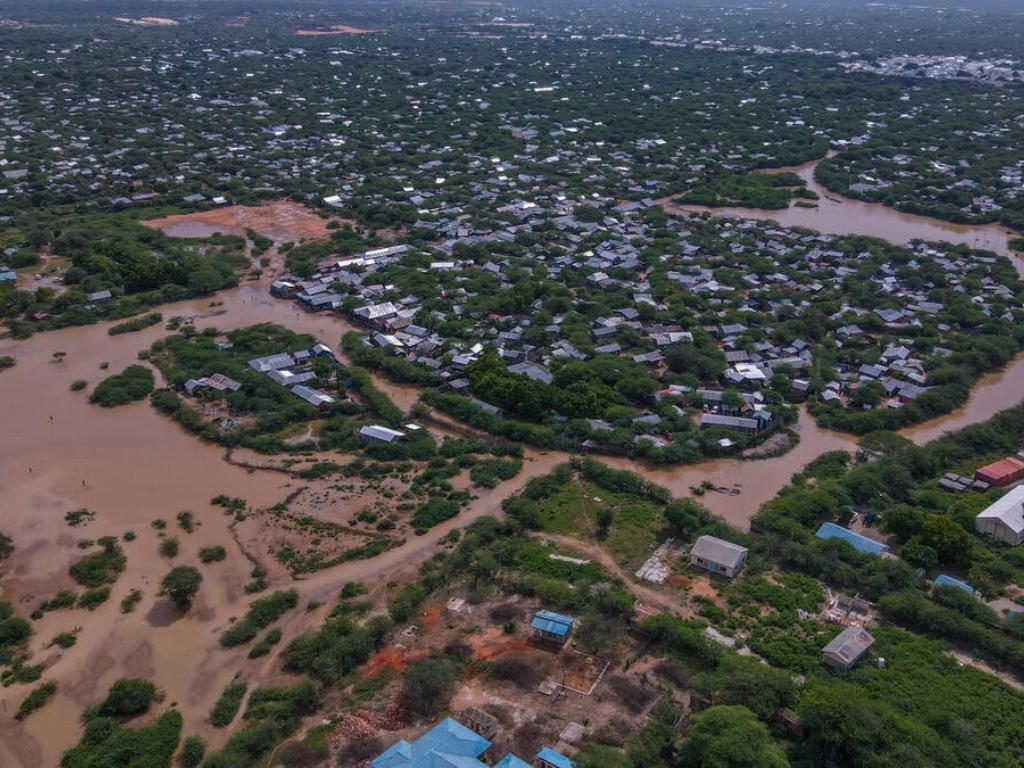
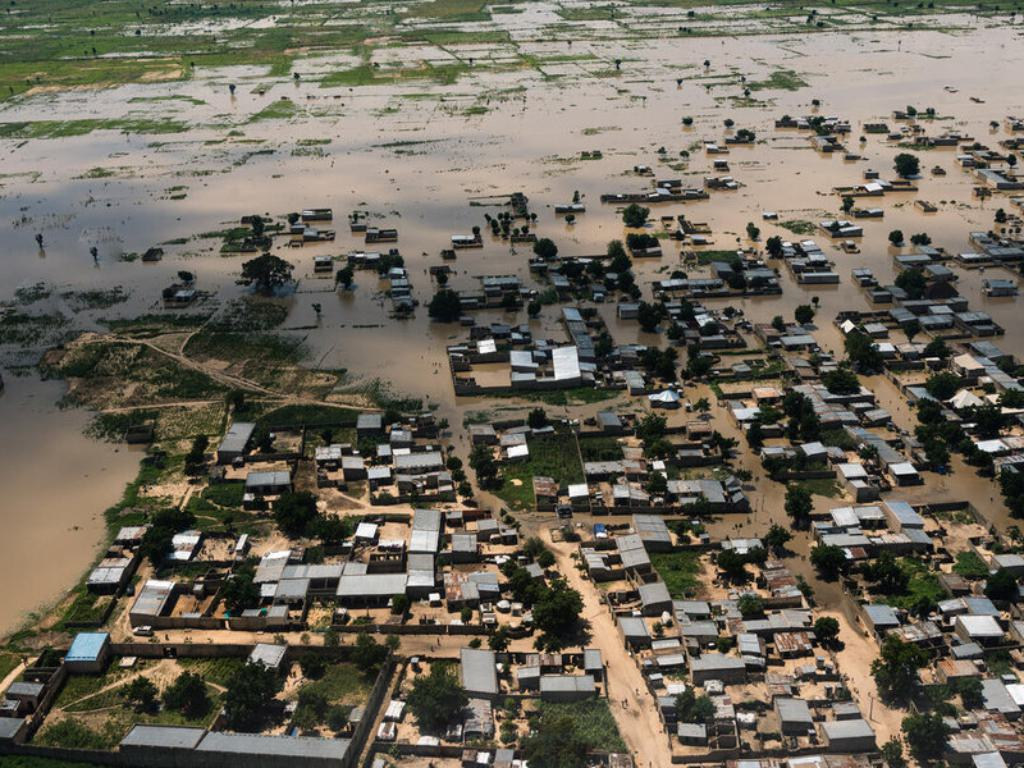
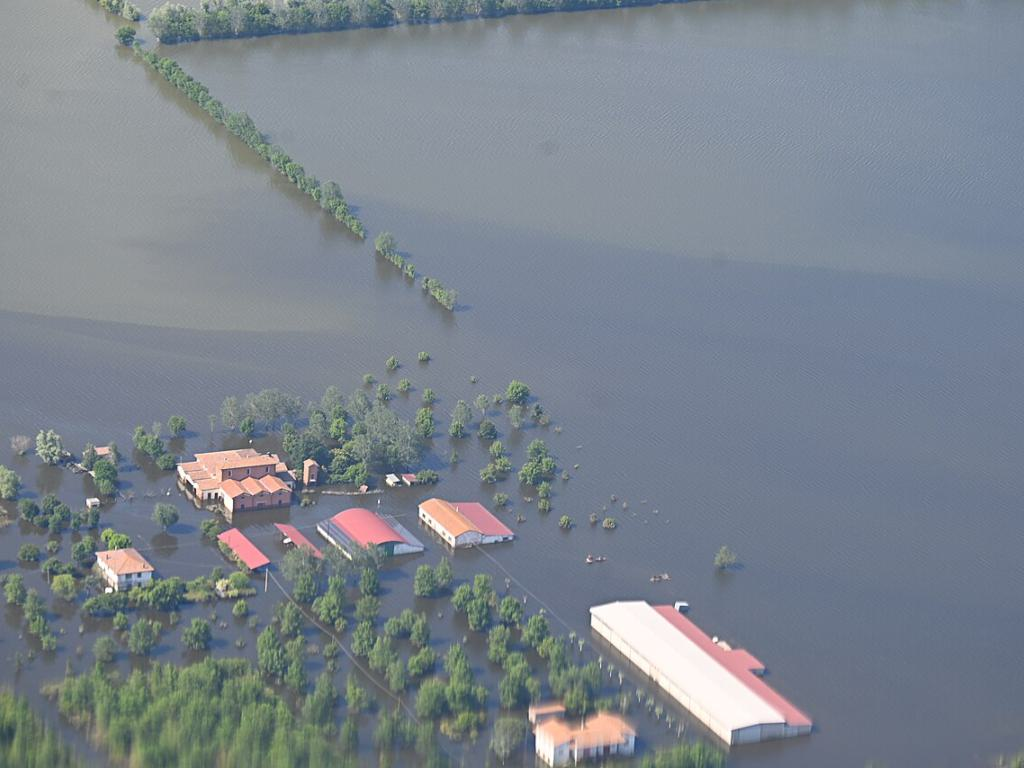
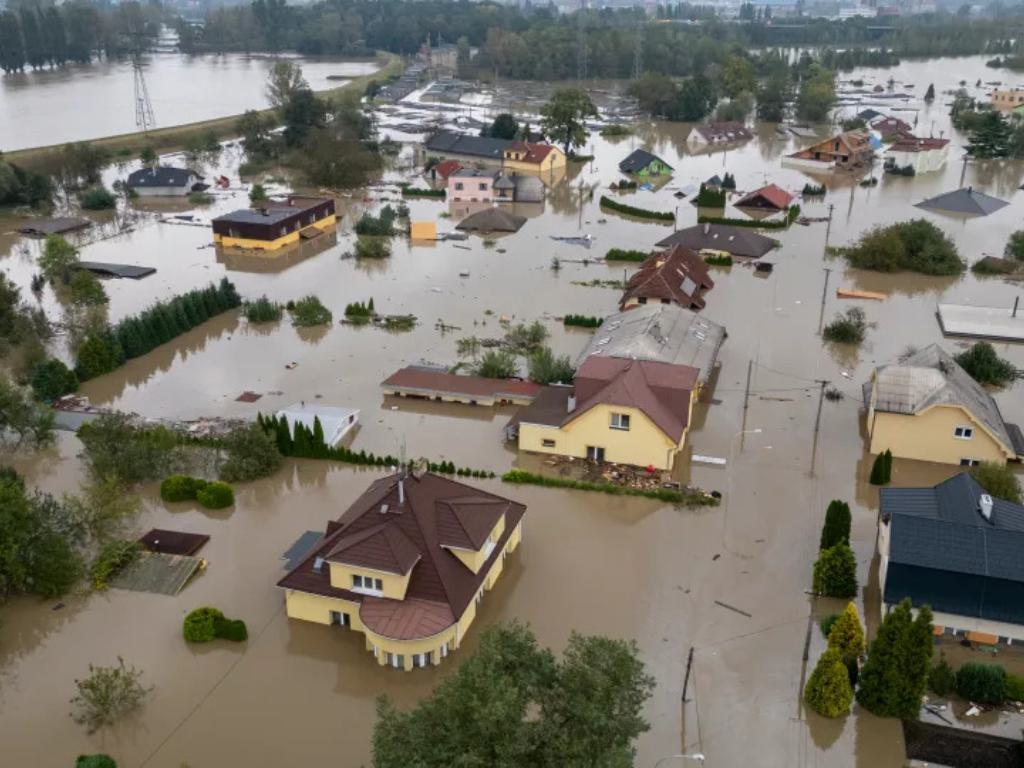
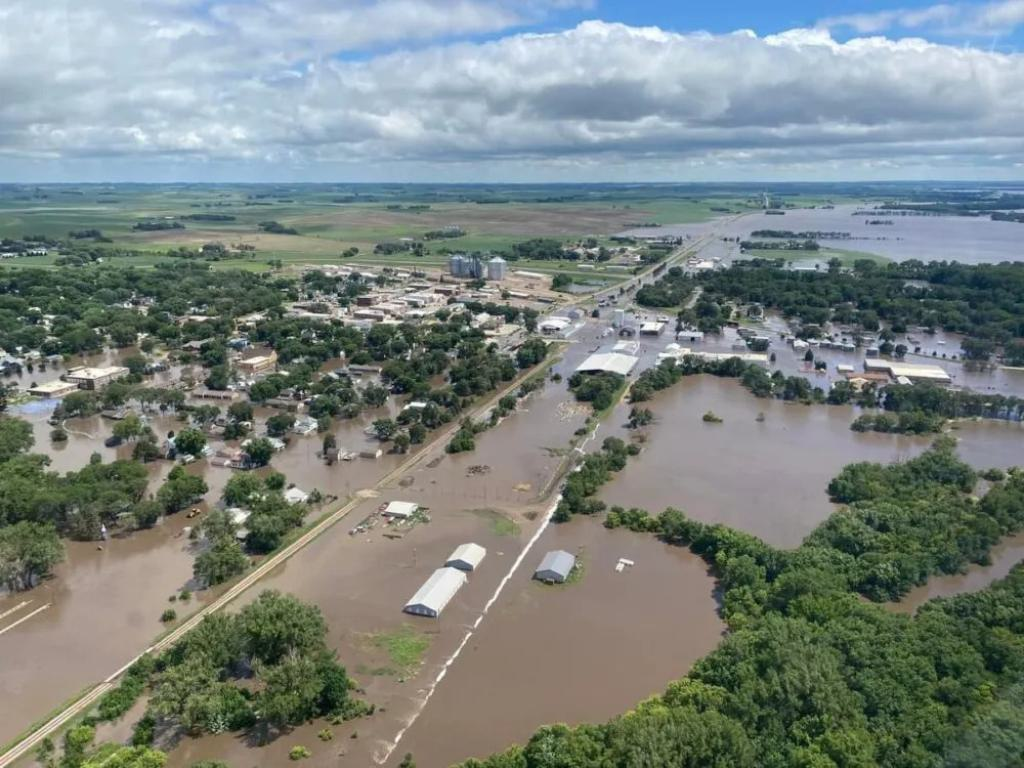
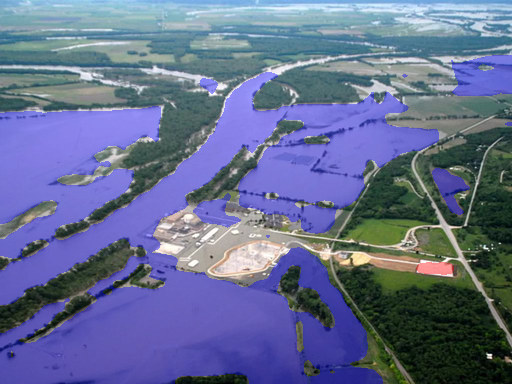
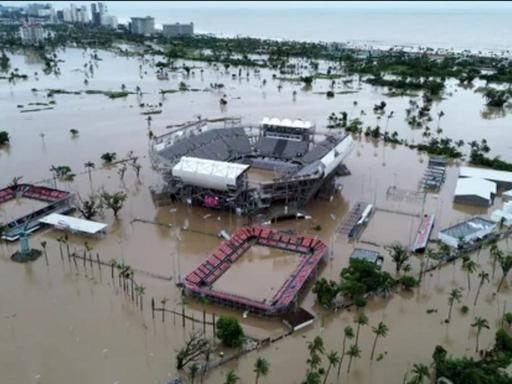
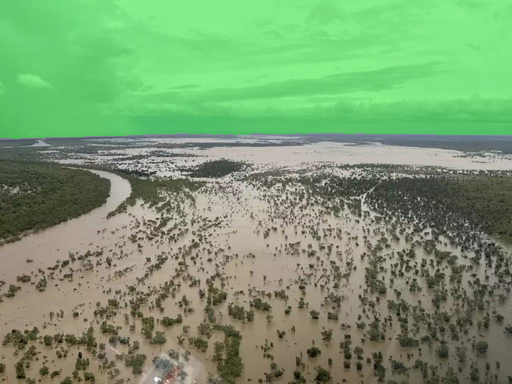
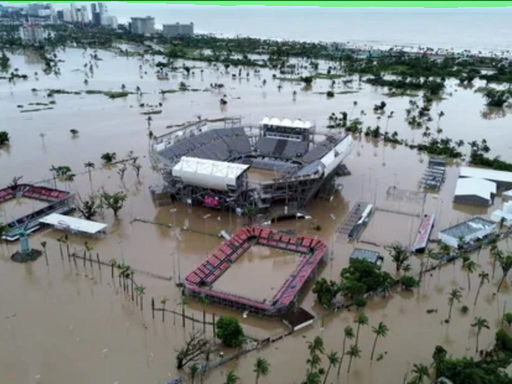
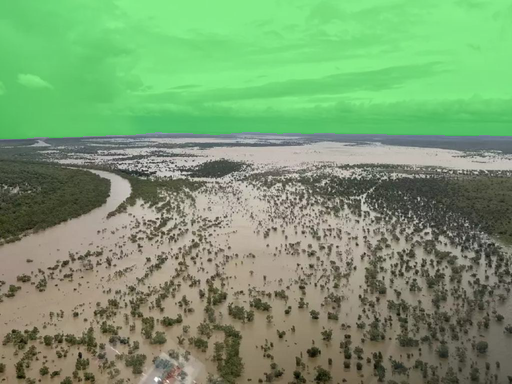
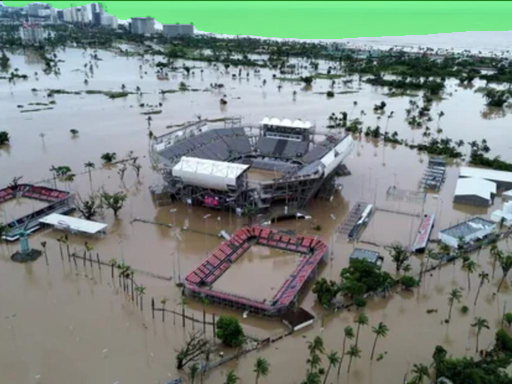
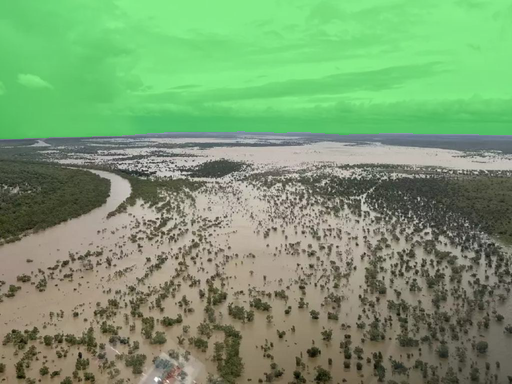
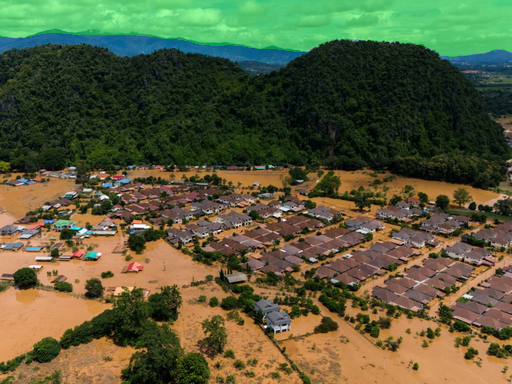
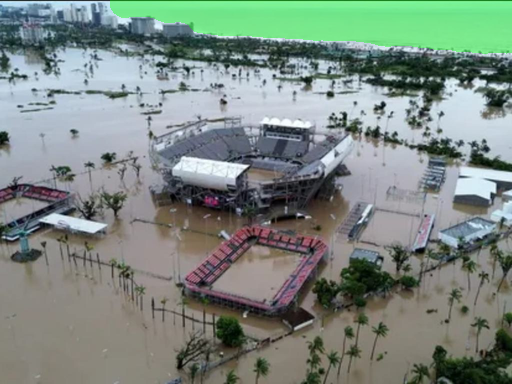
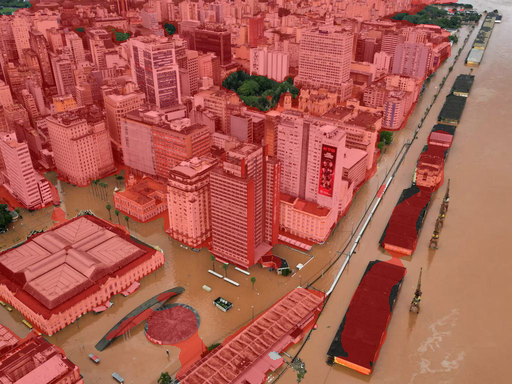
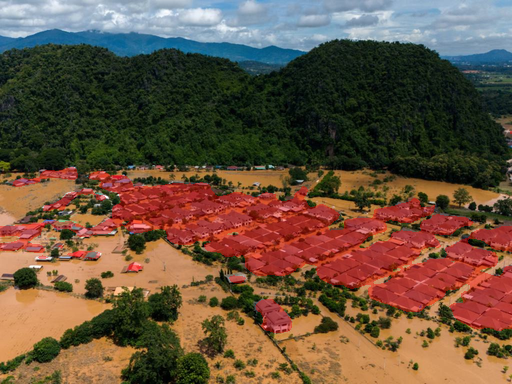
Floods are happening more often and causing a lot of damage. If computers can quickly and accurately analyze aerial photos (for example, from drones), they can help emergency teams decide where to send help. But to teach computers to do this well, scientists need good training data. AIFloodSense provides that data: 470 high-quality images from 230 flood events in 64 countries across six continents, mostly from 2022–2024.
Key questions the researchers asked
The paper focuses on three simple goals:
- Can AI tell what kind of place it is (city vs. countryside), whether the sky is visible, and which continent the image is from?
- Can AI “color in” every pixel of the image to show where the flood water, buildings, and sky are? This is called semantic segmentation.
- Can AI answer helpful questions about the image, like “How many buildings are flooded?” or “Is there sky in the photo?”
How they built and organized the dataset
Think of this like building a massive picture book for computers, with clear labels.
- Collecting images: The team gathered aerial images (mostly from drones) showing real flood scenes worldwide. They kept only clear, detailed pictures to make training reliable. All images were resized to the same size (1024×768) to make them consistent for computer training.
- Labeling what’s in the image:
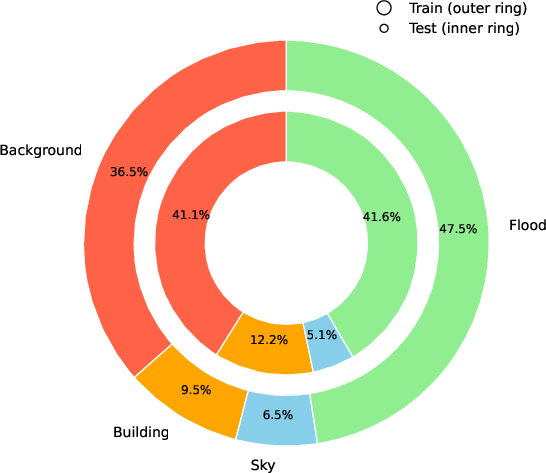
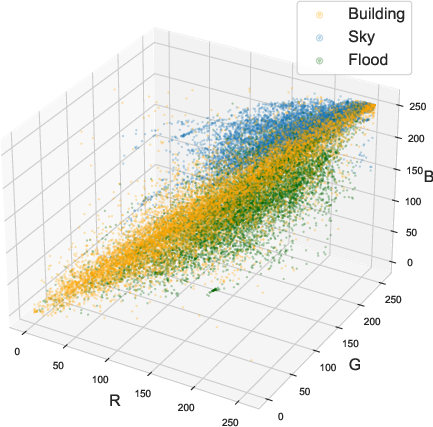
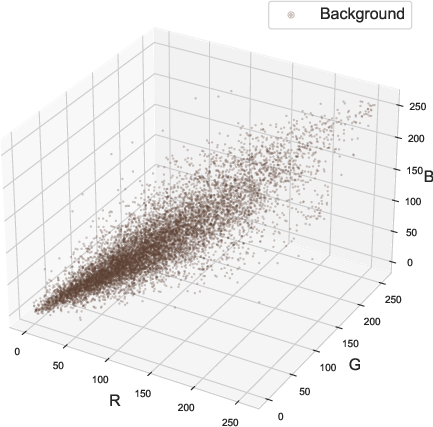
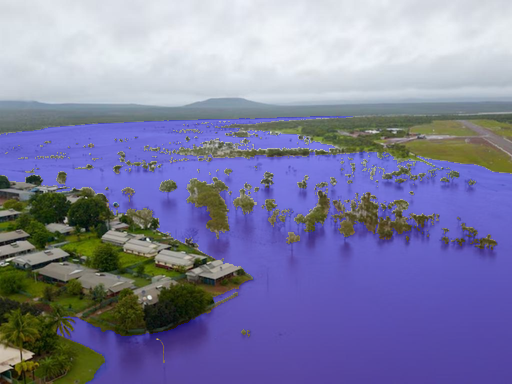
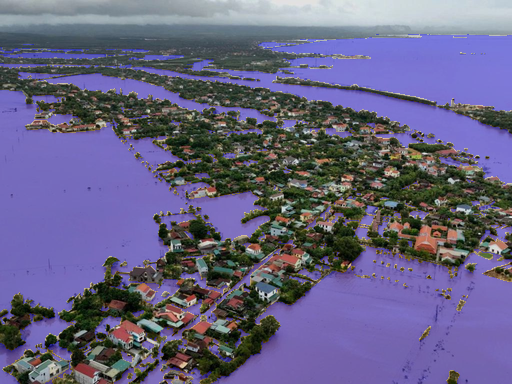
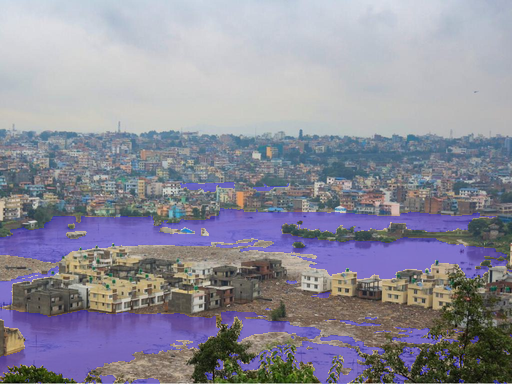
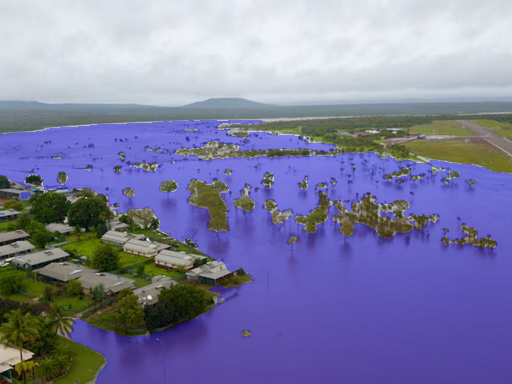
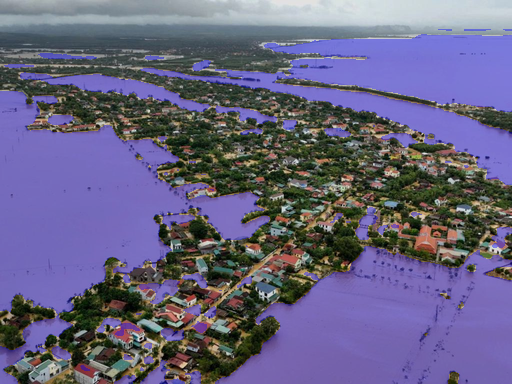
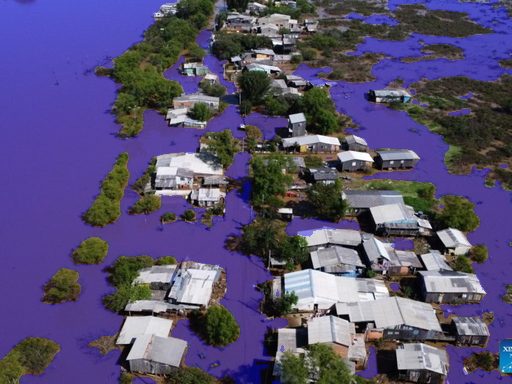
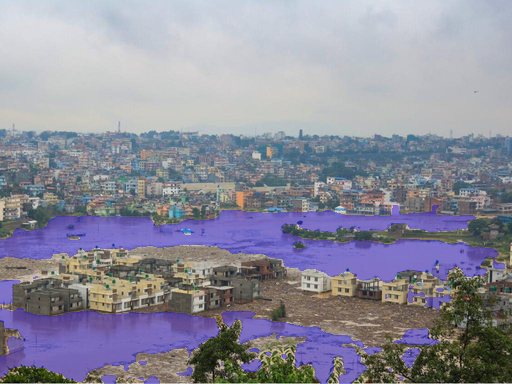
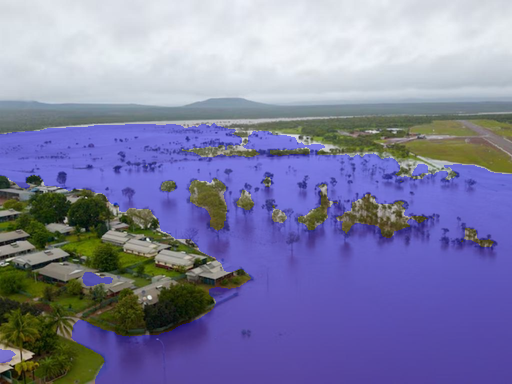
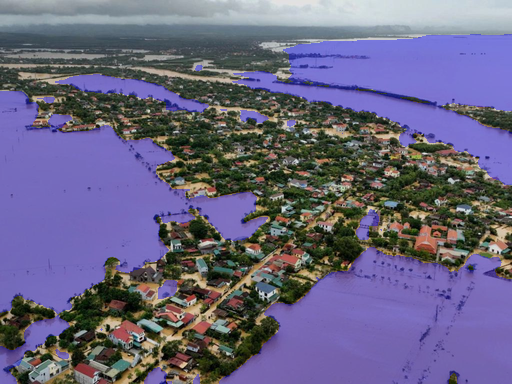
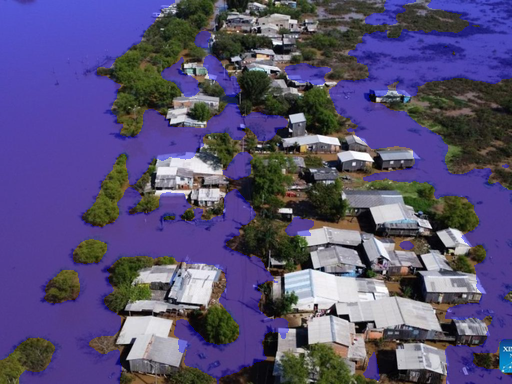
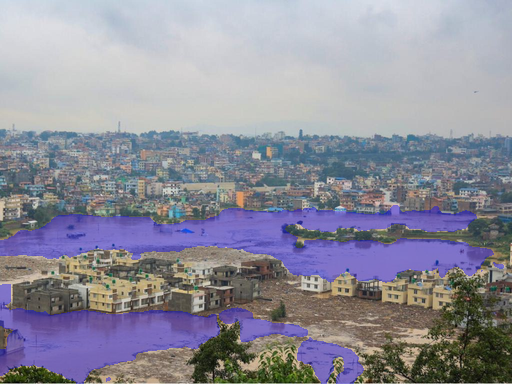
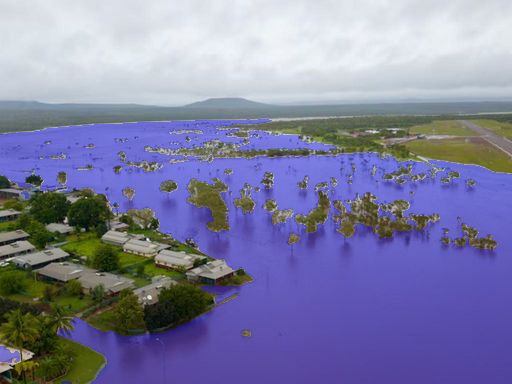
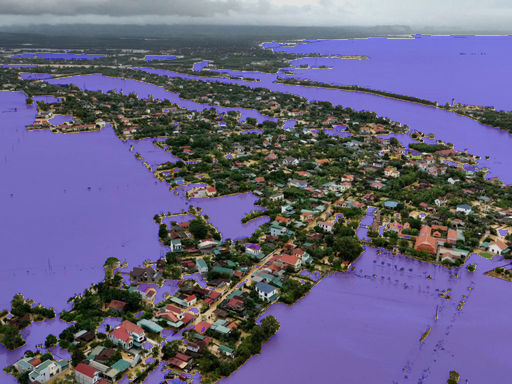
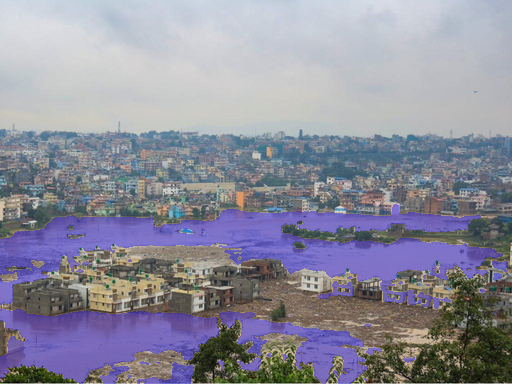
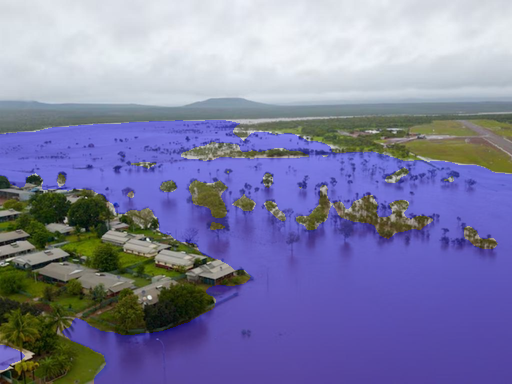
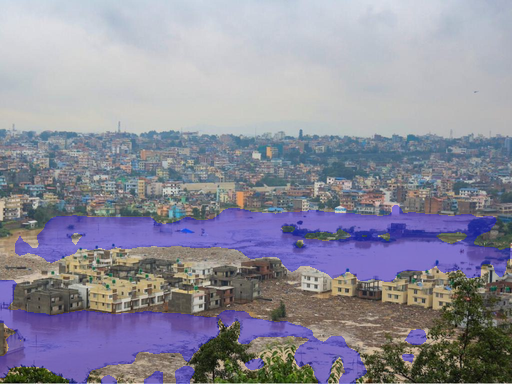
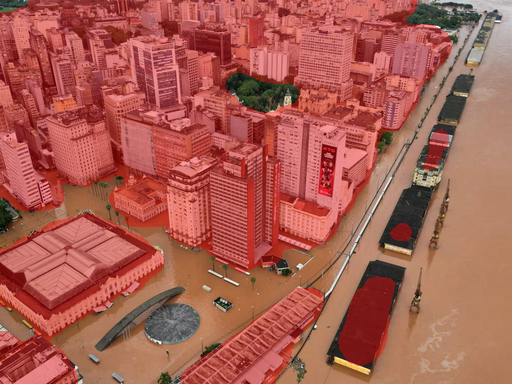
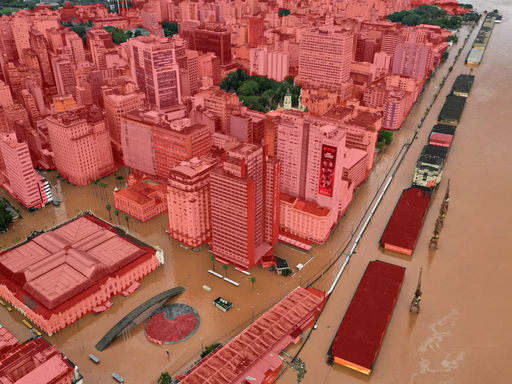
- Semantic segmentation: They created pixel-level “masks,” which are like coloring each tiny dot (pixel) in the picture. Every pixel is labeled as flood, building, sky, or background. This helps AI learn exactly where flood water is.
- Classification labels: Each image is tagged with:
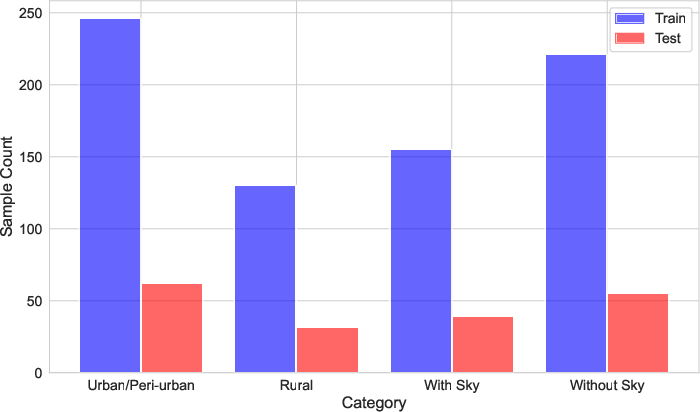
- Environment type: Urban/peri-urban (city or nearby) or rural (countryside)
- Camera angle info: Whether the sky is visible
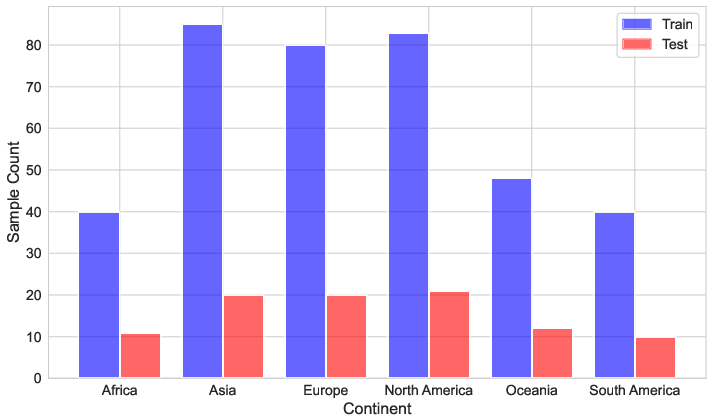
- Geography: Which continent, plus the location (latitude and longitude)
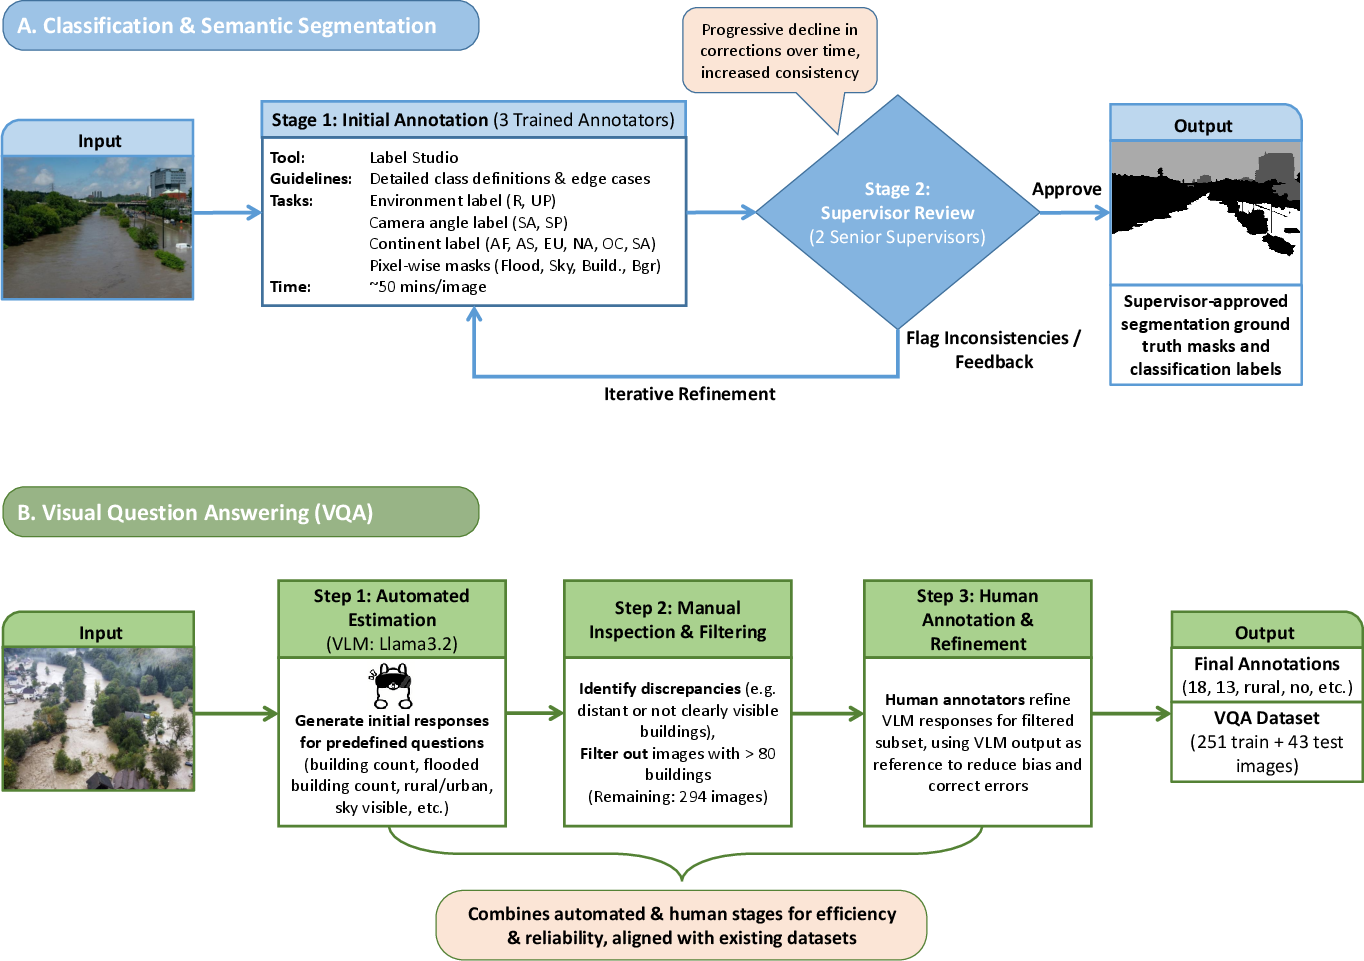
- Quality control: Three trained annotators did the labeling using special software (Label Studio). Then two supervisors checked and requested fixes until everything was consistent. On average, labeling one image took about 50 minutes.
- Visual Question Answering (VQA): For a subset of images, they prepared five simple questions the AI should answer: 1) How many buildings are in the image? 2) Is the region urban/peri-urban or rural? 3) Is the sky visible? 4) Is the image showing a flood? 5) How many buildings are flooded?
They first used a vision-LLM (Llama 3.2) to propose answers, then humans checked and corrected them. If a scene had too many buildings (over 80), it was too hard to count accurately, so those were excluded. The final VQA set has 251 training images and 43 test images.
- Train/test split: They divided the full dataset into training (80%) and testing (20%) while keeping a good balance of city/country, sky/no-sky, continents, and class pixels. This makes evaluations fair.
What they tested and what they found
The team set “baseline” results using strong, modern AI models. Baselines are like first scores to beat in future work. They did this for:
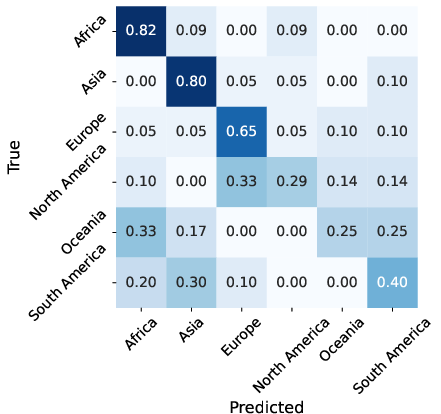
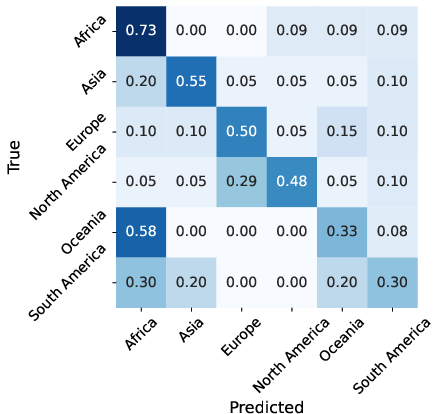
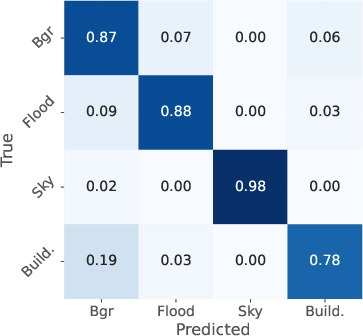
- Classification: Identifying environment type (urban vs. rural), sky presence, and continent.
- Semantic segmentation: Precisely marking flood water, buildings, and sky at the pixel level.
- VQA: Answering the five practical questions about the scene.
Main takeaways:
- The dataset is challenging and diverse. Because it includes many places, camera angles, and scene types, simple models don’t always generalize well. That’s good: it pushes researchers to build smarter, more robust AI.
- The pixel-level labels (flood, buildings, sky) are detailed and consistent, enabling fine-grained training.
- New tasks like continent recognition and practical flood-related questions make the dataset more realistic for emergency use cases.
Why this matters
- Better emergency response: AI trained on AIFloodSense can help quickly map flooded areas, count affected buildings, and identify risky zones. This speeds up decisions during disasters.
- Global relevance: Unlike older datasets focused on only a few regions, AIFloodSense covers six continents and 64 countries. Models trained on it are more likely to work well in new places.
- Building future tools: Because the dataset includes multiple tasks (classification, segmentation, and VQA), researchers can train “all-in-one” systems that understand scenes and answer questions, not just detect water.
In short
AIFloodSense is a carefully built, global, and recent dataset of aerial flood images with detailed labels. It helps AI learn to understand floods at a pixel level, classify scene context, and answer useful questions. This can improve how quickly and accurately we assess floods, potentially saving time, money, and lives. The dataset is publicly available, so anyone can use it to help advance flood analysis tools.
Knowledge Gaps
Knowledge gaps, limitations, and open questions
Below is a concise, actionable list of what remains missing, uncertain, or unexplored in the paper and dataset to guide future research:
- Dataset scale: 470 images total (230 events) is small for training robust, generalizable deep models; the VQA subset is especially limited (294 images total; 251 train/43 test).
- Negative samples: No non-flood imagery is included, limiting the dataset’s utility for flood-vs-non-flood detection and making the VQA “is the image flooded?” question trivial.
- Event-wise leakage risk: The paper does not state whether the 80/20 split enforces event-level separation; if images from the same event appear in both splits, benchmarks may be over-optimistic.
- Post-event only: Lack of pre-/post-disaster pairs prevents change detection, damage progression analysis, and robust pre/post fusion benchmarks.
- Missing geospatial calibration: No per-pixel georeferencing, ground sampling distance, or orthorectification—users cannot derive real-world areas/lengths or integrate seamlessly with GIS.
- Absent sensor/pose metadata: No UAV altitude, camera intrinsics, focal length, or view pitch/roll/yaw—limits geometric correction, reproducibility, and analysis of viewpoint effects.
- Coarse semantic taxonomy: Only four classes (flood, building, sky, background); key classes for disaster response (e.g., roads, bridges, vehicles, vegetation, waterways, debris) are missing.
- No permanent vs. flood water differentiation: Models cannot learn to distinguish inundation from pre-existing water bodies.
- No damage severity labels: Building condition/damage level (e.g., minor/major/collapsed) is not annotated, limiting impact assessment use cases.
- No instance-level annotations: Building masks are semantic, not instance-level—impedes training/validation of counting methods and limits panoptic/instance segmentation research.
- VQA annotation pipeline bias: Initial LLM (Llama3.2) answers seed the labels; potential model-induced biases/error propagation are not quantified or corrected via rigorous QA metrics.
- VQA filtering bias: Exclusion of images with >80 buildings removes dense urban scenes; the effect of this truncation on distribution shift and model generalization is unquantified.
- Inter-annotator agreement not reported: No IoU/κ statistics between annotators or between annotators and supervisors; annotation reliability and uncertainty remain unknown.
- Class imbalance: Pixel distributions are highly skewed (e.g., background dominance); baselines’ handling of imbalance (loss reweighting, sampling, focal losses) is not described or ablated.
- Regional imbalance and domain shift: Although globally distributed, per-continent/country sample counts are uneven; no leave-one-continent-out or leave-one-country-out evaluations are provided.
- Camera angle proxy: “Sky presence” is a coarse proxy for viewpoint; no numeric camera angle or horizon angle is provided to enable controlled analysis of viewpoint effects.
- Image resizing effects: Uniform resizing to 1024×768 may distort scale and degrade small-object fidelity; no comparison against tiling/original-resolution training is reported.
- Lack of multimodal data: No SAR, multispectral, DEM, or meteorological context is provided; the benefits of multimodal fusion for flood delineation and robustness remain unexplored.
- Temporal dynamics absent: No multi-temporal sequences; model performance on evolving flood extent and receding phases is not measurable.
- Cross-dataset generalization untested: No experiments training on AIFloodSense and testing on FloodNet/RescueNet/WorldFloods (and vice versa) to assess transferability.
- Real-world utility metrics: No runtime, memory, or on-device (UAV/edge) feasibility benchmarks; practical deployment constraints remain unaddressed.
- VQA scope narrow: Only five fixed question types; no open-ended QA, reasoning chains, or spatial grounding tasks (e.g., road passability, accessibility, resource allocation).
- Ambiguities not labeled: Reflections, occlusions (tree canopy, structures), turbidity, shadows, and specular highlights are not annotated or flagged, impeding robust error analysis.
- Hazard subtype missing: No labels for flood mechanism (riverine, coastal surge, pluvial/flash flood) or environment subtype—limits stratified analysis by hazard type.
- Environmental/context labels coarse: “Urban/peri-urban vs rural” is conflated; more granular LULC categories (industrial, residential density, agricultural types, wetlands) are absent.
- Ethical/legal uncertainties: Web-sourced imagery; licensing, usage rights, and privacy considerations (e.g., identifiable individuals/properties) are not detailed in the release.
- Potential text/ watermark leakage: No mention of redaction; continent classification benchmarks may be confounded by visible text, logos, or timestamps in images.
- Validation against external ground truth: No comparison to hydrological maps, official flood extent products, or OSM building footprints to quantify annotation accuracy or coverage error.
- Severity/impact quantification: No water depth proxies, inundation duration, or socioeconomic indicators—precludes severity estimation and risk prioritization studies.
- Climate/seasonality not captured: No metadata for season, precipitation, or climatic zone (e.g., Köppen classification); their effect on visual appearance and model performance remains unknown.
- Practitioner validation: No user studies with emergency managers or NGOs to assess annotation schema adequacy, task relevance, or decision-support effectiveness.
Practical Applications
Overview
Based on the AIFloodSense paper—a globally diverse, high-resolution aerial imagery dataset with pixel-level flood/sky/building/background annotations, structured image-level labels (environment, sky presence, continent), and a focused VQA set—below are practical applications derived from its findings, methods, and innovations. Applications are grouped by deployability timeline and mapped to sectors where relevant. Each item notes potential tools/products/workflows and feasibility dependencies.
Immediate Applications
- Emergency management and public safety: rapid flood extent mapping and prioritization
- Use pre-trained segmentation baselines fine-tuned on local data to generate flood extents and counts of flooded buildings within minutes of UAV capture; triage zones for search and rescue.
- Tools/products/workflows: model-in-the-loop GIS dashboards (QGIS/ArcGIS plugins), Jupyter notebooks for batch inference, ESRI ModelBuilder toolbox, web tileserver for flood masks, simple VQA panel to answer “Is this image flooded?” and “How many flooded buildings?”.
- Dependencies/assumptions: timely UAV imagery (optical/daytime) and airspace approvals; model calibration to local scene characteristics; acceptance of 4-class ontology (no explicit roads/vehicles); compute availability at EOC.
- Software/GIS vendors: turnkey AI modules for flood mapping from UAV imagery
- Package the baseline segmentation and VQA models into SDKs or plugins for drone flight planning apps and GIS suites; standardized 1024×768 pre-processing reduces integration friction; include continent and sky presence classifiers to auto-route imagery to appropriate model variants.
- Tools/products/workflows: ArcGIS Pro/Enterprise add-ins, QGIS processing toolbox, REST API microservices, DroneDeploy/Pix4D app marketplace extensions.
- Dependencies/assumptions: licensing compatibility; model performance across sensors/FOVs; basic MLOps for versioning and rollback.
- Insurance and reinsurance: rapid claims triage and portfolio loss estimation
- Apply building and flooded-building counts per AOI to support claim surge prioritization and early loss modeling after events; use urban/rural labels to stratify severity assumptions.
- Tools/products/workflows: API to deliver per-tile damage indicators, event-level dashboards, actuarial scripts that ingest counts and extents.
- Dependencies/assumptions: sufficient image resolution to disambiguate buildings; geolocation metadata alignment with policy exposure grids; human-in-the-loop QA for high-stakes decisions.
- Utilities and critical infrastructure operators: asset impact screening
- Overlay flood masks with asset maps (substations, pump stations, telecom cabinets) to flag likely outages; use sky-presence classifier to filter oblique shots that degrade ground coverage.
- Tools/products/workflows: network GIS overlays, alerting rules (threshold % flooded buffer), field work order queues.
- Dependencies/assumptions: accurate asset geodata; near-real-time imagery when river levels peak; correction for shadows/reflections in oblique views.
- Academia and R&D: benchmarking and curriculum for domain generalization and multi-task learning
- Use the global, recent dataset to study cross-continental generalization, continent-aware domain adaptation, multi-task training (classification + segmentation + VQA), and segmentation-guided VQA.
- Tools/products/workflows: public leaderboards and challenge tracks, course modules on disaster AI, reproducible baselines with standard splits.
- Dependencies/assumptions: stable dataset hosting; adherence to the provided 80/20 stratified split for comparability.
- Policy and planning: event documentation and after-action reviews
- Produce standardized, comparable flood extent layers and counts across 64 countries for post-event reporting and resilience planning; quantify differences by environment type (urban/peri-urban vs rural).
- Tools/products/workflows: geospatial annexes in AARs, policy briefs with comparable metrics, dashboards for multi-event comparisons.
- Dependencies/assumptions: dataset’s coverage may not include all local typologies; policymakers accept UAV optical evidence as part of the record.
- NGOs and citizen groups: community mapping and needs assessment support
- Guided workflows for volunteers to upload drone images and obtain flood masks and building counts to support relief coordination.
- Tools/products/workflows: lightweight web app with drag-and-drop inference, OSM-compatible exports of flood polygons.
- Dependencies/assumptions: connectivity for upload, privacy/ethics review, basic operator training to capture nadir-like imagery.
- Data quality and labeling operations: training materials and QA protocols
- Reuse the paper’s two-stage annotation protocol and guidelines (edge cases for reflections/shadows/sky horizon) to bootstrap internal labeling teams for new regions/events.
- Tools/products/workflows: Label Studio templates, inter-annotator agreement checklists, supervisor sign-off gates.
- Dependencies/assumptions: availability of skilled annotators; time budget per image (~50 minutes as a reference).
Long-Term Applications
- Global, multi-sensor flood intelligence platform (optical UAV + satellites + SAR)
- Fuse AIFloodSense-trained models with SAR-based systems (e.g., Sentinel-1) for all-weather, day-night coverage and continuous flood extent monitoring; continent classifier guides region-specific model ensembles.
- Tools/products/workflows: multi-branch inference pipelines (sensor-aware), spatiotemporal datacubes, uncertainty layers from Bayesian or ensemble models.
- Dependencies/assumptions: robust cross-sensor domain adaptation; sustained compute and data pipelines; access to commercial high-res data where needed.
- Edge AI on drones for autonomous flood reconnaissance
- Compress and distill segmentation models for real-time onboard inference to guide flight paths, focus on maximally informative passes, and autonomously count flooded buildings.
- Tools/products/workflows: TensorRT/ONNX edge deployments, UAV autopilot integration (MAVLink) for adaptive path planning, on-drone VQA voice/teletype summaries.
- Dependencies/assumptions: hardware acceleration on UAVs; power and thermal budgets; regulatory acceptance of autonomy.
- Multimodal VLM incident assistants for Emergency Operations Centers
- Integrate VQA with segmentation maps and metadata to generate structured situation reports (e.g., “X flooded buildings within AOI; dominant environment: urban; likely access routes impacted”) and answer ad hoc queries.
- Tools/products/workflows: MLLM copilots with GIS grounding, chain-of-thought safeguards, retrieval-augmented prompts with hydrologic context.
- Dependencies/assumptions: reducing hallucinations and improving numerical reasoning; governance for AI-generated decisions.
- Digital twins for climate resilience and urban planning
- Feed historic multi-event AIFloodSense-derived extents into hydrodynamic models and urban digital twins to stress-test drainage designs, zoning, and green infrastructure strategies by environment type.
- Tools/products/workflows: city-scale simulation pipelines, synthetic scenario generation for planning, KPIs tied to observed extents.
- Dependencies/assumptions: integration with hydrologic/2D inundation models; richer class ontologies (roads/bridges) for planning-grade detail.
- Insurance and finance: automated, auditable climate risk and ESG analytics
- Standardized, explainable flood impact layers across continents inform risk scoring, lending, and reinsurance treaties; VQA evidence snapshots enhance audit trails.
- Tools/products/workflows: explainability dashboards (saliency/attribution), longitudinal exposure analytics, underwriting copilots.
- Dependencies/assumptions: regulatory clarity on AI use; bias and fairness assessments across regions and settlement types.
- Utilities and energy: predictive outage and restoration optimization
- Couple flood segmentation with asset criticality models to predict outage cascades and optimize crew staging; expand labels to include roads and access routes for routing under inundation.
- Tools/products/workflows: restoration optimizers, what-if dashboards, integration with AMI/SCADA telemetry.
- Dependencies/assumptions: extended ontology beyond the current 4 classes; robust geocoding and asset condition priors.
- Standards and benchmarks for disaster AI
- Use AIFloodSense as a cornerstone to define evaluation suites for cross-regional generalization, segmentation-guided VQA, and counting metrics with continuous error measures.
- Tools/products/workflows: open evaluation servers, standardized metrics and task protocols, multi-institution challenges.
- Dependencies/assumptions: community adoption; periodic dataset refreshes to maintain temporal relevance.
- Education and workforce development in climate-tech AI
- Curricula and capstone projects on multi-task learning, active learning for disaster imagery, and ethical AI in crisis contexts using AIFloodSense as the core resource.
- Tools/products/workflows: hands-on labs, Kaggle-style competitions, instructor kits (data, baselines, rubrics).
- Dependencies/assumptions: stable hosting; clear licensing for educational reuse.
- Robotics for flood response (boats/UGVs/UAV swarms)
- Use segmentation outputs to plan safe traversal for ground/boat robots in flooded streets, identify landing/extraction zones, and coordinate multi-platform sensing.
- Tools/products/workflows: SLAM with flood-aware cost maps, multi-agent coordination, cross-view calibration (oblique/nadir).
- Dependencies/assumptions: real-time perception stack; reliable comms in disaster zones; extended datasets with more classes and adverse conditions.
- Public communication and media verification
- Rapid, transparent visualization of flood extents and impacted structures to inform communities and counter misinformation; simple VQA queries to validate “is this flooded?” with geo-context.
- Tools/products/workflows: media briefing layers, public map portals with provenance, lightweight verification checklists.
- Dependencies/assumptions: clear uncertainty communication; safeguards against misuse or privacy violations.
Notes on feasibility and generalization:
- The current dataset size (470 images; 230 events across 64 countries) is excellent for benchmarking but may require augmentation, transfer learning, or weak supervision for production-grade robustness.
- Optical aerial imagery limits performance under night/poor-visibility conditions; for operational continuity, integration with SAR and thermal imagery is recommended.
- The 4-class segmentation ontology is operationally useful but may need expansion (e.g., roads, vegetation, vehicles, bridges) for certain sectors.
- VQA counting performance is sensitive to oblique views, occlusions, and crowded scenes; quality improves with nadir-like captures and annotator-calibrated priors.
- Ethical, legal, and regulatory constraints (airspace, privacy, data protection) must be addressed in all deployments.
Glossary
- Aerial imagery: Overhead images captured from UAVs, satellites, or aircraft used for spatial analysis and monitoring. "Aerial imagery, captured through Unmanned Aerial Vehicles (UAVs), satellites, or other remote sensing technologies, has proven invaluable for flood monitoring and management."
- Attentive Decoder Network (ADNet): A segmentation architecture that uses attention mechanisms in the decoder to improve feature selection and performance. "Specialized architectures, such as the multiscale Attentive Decoder Network (ADNet), have outperformed threshold-based baselines on Sentinel-1 data by leveraging co-polarization and cross-polarization inputs"
- Atrous separable convolutions: Efficient convolutions that use dilation (atrous) and depthwise separable operations to expand receptive fields with fewer parameters. "enhanced ENet with atrous separable convolutions"
- Bayesian CNNs: Convolutional neural networks that model uncertainty by placing distributions over parameters and estimating posterior variance. "Bayesian CNNs have been proposed to estimate the posterior distribution of model parameters, quantifying the prediction variance"
- Bilinear pooling: A feature fusion technique that computes pairwise interactions between two feature vectors for fine-grained representation. "with bilinear pooling used for fine-grained fusion."
- Bitemporal Image Transformers (BiT): Transformer models designed to compare two temporal images for change detection tasks. "Bitemporal Image Transformers (BiT) excel in change detection tasks"
- Bio-inspired meta-heuristics: Optimization algorithms inspired by natural processes (e.g., swarm intelligence) used to tune model features or parameters. "integrated Swin Transformers with bio-inspired meta-heuristics."
- Chain-of-Thought prompting: An LLM prompting strategy that elicits step-by-step reasoning to improve accuracy and reduce hallucination. "follows a Chain-of-Thought prompting to reduce hallucinations and enhance reasoning accuracy in post-flood damage assessment."
- Co-polarization: SAR imaging mode where transmitted and received waves have the same polarization; useful for distinguishing surface properties. "leveraging co-polarization and cross-polarization inputs"
- Cross-modal transformer: A transformer architecture that aligns and fuses features from different modalities (e.g., vision and language). "combines them with BERT-encoded questions via a cross-modal transformer"
- Cross-polarization: SAR imaging mode where transmitted and received waves have different polarizations; enhances contrast in certain features. "leveraging co-polarization and cross-polarization inputs"
- Densely connected feature aggregation module (DCFAM): A module that aggregates multi-scale features through dense connections to improve context capture. "the Swin Transformer with a densely connected feature aggregation module (DCFAM) improves context capture"
- Domain shift: A change in data distribution between training and deployment domains that degrades model performance. "particularly under domain shifts or limited supervision."
- Edge-computing: Performing computation near data sources (e.g., on UAVs) to enable real-time, low-latency inference. "edge-computing pipelines facilitating real-time inference directly on UAV platforms"
- Explainable AI (XAI): Methods that make AI decisions interpretable to humans, improving trust and accountability. "combining robust deep learning with Explainable AI (XAI), ensuring that high-performance automated assessments remain interpretable and trustworthy in critical post-flood scenarios."
- Foundation Models: Large pre-trained models adaptable to many downstream tasks with limited additional data. "the field has moved toward Foundation Models and Generalizable Transformers to address label scarcity in new disaster events."
- Geomorphic features: Terrain and landform characteristics used as inputs to models to improve segmentation or classification. "U-Net variants that incorporate geomorphic features and MobileNet-V3 backbones have proven to be effective for three-class classification (flood, permanent water, background) in Sentinel-1 imagery"
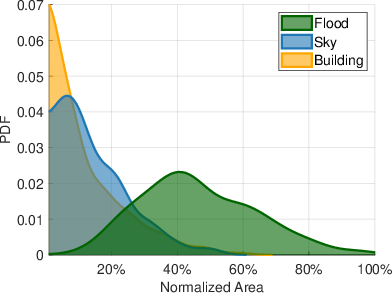
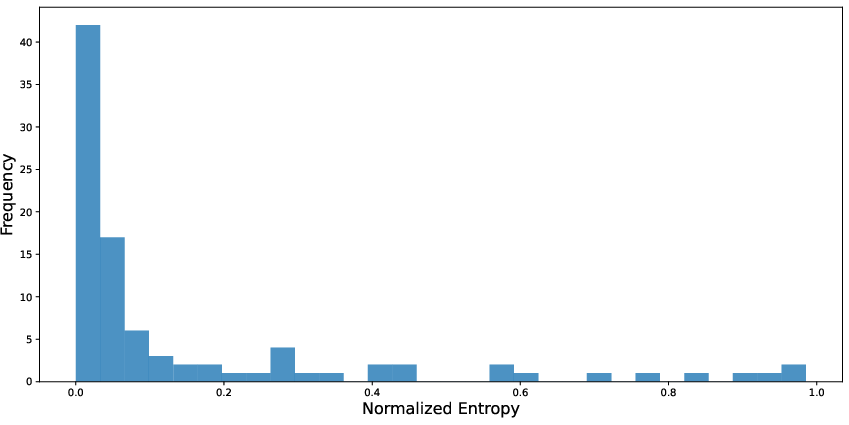
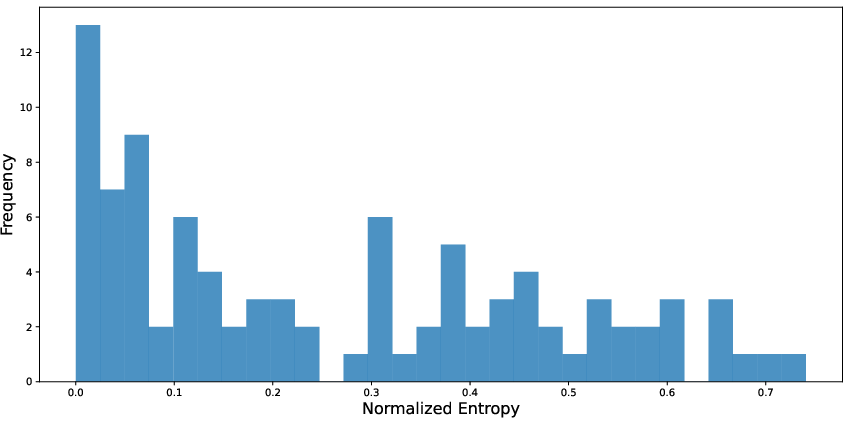
- Kernel density estimation: A non-parametric method to estimate the probability density function of a variable from data. "characterized via kernel density estimation in Figure~\ref{fig:kdesegmlabels}."
- LLMs: Neural models trained on vast text corpora to perform complex language understanding and generation. "More recently, the field has shifted toward LLMs and Multimodal LLMs (MLLMs) to support open-ended and grounded reasoning."
- Markov Random Fields (MRF): Probabilistic graphical models that encode local dependencies for tasks like image labeling via energy minimization. "unsupervised graph-based methods utilizing Markov Random Fields (MRF) for energy minimization"
- Mamba (State Space Models): Sequence modeling architectures based on state-space formulations, enabling efficient long-range dependencies. "novel State Space Models (Mamba)"
- Mutual-attention mechanism: A bi-directional attention scheme where visual features guide text attention and text guides visual attention. "introduced a mutual-attention mechanism in which image features guide question-word attention and vice versa, with bilinear pooling used for fine-grained fusion."
- Nadir views: Images captured with sensors pointing directly downward, minimizing perspective distortion. "underscoring the importance of filtering non-nadir views to improve the robustness of automated monitoring pipelines."
- Posterior distribution: The probability distribution of model parameters after observing data, central in Bayesian inference. "estimate the posterior distribution of model parameters"
- Pseudo-annotations: Automatically generated labels used in place of manual annotations to train or evaluate models. "without introducing confounding factors from synthetic data or pseudo-annotations."
- Pseudo-labels: Labels produced by a model or heuristic to supervise training when ground truth is unavailable. "leverages the Segment Anything Model (SAM) to generate pseudo-labels for unsupervised domain adaptation"
- Remote Sensing VQA (RS-VQA): Visual question answering tailored to remote sensing imagery and tasks. "The landscape of Remote Sensing VQA (RS-VQA) datasets and methods has expanded considerably"
- SAR: Synthetic Aperture Radar; active microwave imaging that captures surface properties regardless of illumination or weather. "Satellite SAR data from Sentinel-1 and Sentinel-2 are frequently used in flood water and permanent water segmentation tasks."
- Segment Anything Model (SAM): A general-purpose segmentation model that can segment objects with minimal prompting. "leverages the Segment Anything Model (SAM) to generate pseudo-labels for unsupervised domain adaptation"
- Semantic segmentation: Pixel-level classification assigning each pixel to a semantic class (e.g., flood, building). "(ii) Semantic Segmentation providing precise pixel-level masks for flood, sky, and buildings;"
- Segmentation-guided attention: An attention mechanism that uses segmentation masks to focus reasoning on relevant regions. "incorporated segmentation-guided attention, injecting segmentation masks into the reasoning process to prioritize spatially relevant regions."
- Siamese U-Net: A dual-branch U-Net architecture (often pre/post-event) that compares images for change or damage assessment. "employ a symmetric hierarchical Transformer within a Siamese U-Net architecture"
- Stratified split: A dataset partitioning method that preserves class or attribute distributions across train/test subsets. "using an 80/20 stratified split."
- Swin Transformer: A hierarchical vision transformer using shifted windows for efficient, scalable image modeling. "the Swin Transformer with a densely connected feature aggregation module (DCFAM) improves context capture"
- Teacher-student models: Semi-supervised learning setups where a teacher network guides a student network with soft or pseudo-labels. "semi-supervised teacher-student models \cite{savitha2025}"
- Uncertainty offset analysis: A technique to account for label ambiguity by adjusting predictions based on estimated uncertainty. "addressed label ambiguity in semi-supervised data via uncertainty offset analysis"
- Unsupervised domain adaptation: Transferring models to new domains without target labels by aligning distributions or leveraging pseudo-labels. "to generate pseudo-labels for unsupervised domain adaptation"
- Vision-LLM (VLM): Models that jointly process images and text to answer questions or generate descriptions. "we posed these five questions to a VLM (Llama3.2~\cite{grattafiori2024llama}), which generated responses for each image."
- Visual Question Answering (VQA): Tasks where a model answers natural-language questions based on image content. "Visual Question Answering (VQA) to enable natural language reasoning for disaster assessment."
Collections
Sign up for free to add this paper to one or more collections.