See Less, See Right: Bi-directional Perceptual Shaping For Multimodal Reasoning
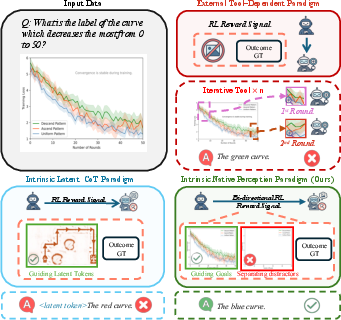
Abstract: Large vision-LLMs (VLMs) often benefit from intermediate visual cues, either injected via external tools or generated as latent visual tokens during reasoning, but these mechanisms still overlook fine-grained visual evidence (e.g., polylines in charts), generalize poorly across domains, and incur high inference-time cost. In this paper, we propose Bi-directional Perceptual Shaping (BiPS), which transforms question-conditioned masked views into bidirectional where-to-look signals that shape perception during training. BiPS first applies a KL-consistency constraint between the original image and an evidence-preserving view that keeps only question-relevant regions, encouraging coarse but complete coverage of supporting pixels. It then applies a KL-separation constraint between the original and an evidence-ablated view where critical pixels are masked so the image no longer supports the original answer, discouraging text-only shortcuts (i.e., answering from text alone) and enforcing fine-grained visual reliance. Across eight benchmarks, BiPS boosts Qwen2.5-VL-7B by 8.2% on average and shows strong out-of-domain generalization to unseen datasets and image types.

Paper Prompts
Sign up for free to create and run prompts on this paper using GPT-5.
Top Community Prompts
Explain it Like I'm 14
Overview
This paper introduces a new way to train AI models that look at pictures and answer questions about them (called vision–LLMs, or VLMs). The idea is simple: help the model learn where to look in an image by showing it two special versions of the picture—one that keeps only the parts that matter and one that removes those parts. The method is called Bi-directional Perceptual Shaping (BiPS), and it helps the model “see less” but “see right,” so its answers are based on the correct visual evidence.
What questions did the researchers ask?
The paper asks:
- How can we teach AI models to pay attention to the exact parts of an image that matter for a question (like thin lines or small symbols in charts), instead of guessing from text or big, simple shapes?
- Can we train models using strong visual hints during training so they don’t need extra tools or steps during real use?
- Will this approach work well not just on charts but also on other kinds of images and question types?
How did they do it? (Methods)
The researchers created a training strategy that gives the model smart “views” of the image based on the question:
- Evidence-preserving view: a version of the image that keeps only the pieces needed to answer the question (like just the relevant curve in a chart).
- Evidence-ablated view: a version of the image where the key evidence is removed, so the image no longer supports the original answer.
They use these views to shape the model’s behavior in two steps:
Turning “helper views” into training signals
Instead of using boxes or masks while the model is answering questions (which can be slow and miss fine details), they generate perfect training views and use them to teach the model what to rely on. During training only:
- The model is pulled toward giving answers that match the evidence-preserving view (so it focuses on the right content).
- The model is pushed away from giving answers that match the evidence-ablated view (so it won’t rely on text or shortcuts).
Think of it like practicing with two versions of a homework problem: one with the key hints highlighted and one with the hints erased, so you learn exactly which clues matter.
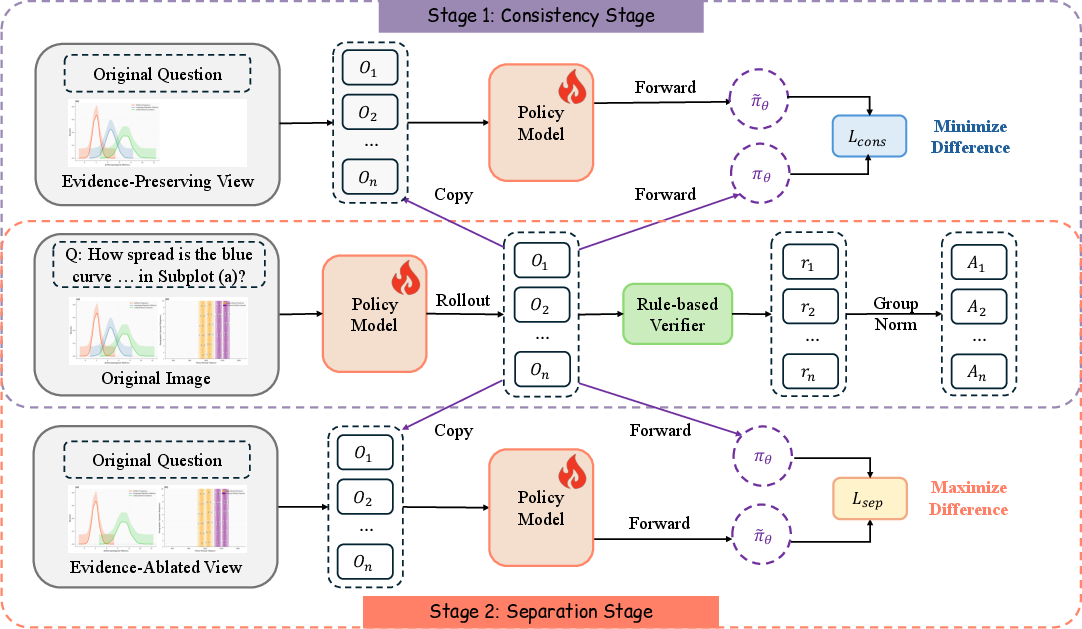
Two training steps: consistency and separation
- Consistency step: The model’s predictions on the full image should be similar to its predictions on the “important parts only” view. This teaches “look here.”
- Separation step: The model’s predictions on the full image should be different from its predictions on the “important parts removed” view. This teaches “don’t ignore the picture.”
To measure “similar” or “different,” they use a tool called KL divergence. You can think of it like a score for how far two sets of guesses are from each other—the lower the score, the more similar; the higher the score, the more different.
They train this inside a safe optimization setup called GRPO (Group Relative Policy Optimization), which is a reinforcement learning method that improves the model step by step with rewards while keeping changes stable.
Where did the training data come from?
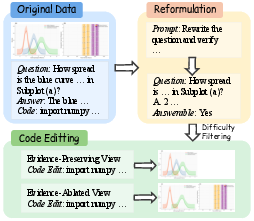
They needed very precise training views, especially for charts (which have fine lines, layered marks, axes, legends, etc.). So they:
- Used a dataset of computer-generated charts paired with the code that draws them.
- Programmatically edited the chart code to create exact evidence-preserving and evidence-ablated views—no human labeling needed.
- Built 13,000 high-quality training examples this way.
- Later added 39,000 math-related samples to further boost general reasoning.
What did they find?
- Strong improvements: On eight different benchmarks, their method boosted the base model (Qwen2.5-VL-7B) by about 7–8% on average.
- Better generalization: Training only on charts helped not just with charts (like CharXiv, ChartQAPro, and Evochart) but also with general visual reasoning tasks (like MathVista and MMStar).
- Data efficiency: With just 13,000 chart examples, they beat or matched models trained on hundreds of thousands or even millions of samples.
- No extra steps at test time: Because the “where to look” learning happens during training, the model doesn’t need special tools or extra images when answering questions later. It’s faster and less error-prone.
Some example numbers:
- Average improvement: +7.3% using only chart-based training, and up to +8.2% after adding math-focused data.
- Big gains on specific tasks (e.g., Evochart saw a jump of over +16 points).
Why it matters
- More reliable answers: The model learns to ground its reasoning in the right visual evidence, avoiding guesswork or “text-only shortcuts.”
- Handles fine details: It can catch thin lines, small symbols, and irregular shapes that simple boxes or crops often miss.
- Works across domains: Even though training was chart-based, the method helped on other image-and-question tasks—showing strong generalization.
- Faster in real use: No extra visual steps or tools are needed at inference time, which saves time and reduces errors.
Simple takeaway
BiPS teaches models where to look by training them with two smart versions of each image: one that keeps the important parts and one that removes them. This two-step “pull toward the right evidence, push away from wrong shortcuts” approach makes the model more accurate, more trustworthy, and more efficient—without needing extra help when it’s actually answering questions.
Knowledge Gaps
Knowledge gaps, limitations, and open questions
Below is a concise list of what remains missing, uncertain, or unexplored in the paper, formulated to guide future research.
- Domain generalization of paired-view construction:
- The method relies on programmatic chart code to create evidence-preserving () and evidence-ablated () views. It remains unclear how to generate semantically faithful paired views for natural images, documents, diagrams, medical images, videos, or multi-image tasks where executable renderers are unavailable.
- Fidelity of evidence ablation:
- The paper assumes “no longer supports the original answer,” but does not quantify how often ablation truly invalidates the answer (flip rate), whether residual cues leak, or how partial ablations affect learning. A systematic evaluation of counterpart correctness is missing.
- Reliability and bias in LLM-driven code editing:
- The pipeline uses an LLM arbitrator to reformulate questions and edit chart code. The robustness, error rate, and bias of these edits—and their downstream impact on training—are not measured. How failures (e.g., wrong removal, unintended side effects) propagate into the KL training remains unknown.
- Multiple-choice conversion effects:
- Reformulating open-ended questions into multiple-choice may change task difficulty and answer distributions. The paper does not examine whether performance gains transfer to free-form answering or to tasks without discrete options.
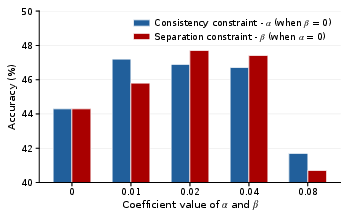
- Scope of sensitivity analysis:
- Hyperparameter sensitivity (e.g., , , , ) is only shown on CharXiv. Cross-benchmark and cross-domain robustness to these coefficients and clipping thresholds is untested.
- Training-time overhead and scalability:
- While inference involves no extra tools, the compute and wall-clock costs of generating and verifying / (LLM calls, code execution) are not reported. Scalability to larger datasets and more complex figures is an open question.
- Data scaling laws and sample efficiency:
- The method shows gains with 13K chart samples, but there is no systematic scaling analysis (more/less data, diversity of chart types) or characterization of diminishing returns.
- Generality across base architectures:
- BiPS is only evaluated on Qwen2.5-VL-7B. Whether the bidirectional KL shaping consistently benefits other VLMs (e.g., InternVL, LLaVA, GPT-4o-mini-like models) of varying sizes and vision backbones is not explored.
- Theoretical understanding of KL objectives:
- The paper provides empirical evidence for the coarse-to-fine curriculum but lacks a theoretical analysis of when forward-KL consistency and separation are optimal, how they interact with GRPO updates, and what failure modes (e.g., mode shrinkage or instability) can arise.
- Alternative divergences and formulations:
- Only forward KL is considered. The impact of reverse KL, symmetric KL, JS divergence, or contrastive objectives (e.g., InfoNCE) for consistency/separation is unstudied.
- Curriculum design space:
- The chosen two-stage schedule (consistency then separation) outperforms baselines, but the paper does not examine adaptive schedules (e.g., annealing /, alternation per batch/episode) or task-conditional curricula.
- Metrics for visual grounding:
- Improvements are shown on aggregate accuracy, but there are no direct grounding diagnostics (e.g., attention maps, saliency agreement with , answer robustness under controlled occlusions) to validate reduced text-only shortcuts or enhanced fine-grained perception.
- Error taxonomy and failure analysis:
- Beyond a small case study, there is no systematic analysis of error types (e.g., numerical misreadings, mislocalization, curve-following errors), nor measurement of hallucination rates under image perturbations or blanked inputs.
- Robustness to imperfect counterparts:
- The method beats random masking, but it does not test graded counterpart quality (noisy /, partial evidence removal) to assess tolerance to imperfect view generation.
- Transfer beyond charts:
- Although out-of-domain gains are reported on math/VO benchmarks, there is no evaluation on other structured image domains (documents, GUIs, floor plans) or natural scenes requiring irregular evidence localization (e.g., fine edges, textures).
- Multi-image and video reasoning:
- BiPS is designed for single-image inputs. How to construct paired views and apply bidirectional shaping to temporal or cross-image dependencies remains unexplored.
- Interaction with other learning paradigms:
- The paper pairs BiPS with GRPO; comparisons to DPO/MDPO, policy gradient variants, self-play, or supervised fine-tuning with counterpart-aware losses are absent.
- Calibration and confidence effects:
- The impact of consistency/separation on model calibration, uncertainty estimates, and abstention behavior (e.g., predicting “unanswerable” on ) is not measured.
- Annotation-free view generation at inference:
- While BiPS avoids test-time tools, an open question is whether learned internal policies can emit implicit evidence indicators (e.g., soft masks, attention heatmaps) that correlate with without explicit generation.
- Counterpart generation quality control:
- There is no automated verification pipeline (unit tests on code edits, render-time consistency checks, visual diffs) reported to guarantee that contains all necessary evidence and truly excludes it.
- Impact on reasoning vs. perception disentanglement:
- The method aims to improve perception, but whether reasoning chains or numerical manipulation steps become more reliable (e.g., fewer arithmetic slips) is not analyzed separately from perception gains.
- Benchmarks and coverage:
- ECD-Bench appears only in ablations; comprehensive inclusion and analysis across all reported benchmarks (with per-category breakdowns) is incomplete. No evaluation on OCR-heavy or text-dense charts is presented.
- Reproducibility and resource requirements:
- Full release status of the paired-view dataset, LLM prompts for code editing, and arbitrator configurations is unclear. Without these, reproducing the pipeline and its results may be challenging.
- Potential negative side effects:
- Separation could encourage changes in the answer distribution even when ablation preserves enough context to answer; the paper does not quantify any induced brittleness (e.g., increased sensitivity to minor visual perturbations) or trade-offs.
- Extension to continuous-valued outputs:
- Many chart tasks require precise numeric extraction; the paper reports accuracy but does not evaluate calibration of numeric predictions, tolerance to high-frequency curves, or value error distributions (e.g., RMSE/MAE on reading tasks).
- Handling ambiguous or multi-evidence questions:
- How BiPS deals with questions requiring multiple disjoint evidence regions (and how to construct / in such cases) is not specified or evaluated.
Practical Applications
Immediate Applications
Below are concrete, deployable use cases that can be built with the paper’s Bi-directional Perceptual Shaping (BiPS) method and data pipeline as-is or with minor adaptation. Each item includes sectors, potential tools/products/workflows, and key assumptions.
Industry
- Evidence-grounded analytics assistants for BI dashboards
- Sectors: software, finance, operations, marketing
- What: VLM copilots that answer questions about embedded charts in BI tools (e.g., “Which region had the steepest Q3 drop?”) while relying on fine-grained evidence (lines, intersections, small markers) and avoiding text-only shortcuts.
- Tools/products/workflows: BiPS training recipe integrated into model fine-tuning; “evidence-preserving vs. ablated” unit tests for model validation; plugin for Tableau/Power BI/Looker to expose chart QA.
- Assumptions/dependencies: Access to underlying chart specifications or exportable SVG/metadata for robust counterpart generation; compute for GRPO fine-tuning; base VLM license compatibility.
- Robust report QA and review bots for enterprises
- Sectors: finance, consulting, insurance, manufacturing
- What: Bots that validate claims in slide decks and PDF reports by cross-checking answers with evidence-preserving views and flagging any reliance on ablated views.
- Tools/products/workflows: “Evidence-grounded review” CI step; auditors’ dashboard showing divergence under ablation; red-team test suites based on KL separation thresholds.
- Assumptions/dependencies: Reliable PDF/figure parsing; permissioned access to internal reports; data privacy policies for model training/evaluation.
- Chart-heavy customer support and RPA
- Sectors: software, telecom, cloud operations
- What: Assistants that explain monitoring charts (incidents, latency spikes), summarize multi-panel figures, and trigger workflows when evidence meets criteria (e.g., threshold crossings).
- Tools/products/workflows: BiPS-fine-tuned models embedded into ticketing systems; alert explanation templates; automated “grounded summary” generators.
- Assumptions/dependencies: Availability of chart images or code; alignment of chart semantics with task prompts; stable model APIs.
- Evidence-grounded newsroom tools
- Sectors: media, journalism
- What: Plugins that produce “explain this chart” captions and quick fact checks against chart evidence to reduce misinterpretation in articles.
- Tools/products/workflows: CMS-integrated captioner with ablation-based reliability score; editorial QA checklist referencing divergence metrics.
- Assumptions/dependencies: Consent and licensing to process images; predictable chart templates (SVG preferred).
Academia
- Scientific figure QA and auto-captioning
- Sectors: academic publishing, research communication
- What: Tools that check if conclusions match figure evidence (multi-panel, thin curves), and generate grounded figure captions.
- Tools/products/workflows: LaTeX/Overleaf plugin; pre-submission figure QA; “evidence-ablation test” to flag potential over-claims.
- Assumptions/dependencies: Access to figure images or vector sources; variable figure styles; limited gold labels for evaluation.
- Benchmarking and training data synthesis for chart reasoning
- Sectors: ML research, data curation
- What: Use the paper’s programmatic code-editing pipeline to create preserve/ablate counterparts and MCQ conversions for new chart corpora, improving VLMs’ visual grounding.
- Tools/products/workflows: BiPS data generator; public challenge sets with paired views; evaluation harness reporting KL-consistency/separation metrics.
- Assumptions/dependencies: Executable chart code or structured provenance (e.g., Vega/Matplotlib); small LLM arbitrator for MCQ validation.
Policy and Governance
- Evidence-grounding compliance checks for model deployments
- Sectors: governance, risk, compliance
- What: Standardized “ablation robustness” tests in model validation reports to demonstrate reduced shortcut reliance and lower hallucination risk for chart-related tasks.
- Tools/products/workflows: Governance templates and checklists; dashboards showing divergence under ablated views; thresholds for acceptable evidence reliance.
- Assumptions/dependencies: Agreement on metrics and thresholds; reproducible test datasets; documentation of training regimen.
- Energy- and latency-conscious AI procurement
- Sectors: public sector IT, enterprise IT
- What: Favor solutions that internalize perception at training (no inference-time tool chains), reducing runtime overhead and energy use.
- Tools/products/workflows: Procurement criteria rewarding “no test-time tool” pipelines; cost–carbon reporting comparing tool-heavy vs. BiPS-like approaches.
- Assumptions/dependencies: Transparent vendor documentation; standardized energy measurement.
Daily Life
- “Explain my chart” assistants for personal use
- Sectors: consumer software, education
- What: Apps that interpret fitness, finance, or weather charts on-device/cloud, giving grounded answers like “Your steps peaked on Tuesday.”
- Tools/products/workflows: Mobile app feature using a BiPS-fine-tuned small VLM; optional “show evidence” overlay.
- Assumptions/dependencies: Consent to process images; variability of consumer chart styles.
- Homework and study helpers for math/physics with figures
- Sectors: education
- What: Tutors that read problem diagrams/charts and give grounded hints without hallucinating structure.
- Tools/products/workflows: LMS plugins; “evidence-preserving” mini-views as pedagogical aids.
- Assumptions/dependencies: School privacy constraints; need for stronger domain coverage beyond charts for some curricula.
Long-Term Applications
Below are higher-impact directions that require additional research, scaling, or domain-specific data/programmatic view generation pipelines.
Industry
- Multi-domain document intelligence with fine-grained grounding
- Sectors: legal, pharma, energy, manufacturing
- What: End-to-end systems that parse diverse technical figures (process diagrams, CAD schematics, geo maps) and answer grounded questions for audits, safety, and operations.
- Tools/products/workflows: Domain-specific preserve/ablate generators built from source artifacts (CAD, GIS layers); cross-modal provenance tracing.
- Assumptions/dependencies: Access to structured source layers (CAD/GIS/diagram objects) rather than raw pixels; robust parsing; custom data agreements.
- Financial risk and compliance analytics over complex figures
- Sectors: finance, fintech, audit
- What: Evidence-grounded analysis of prospectuses and regulatory filings that contain intricate charts, automatically surfacing discrepancies and supporting/contradicting evidence.
- Tools/products/workflows: Filing ingestors; ediscovery-like search with ablation divergence scoring; auditor co-pilots.
- Assumptions/dependencies: High-fidelity vector extraction; reliable OCR/structure alignment; regulatory acceptance of evaluation methodology.
Healthcare and Scientific Imaging
- Medical imaging assistants with fine structure grounding
- Sectors: healthcare, medical devices
- What: Extend BiPS-style shaping to enforce reliance on lesion contours and subtle structures (e.g., microcalcifications), reducing text-only bias in report generation and QA.
- Tools/products/workflows: Programmatic preserve/ablate view generation via segmentation masks; radiology report copilot with “show supporting pixels.”
- Assumptions/dependencies: High-quality, expert-validated masks; regulatory approval; domain-shift mitigation beyond charts.
- Laboratory automation and instrument UIs
- Sectors: life sciences, materials science
- What: Grounded reasoning over plots from instruments (chromatograms, spectra) for anomaly detection and parameter recommendation.
- Tools/products/workflows: Instrument SDKs exposing peak/line provenance to synthesize counterparts; lab assistant copilots.
- Assumptions/dependencies: Vendor cooperation for provenance access; rigorous validation on real data.
Robotics and Autonomy
- Perception shaping for safety-critical HMI and dashboards
- Sectors: automotive, aviation, industrial robotics
- What: Assistants that interpret multi-panel telemetry displays and issue grounded, evidence-based alerts, minimizing shortcut-induced false alarms.
- Tools/products/workflows: Simulator-based counterpart synthesis; ablation stress-tests; runtime “evidence required” gating for alerts.
- Assumptions/dependencies: Realistic simulators; certification processes; failure mode analysis.
- On-robot grounded visual reasoning with structured overlays
- Sectors: robotics
- What: Extend bidirectional shaping to environments where overlays/annotations (maps, trajectories) can be programmatically preserved/ablated for training robust policies.
- Tools/products/workflows: Training pipelines coupling sensor data with programmatic masks; GRPO variants tuned for embodied settings.
- Assumptions/dependencies: Accurate environment labels; sim-to-real transfer; compute budget on-device or edge.
Education and Accessibility
- Universal figure accessibility with verifiable grounding
- Sectors: accessibility tech, education
- What: Auto-generate alt text and interactive explanations for complex figures across textbooks and the web, with ablation-backed evidence confidence.
- Tools/products/workflows: Browser and e-reader extensions; “confidence under ablation” scores exposed to users.
- Assumptions/dependencies: Diverse figure formats; fairness evaluation; multilingual support.
Policy and Standards
- Evidence-grounded AI evaluation standards
- Sectors: standardization bodies, regulators
- What: Formalize “evidence-preserving consistency” and “evidence-ablated separation” as audit metrics for multimodal models used in high-stakes settings.
- Tools/products/workflows: Reference datasets with paired counterparts; guidance docs; certification checklists and thresholds.
- Assumptions/dependencies: Cross-stakeholder consensus; reproducibility; avoiding perverse incentives (e.g., overfitting to ablation styles).
- Provenance-first figure ecosystems
- Sectors: publishing, software tooling
- What: Encourage publishing pipelines to retain executable/chart provenance (e.g., Vega/Matplotlib notebooks) to enable programmatic counterpart synthesis for trustworthy AI assistants.
- Tools/products/workflows: “Provenance-required” submission policies; repositories storing code + figure; viewer apps supporting evidence overlays.
- Assumptions/dependencies: Cultural and workflow changes; IP/privacy concerns; tooling maturity.
Cross-Cutting Tools That Could Emerge
- BiPS Trainer SDK
- What: Open-source library to add consistency/separation KL terms to GRPO/PPO pipelines, plus utilities for ablation-based evaluation.
- Assumptions/dependencies: Stable RL training infra; base model access.
- Counterpart Synthesizer Suite
- What: Adapters that generate evidence-preserving/ablated views from different sources: chart code (today), SVG layers, segmentation masks, CAD/GIS layers (future).
- Assumptions/dependencies: Domain-specific parsers and provenance.
- Grounding QA Dashboard
- What: Continuous evaluation with divergence-under-ablation metrics, stress tests, and failure analytics for MLOps.
- Assumptions/dependencies: Agreement on metrics; dataset curation.
Notes on feasibility and risk across applications:
- Domain transfer beyond charts requires structured provenance or high-quality masks to avoid brittle, coarse ablations.
- The LLM arbitrator used for question reformulation introduces a dependency; weak or biased arbitrators can degrade training signal.
- GRPO and KL terms require careful coefficient tuning to avoid destabilizing optimization; compute cost for training can be significant, though inference is efficient.
- Governance acceptance depends on transparent documentation of counterpart generation and evaluation protocols.
Glossary
- Ablation study: A controlled analysis that removes or varies components to measure their contribution to performance. "Ablation study on the components of BiPS."
- Arbitrator (LLM arbitrator): An auxiliary LLM used to reformulate, validate, and edit supervision signals or code. "we employ an auxiliary LLM arbitrator, GPT5-mini, to convert the original questions into a multiple-choice format."
- Bi-directional KL constraints: A pair of KL-based objectives that pull predictions toward an evidence-preserving view and push them away from an evidence-ablated view. "Our core methodology comprises two complementary KL constraints operating on the paired views constructed in Section~\ref{sec:data_construction}."
- Bi-directional Perceptual Shaping (BiPS): The proposed training-time framework that uses paired views to shape a model’s visual grounding via KL-based consistency and separation. "we propose Bi-directional Perceptual Shaping (BiPS), which transforms question-conditioned masked views into bidirectional where-to-look signals that shape perception during training."
- Coarse-to-fine training curriculum: A training schedule that first teaches broad evidence focus (consistency) and then enforces fine-grained grounding (separation). "This coarse-to-fine curriculum first applies the positive signal ($\mathcal{L}_{\text{cons}$) and then the regularizer ($\mathcal{L}_{\text{sep}$) to ensure the learned policy is both accurate and grounded."
- Evidence-ablated view: A modified image where critical visual evidence is removed so the original answer is no longer supported. "an evidence-ablated view where critical pixels are masked so the image no longer supports the original answer"
- Evidence-preserving view: A modified image that retains only the regions necessary to answer the question. "an evidence-preserving view that keeps only question-relevant regions"
- Executable reasoning: Reasoning that operates over code or programs which can be run to verify or derive answers. "convert charts into structured symbolic programs or code for executable reasoning"
- Executable rendering code: Source code that deterministically generates the chart images used for precise edits and supervision. "paired with executable rendering code."
- Explicit provenance: Metadata linking visual elements back to their source objects, enabling exact edits and traceability. "every object (marks, layers, axes, legends) has explicit provenance, which enables exact edits to synthesize the two complementary views."
- Group Relative Policy Optimization (GRPO): A PPO-style RL method that normalizes rewards within rollout groups to stabilize optimization. "Group Relative Policy Optimization (GRPO) framework"
- Group-relative advantage: An advantage estimate normalized within a rollout group for stable policy updates. "Here, denotes the group-relative advantage,"
- Kullback–Leibler (KL) divergence: A measure of dissimilarity between probability distributions used to enforce consistency or separation. "applies a consistency constraint based on the KullbackâLeibler (KL) divergence"
- KL-consistency constraint: A KL-based objective that aligns predictions on the full image with those on an evidence-preserving view. "applies a KL-consistency constraint between the original image and an evidence-preserving view"
- KL-separation constraint: A KL-based objective that forces predictions on the full image to diverge from those on an evidence-ablated view. "It then applies a KL-separation constraint between the original and an evidence-ablated view"
- Latent visual tokens: Internal visual representations produced during reasoning instead of explicit intermediate images or tools. "generated as latent visual tokens during reasoning"
- Out-of-domain generalization (OOD): The ability to transfer to unseen datasets or image types beyond the training distribution. "shows strong out-of-domain generalization to unseen datasets and image types."
- Programmatic code-editing: Automated modification of chart-generating code to create precise preserved/ablated views. "We compare our programmatic code-editing strategy against a random masking baseline."
- Programmatic data pipeline: An automated process that constructs paired supervision by editing and rendering charts from code. "We therefore build a programmatic data pipeline for chart data that generates the required evidence-preserving and evidence-ablated views."
- Proximal Policy Optimization (PPO): A popular on-policy RL algorithm using clipped objective updates; GRPO extends it. "extends Proximal Policy Optimization (PPO) by normalizing rewards across rollouts within the same group"
- Random masking: A baseline that hides random image patches to create alternative inputs for training or evaluation. "a random masking baseline"
- Reinforcement Learning from Verifiable Rewards (RLVR): An RL setup where rewards are programmatically checkable to ensure correctness. "Following a typical RLVR setting~\cite{shao2024grpo,meng2025mmeureka}, we refine this data"
- Rollouts: Multiple sampled trajectories (model attempts) used to estimate advantages and stabilize RL training. "We perform 8 rollouts for each validated question."
- Stop-gradient: An operation that prevents gradient flow through a computation branch so it serves as a fixed target. " indicates stop-gradient so that the $I_{\text{pres}$ branch serves as a fixed target;"
- Text-only shortcuts: Failure modes where the model answers from text priors without using visual evidence. "discouraging text-only shortcuts (i.e., answering from text alone)"
- Visual chain-of-thought: A training or inference process that uses intermediate visual steps (e.g., boxes, masks) analogous to textual CoT. "âvisual chain-of-thoughtââ traces"
- Visual hallucinations: Model outputs asserting unsupported visual content or interpretations. "to avoid visual hallucinations and text-only shortcuts"
- Vision–LLM (VLM): A model jointly processing visual and textual inputs for multimodal reasoning. "Large visionâLLMs (VLMs) are increasingly serving as a unified interface for both visual and language-based reasoning"
Collections
Sign up for free to add this paper to one or more collections.