ProfInfer: An eBPF-based Fine-Grained LLM Inference Profiler
Abstract: As LLMs move from research to production, understanding how inference engines behave in real time has become both essential and elusive. Unlike general-purpose engines such as ONNX Runtime, today's LLM inference systems offer little operator-level visibility, leaving developers blind to where time and resources go. Even basic questions -- is this workload memory-bound or compute-bound? -- often remain unanswered. To close this gap, we develop a fine-grained, non-intrusive profiling framework for modern LLM inference engines, exemplified by llama-cpp but applicable to similar runtime architectures. Built on extended Berkeley Packet Filter (eBPF) technology, our system dynamically attaches probes to runtime functions across multiple layers -- without modifying or recompiling the source. It transforms collected traces into rich visualizations of operators, graphs, timelines, and hardware counter trends, exposing how dense inference, Mixture-of-Experts routing, and operator offloading behave in practice. With less than 4% runtime overhead and high profiling fidelity, our framework makes LLM inference both transparent and diagnosable, turning performance profiling into a practical tool for optimization, scheduling, and resource-aware deployment.


Paper Prompts
Sign up for free to create and run prompts on this paper using GPT-5.
Top Community Prompts
Explain it Like I'm 14
A simple explanation of “ProfInfer: An eBPF-based Fine-Grained LLM Inference Profiler”
Overview: What is this paper about?
This paper introduces a tool called ProfInfer that helps engineers see, in detail, what’s happening inside LLMs while they are running. Think of it like putting tiny, smart “traffic cameras” into the LLM’s engine so you can watch which parts are busy, which parts are waiting, and where time and energy are being spent—without changing or slowing down the program much. The goal is to make LLMs faster and more efficient on devices like phones and small computers.
Objectives: What questions did the researchers want to answer?
The tool is designed to answer simple but important performance questions that are hard to measure today, such as:
- Which parts of the LLM take the most time?
- Is the model limited by computing (CPU/GPU doing math) or by memory (moving data around)?
- How do special features—like expert routing in Mixture-of-Experts (MoE) models, caching past tokens (KV-cache), and offloading work to GPUs/NPUs—actually behave on real devices?
- How do threads (the “workers” inside your CPU) get scheduled, and do they interfere with each other?
Methods: How did they build and use ProfInfer?
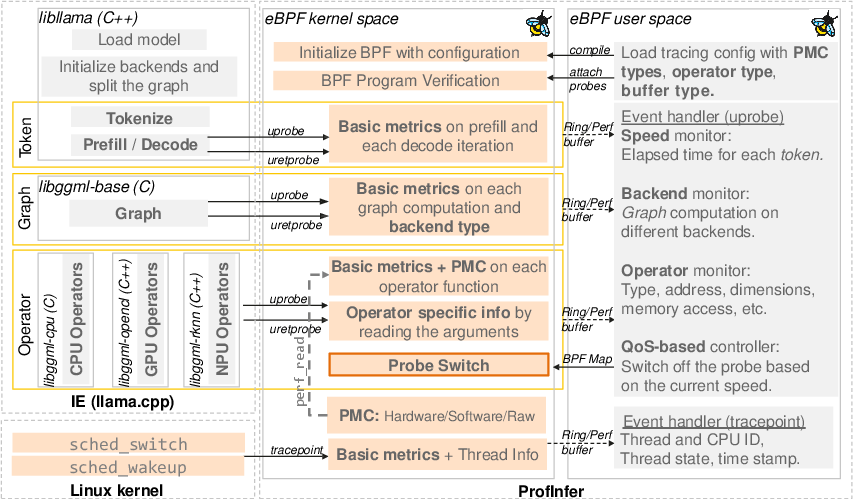
ProfInfer uses a technology called eBPF. Here’s what that means in everyday language:
- eBPF lets you attach tiny programs (probes) to running software and the operating system to watch events without changing the software itself. It’s like adding sensors to a car without opening the engine.
- These probes collect information whenever key functions are called (start and finish times, which thread ran them, which CPU core, etc.). They work at three levels:
- Token level: measuring the time to first token (TTFT) and the time per output token (TPOT).
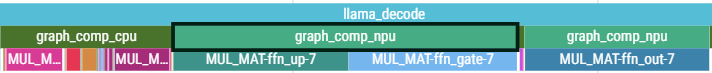
- Graph level: tracking chunks of work assigned to different backends (CPU, GPU, NPU).
- Operator level: timing specific operations like matrix multiplications, attention, softmax, and more.
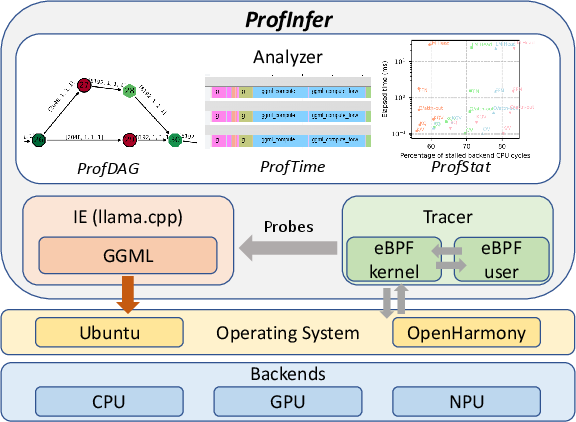
To make sense of the data, ProfInfer builds three clear views:
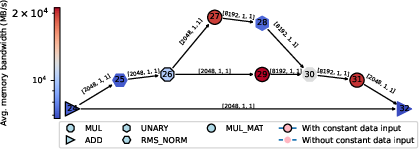
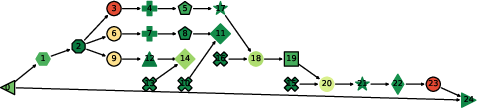
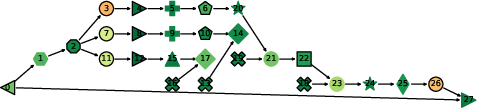
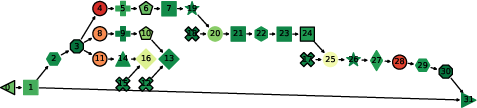
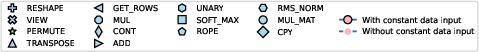
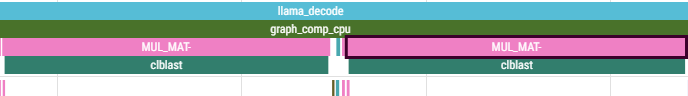
- ProfDAG view: a flowchart-like map (a directed acyclic graph) of all the operations, showing their order and how they connect.
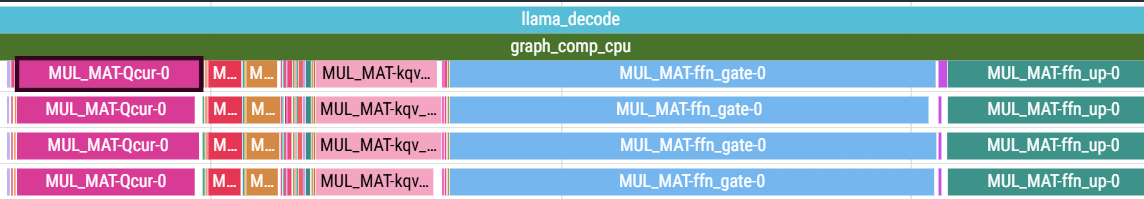
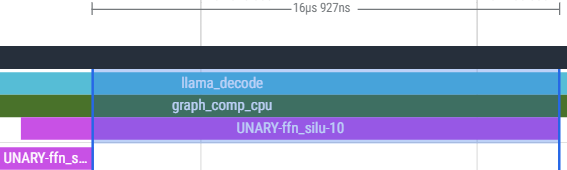
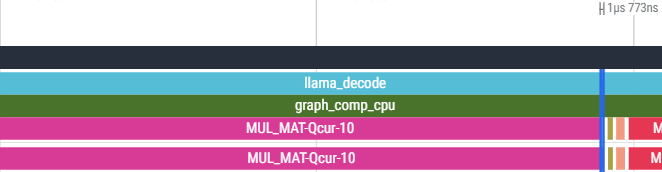
- ProfTime view: a timeline that looks like a movie of the model running—who did what, when, and on which CPU/GPU.
- ProfStat view: charts and stats showing trends across tokens, across operator types, and across experts (for MoE models).
It also reads hardware counters (PMCs), which are like tiny built-in sensors inside your CPU that count things such as:
- Cache refills (how often data had to be fetched from memory),
- Total CPU cycles,
- Stalled cycles (time the CPU waited for data),
- Memory accesses and page faults (when data has to be loaded from storage).
ProfInfer works with llama.cpp (a popular open-source LLM engine) and supports different backends (CPU, GPU, and a specific NPU), running on Linux-based systems. It uses existing eBPF toolkits (BCC and libbpf) and keeps overhead low (usually under 4%).
Findings: What did they discover and why does it matter?
Here are the main insights the tool revealed:
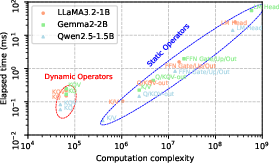
- Matrix multiplications dominate LLM work:
- During inference, especially decoding tokens, matrix multiplication (MatMul) operations take up most of the time—often more than 97% of the total.
- This makes them the prime target for optimization.
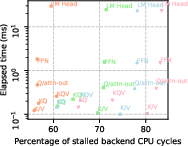
- Decoding is often memory-bound:
- Adding more CPU threads helps up to a point (often 2 threads), but then the system hits memory bandwidth limits. Past that, the CPU spends lots of time waiting for data (high stalled cycles), which wastes energy and doesn’t speed things up much.
- Prefill vs. decode behave differently:
- The prefill phase (processing your prompt before generating tokens) is usually compute-heavy. Using better math libraries (like BLIS) can make it much faster and reduce memory traffic.
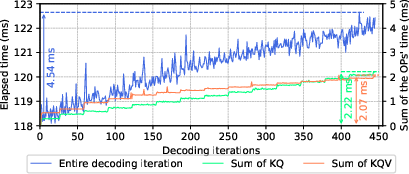
- The decode phase (generating one token at a time) becomes more memory-heavy as the context grows; operators like KQ and KQV get slower because they have to look back at more data.
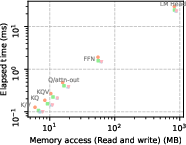
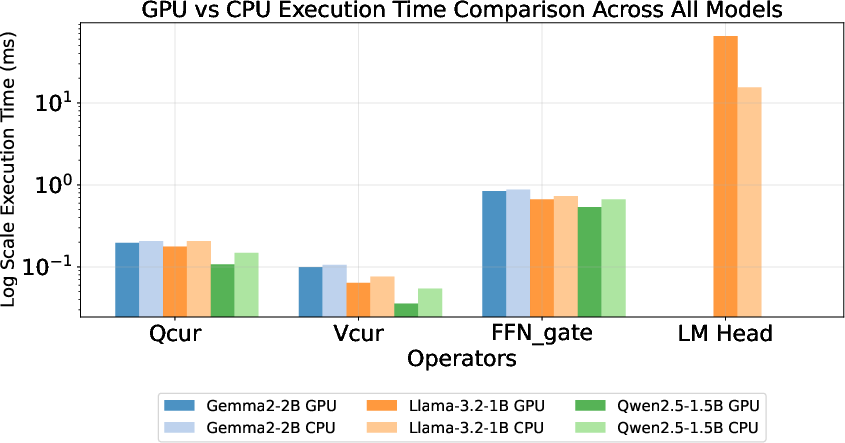
- Offloading to accelerators sometimes helps, sometimes doesn’t:
- Moving work to a GPU can be faster for certain matrix sizes, but not all. Very large layers, like the final “LM Head,” may run slower on GPU (or be unsupported) due to kernel or memory limits.
- Selectively offloading operators (based on their size) can improve speed—but blindly offloading everything may hurt performance.
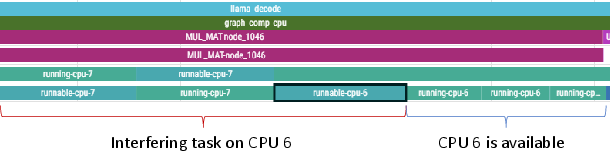
- Thread scheduling and interference matter:
- ProfInfer’s timeline shows how threads share CPU cores and when they get preempted. You can see if another high-priority task is delaying the LLM, and which operators are affected.
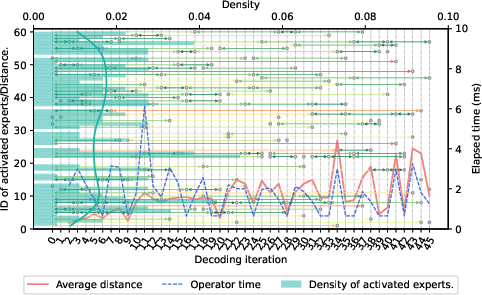
- MoE models cause dynamic effects:
- In Mixture-of-Experts models, different experts are activated per token. If an expert’s weights aren’t already in RAM, the system must fetch them from storage, slowing things down. ProfInfer can track which experts were used and how that affected time.
- Low overhead and high visibility:
- Compared to some existing profilers, ProfInfer adds little overhead (about 1.7%–4% slowdown), but gives much deeper insight without redeploying or recompiling the model.
Implications: Why is this useful and what could it lead to?
ProfInfer makes running LLMs on phones, small PCs, and edge devices more understandable and tunable. With this kind of visibility, developers can:
- Pick the right number of threads to avoid memory bottlenecks.
- Decide which parts to offload to a GPU/NPU for best speed.
- Reduce interference from other apps by scheduling smarter.
- Understand why certain tokens are slower and fix those bottlenecks.
- Tune models and engines for better battery life, lower heat, and faster responses.
In short, ProfInfer turns “guessing” into “knowing” when optimizing LLMs on resource-limited devices. This can lead to faster, more reliable, and more energy-efficient AI experiences—like chats that feel instant, translations that run offline, and tutors that work smoothly on your phone.
Knowledge Gaps
Knowledge gaps, limitations, and open questions
Below is a focused list of what remains missing, uncertain, or unexplored in the paper, framed to guide future work.
- Portability beyond llama.cpp: The approach is tightly coupled to llama.cpp internals (e.g., ggml function names/structs) and may break with version changes or fused kernels; there is no evidence of generalization to other inference engines (e.g., vLLM, mlc-LLM, MNN-LLM, TensorRT-LLM, Triton) or to dynamic-graph runtimes.
- Backend coverage and heterogeneity: Profiling support is limited to CPU, OpenCL/CLBlast, and a custom Rockchip NPU backend; there is no end-to-end coverage for CUDA, ROCm, Vulkan, Metal, NNAPI, Core ML, Hexagon/HTP, or vendor-specific GPU/TPU/NPU stacks.
- GPU/NPU hardware-counter integration: The framework does not integrate vendor GPU/NPU PMUs (e.g., Mali, Adreno, CUDA CUPTI, ROCm SMI); current GPU observability relies on enabling built-in OpenCL profiling, undermining the “non-intrusive” claim and limiting metric richness (e.g., cache misses, memory stalls, SM occupancy).
- PMC portability and validity: The PMC methodology (e.g., using Cortex-A76 l3d_cache_refill as 64 B per refill) is architecture-specific and unvalidated across other microarchitectures; there is no calibration against microbenchmarks or ground-truth bandwidth meters, nor handling for non-inclusive caches, prefetchers, writebacks, and cross-core effects.
- Fidelity vs. overhead quantification: While overhead is measured, the paper does not quantify data loss rates for ring buffers under high load, nor provide systematic fidelity/overhead trade-off curves across models, thread counts, and backends.
- Accuracy validation: Operator and graph-level timings are not cross-validated against ground-truth timers or built-in profilers across backends; error bounds and synchronization uncertainties (e.g., asynchronous GPUs, queues) remain uncharacterized.
- Asynchronous execution correlation: Mapping user-space operator semantics to asynchronous GPU command queues/kernels is ad hoc (dependent on OpenCL profiling) with no general strategy for correlating overlapping kernels, multiple queues, or out-of-order execution.
- Dynamic workloads and features: The profiler’s robustness for speculative decoding, beam search, streaming, multi-query attention, flash attention, quantization-aware fusions, and dynamic pruning (e.g., PowerInfer) is unclear; semantic mapping for fused or backend-specialized ops is not addressed.
- DAG reconstruction robustness: ProfDAG construction depends on one thread’s event order and pointer-based tensor traversal; concurrency, operator fusion, and backend-specific execution reordering may yield incorrect or incomplete DAGs without consistency checks.
- Multi-tenant attribution: Interference detection is demonstrated, but there is no attribution of cross-process/multi-model contention to specific shared resources (e.g., memory bandwidth, LLC, storage I/O) or per-tenant fairness metrics; no mechanisms for concurrent session disambiguation at the operator level.
- Storage I/O and paging quantification: Major-fault counts are collected but not translated into actual I/O volume, bandwidth, or latency; minor faults, page-cache hits, and mmap behavior (especially for MoE expert fetches) are not quantified or correlated with operator slowdowns.
- Thermal, DVFS, and energy: The impact of thermal throttling, DVFS state transitions, and power/energy usage on observed performance is not measured; no integration with power/thermal sensors or counters to explain variance.
- Scheduling insights to actions: Thread-level imbalance and interference are observed, but the framework does not provide actionable scheduling guidance (e.g., affinity tuning, work partitioning, thread-count selection) or automatic diagnosis-to-recommendation pipelines.
- Online adaptivity and QoS control: The runtime QoS-driven probe toggling is not rigorously evaluated (control algorithm, stability, detection delay, data completeness impact) and does not close the loop to adaptive resource allocation or scheduling policies.
- Production deployability constraints: eBPF typically requires elevated privileges (CAP_BPF/CAP_SYS_ADMIN); the paper does not discuss deployment feasibility on stock Android/iOS or locked devices, sandboxing, or security implications.
- Cross-platform support: Although eBPF exists on Linux/macOS/Windows, the implementation targets Ubuntu/OpenHarmony; there is no validation on mainstream Android distributions, iOS, x86 servers, Apple silicon, or diverse ARM cores.
- Memory allocator and KV-cache visibility: Memory allocator behavior (malloc/free, arenas), KV-cache placement/migration, fragmentation, and NUMA characteristics are not traced; KV-cache growth effects are observed but not decomposed into compute vs. memory vs. allocator overheads.
- Model scale and context length: Evaluations use small-to-mid models and modest contexts; prefill behavior for long prompts and large models (e.g., >7B, extended context windows) is not analyzed, nor is scaling across batch >1 or multi-sequence schedulers.
- Operator offloading policy: The selective offload insight (dimension-dependent) lacks a generalized, backend-agnostic cost model that accounts for compute, memory bandwidth, and transfer overheads; no automated decision rules or validation across devices/vendors.
- Event-symbol stability and resilience: Reliance on specific symbol names and struct layouts (e.g., ggml_tensor fields) risks brittleness across compiler flags (LTO/inlining), versions, or forks; strategies for dynamic discovery, symbol resolution, or fallback tracing are not presented.
- Data volume, storage, and privacy: Logging granularity, storage overhead, data retention policies, and privacy issues (e.g., tensor addresses, model internals) are not discussed; there is no compression or streaming design to bound footprint on constrained devices.
- Real-time analytics: Analyses are largely offline; there is no low-latency, in-situ visualization or alerting pipeline suitable for online diagnosis, nor incremental aggregation for long-running sessions.
- Automated bottleneck diagnosis: The system provides visualizations but no automated root-cause analysis (e.g., memory-bound vs compute-bound per operator/phase) or prescriptive optimization recommendations.
- Statistical rigor: Results lack repeated trials and variance/error bars; reproducibility under varying system states (background load, DVFS, thermal) is not established.
- Extensibility to non-LLM workloads: It is unclear how the approach adapts to other sequence models (e.g., RNN-T, diffusion, vision transformers) or mixed-modality pipelines (e.g., audio+LLM, MLLM with vision encoders).
- Limits of perf-event scaling: Opening per-thread perf events may hit system limits or induce overheads with many threads/processes; scalability limits and fallback strategies are not evaluated.
- Visualization limitations: Perfetto-based timelines are powerful but can be unwieldy at scale; there is no summarization or multi-resolution exploration support for large traces or multi-run comparisons.
- Validation on closed hardware stacks: Many mobile NPUs/ISPs are closed; how ProfInfer could observe such accelerators (without source changes or unsupported PMUs) is unresolved.
Practical Applications
Immediate Applications
Below is a concise set of practical, deployable applications that leverage ProfInfer’s findings, methods, and tooling. Each item includes likely sectors, example tools/workflows/products that could emerge, and feasibility notes.
- Operator-level performance tuning for on-device LLMs
- Sectors: software, mobile, edge/IoT, robotics
- What you can do now:
- Use ProfTime and ProfStat to identify compute- vs memory-bound phases (e.g., decode-stage GEMV hot spots), balance thread counts to reduce “stalled backend cycles,” and avoid bandwidth saturation.
- Apply ProfDAG to locate dominant MatMul nodes, check KV-cache effects (KQ/KQV growth), and confirm where optimization yields the highest impact.
- Emergent tools/workflows/products: “LLM Hotspot Hunter” scripts that propose thread counts per device/model; template dashboards overlaying TTFT/TPOT with PMCs; a VSCode extension surfacing operator bottlenecks.
- Dependencies/assumptions: Linux with eBPF, BCC or libbpf, access to attach uprobes (CAP_BPF/CAP_SYS_ADMIN), stable function symbols in llama.cpp, PMC availability/accuracy on the target SoC, small overhead budget (~2–4%).
- Backend selection and selective offloading rules
- Sectors: software, mobile, edge AI
- What you can do now:
- Use ProfTime’s multi-backend view (CPU/GPU/NPU) and operator-level timing to derive simple, dimension-based rules for when MatMul should run on CPU vs GPU vs NPU (as shown: GPU outperforms CPU only in certain size ranges; LM Head can regress on GPU).
- Turn on OpenCL profiling when needed; combine with ProfInfer traces for kernel-level visibility.
- Emergent tools/workflows/products: a runtime “Offload Advisor” that emits per-operator routing rules by tensor shape; a config pack for llama.cpp backends per device.
- Dependencies/assumptions: backend support in the engine (CPU, OpenCL/CLBlast, NPU), kernel/user-space drivers, profiling flags (e.g., GGML_OPENCL_PROFILING), stable queue semantics.
- Interference detection and QoS-preserving scheduling
- Sectors: software/SRE, robotics, telco edge
- What you can do now:
- Use scheduler tracepoints (sched_switch, sched_wakeup) to detect preemptions and thread starvation; correlate spikes in TPOT with CPU contention.
- Pin inference threads to specific cores, adjust priorities, or reduce tracing automatically when QoS degrades (as the paper’s adaptive tracer does).
- Emergent tools/workflows/products: “QoS Guardrail” sidecar that monitors TPOT/TTFT and applies cpuset/priority changes; edge node agents that surface interference incidents in Perfetto dashboards.
- Dependencies/assumptions: permission to read scheduler tracepoints; ability to change affinities and priorities; multi-tenant edge deployments.
- MoE expert activation diagnostics and caching hints
- Sectors: software, mobile, edge AI
- What you can do now:
- Trace expert IDs (top-k) per iteration and correlate outliers in operator latency to storage fetches (mmap major-faults) when experts aren’t in DRAM.
- Derive “expert reuse distance” and prefetch warmsets for frequently reused experts given device DRAM constraints.
- Emergent tools/workflows/products: an “Expert Prefetch Planner” generating per-model expert warmsets for constrained devices; model cards enriched with expert memory footprints.
- Dependencies/assumptions: MoE models routed via known operators (e.g., ggml_compute_forward_mul_mat_id), ability to parse ggml_tensors, mmap usage visibility, PMC for major-faults.
- CI/CD performance regression testing for LLM inference
- Sectors: software/ML systems, academia
- What you can do now:
- Integrate ProfInfer into pipelines to store ProfDAG/ProfTime snapshots; alert on TTFT/TPOT regressions, operator timing drift, or thread-imbalance anomalies.
- Emergent tools/workflows/products: “Perf Baseline” artifacts per commit; changelog entries tagging regressions to specific operators/backends.
- Dependencies/assumptions: stable test prompts and quantization; deterministic builds; artifact storage for traces; controlled hardware lab.
- Capacity planning and device SKU matching
- Sectors: device OEMs, system integrators, telco edge, retail kiosks
- What you can do now:
- Use PMCs (L3 refills, stalled cycles) and per-operator timelines to quantify bandwidth ceilings and pick thread counts that minimize resource waste.
- Predict decode throughput from model hyperparameters (given decode dominated by MatMul GEMV) to plan SLAs and concurrency.
- Emergent tools/workflows/products: device recommendation matrices for model sizes/quantizations; SLA calculators for TTFT/TPOT by device.
- Dependencies/assumptions: trace representativeness; robust PMC mappings across SoCs; consistent thermal behavior.
- Energy/battery optimization on mobile/edge
- Sectors: mobile, energy-conscious apps, robotics
- What you can do now:
- Use PMCs to correlate cycles, cache refills, and memory writes with time per operator; reduce threads to avoid >80% stalled cycles; prefer CPU vs GPU when it reduces refills for a given shape.
- Emergent tools/workflows/products: “Battery Saver” inference profiles (thread caps, backend choices) per model; DVFS-aware operator routing tables.
- Dependencies/assumptions: DVFS controls exposed; energy-use inference from PMCs (calibrations per SoC); background thermal constraints.
- Privacy-preserving, on-device observability
- Sectors: healthcare, education, finance (regulated environments), public sector
- What you can do now:
- Use non-intrusive eBPF tracing to gain visibility without modifying source code; keep data on-device; log operator-level metrics without capturing user text.
- Emergent tools/workflows/products: compliant telemetry bundles that exclude prompts/tokens; audit-ready performance logs for edge AI deployments.
- Dependencies/assumptions: careful log redaction (no prompt contents), role-based access to trace collectors, acceptable overhead budgets.
- Teaching and reproducible systems-ML labs
- Sectors: academia, training programs
- What you can do now:
- Use ProfDAG/ProfTime to teach decode vs prefill behavior, memory-bound GEMV, and backend partitioning; run labs on affordable SBCs.
- Emergent tools/workflows/products: open trace datasets and lab manuals; assignments on writing offload policies driven by traces.
- Dependencies/assumptions: accessible SBCs (RK3588, QCS6490), Linux-based OS, student privileges for eBPF.
- Policy and procurement guidance for edge AI
- Sectors: policy, public procurement, sustainability programs
- What you can do now:
- Require operator-level observability and profiling under representative prompts when evaluating on-device LLM solutions; include battery/thermal KPIs measured via PMCs; favor non-intrusive tracing methods.
- Emergent tools/workflows/products: “Edge AI Observability” checklists; conformance tests that verify profiling overhead (<5%) and visibility (token/graph/operator).
- Dependencies/assumptions: vendors expose symbols or standardized trace hooks; permission to run eBPF on evaluation hardware.
Long-Term Applications
These opportunities require further research, scaling, or development before broad deployment.
- Closed-loop, self-optimizing inference runtime
- Sectors: software, mobile/edge platforms, robotics
- Vision:
- A controller that uses ProfInfer-like signals to dynamically tune threads, backend routing, KV-cache policies, speculative decoding, and operator scheduling to meet latency/energy SLOs in real time.
- Potential products: “Autopilot” for llama.cpp; SO file that loads alongside the engine and continuously optimizes configs; RL- or model-based controllers.
- Dependencies/assumptions: low-latency signal ingestion; stable actuation hooks in the runtime; safety guards to avoid oscillations.
- Cost models and compilers trained from traces
- Sectors: ML compilers (TVM/MLC), inference engines
- Vision:
- Train device-specific cost models from ProfStat signals to drive graph partitioning, operator fusion, and inter-operator parallelism; predict per-operator time/memory accesses across backends to auto-generate offload plans.
- Potential products: “Trace2Plan” compiler passes; per-SoC performance libraries; shape-specialized kernels informed by PMC signatures.
- Dependencies/assumptions: sufficiently rich trace corpora across SoCs; standardized schema for operator semantics and PMCs; integration with compiler IR.
- Fleet-scale observability and optimization for edge AI
- Sectors: telco, retail, logistics, automotive
- Vision:
- Aggregated, privacy-preserving telemetry from thousands of devices to detect global regressions, push device-specific tuning profiles, and orchestrate model variants per site constraints.
- Potential products: Edge AIOps platform for LLMs; policy-driven rollout of offload rules; remote ProfDAG/ProfTime viewers.
- Dependencies/assumptions: secure telemetry channels; on-device summarization to avoid PII; kernel versions supporting eBPF at fleet scale.
- Hardware-software co-design for decode bottlenecks
- Sectors: semiconductor, mobile SoC vendors, NPUs
- Vision:
- Use fine-grained GEMV/MatMul traces and KV-cache access patterns to inform memory hierarchy design (prefetchers, cache partitioning), specialized decode accelerators, KV-cache hardware support, and counters tailored to LLMs.
- Potential products: NPU features for KV-cache reuse; DRAM-friendly attention kernels; new PMCs exposing token-stage semantics.
- Dependencies/assumptions: durable cross-vendor trace standards; engagement from SoC vendors; long silicon timelines.
- Standardized LLM inference observability APIs
- Sectors: standards bodies, OS vendors, engine maintainers
- Vision:
- A portable set of hooks to expose token/graph/operator semantics and backends (beyond llama.cpp) without reverse-engineering function symbols; eBPF-friendly ABI across engines (vLLM, mlc-LLM, MNN-LLM, TensorRT-LLM).
- Potential products: “LLM Trace ABI” spec; compatibility layers; test suites for fidelity and overhead.
- Dependencies/assumptions: ecosystem buy-in; alignment on privacy and minimal overhead; per-OS tracing support (Android, OpenHarmony, Linux distributions).
- MoE-aware prefetching, placement, and storage scheduling
- Sectors: software, storage, mobile/edge
- Vision:
- Predict expert activations and build DRAM warmsets; prefetch cold experts opportunistically; co-design storage/NAND schedulers for MoE I/O bursts; dynamic expert caching across CPU/GPU memory.
- Potential products: MoE cache managers; NAND-aware inference schedulers.
- Dependencies/assumptions: accurate expert reuse models; DRAM/storage APIs for prefetch and pinning; model compatibility (routing stability).
- Security and anomaly detection via trace signatures
- Sectors: security, enterprise IT
- Vision:
- Learn normal operator/timeline signatures per model/device; flag anomalous code injection, backdoored kernels, or unintended offloads via deviations in PMCs and scheduling patterns.
- Potential products: runtime IDS for LLM inference; “signed” performance fingerprints shipped with models.
- Dependencies/assumptions: robust baselines; low false-positive rates; secure tracer deployment.
- Consumer-facing performance/battery modes for AI features
- Sectors: mobile OEMs, consumer apps
- Vision:
- Translate trace insights into user-level toggles (e.g., “quiet/battery saver” caps threads and bans bandwidth-heavy offloads; “turbo” enables GPU offloading for specific shapes).
- Potential products: system settings for “AI Performance Mode”; per-app AI power policies.
- Dependencies/assumptions: OS support for per-app policies; minimal UX disruption; clear user messaging.
- Evidence-based policy for sustainable edge AI
- Sectors: policy, sustainability, regulators
- Vision:
- Use trace-derived energy/performance metrics to define eco-labels for on-device AI, minimum observability requirements, and procurement standards that favor efficient, transparent deployments.
- Potential products: policy toolkits; certification programs tied to traceability and efficiency thresholds.
- Dependencies/assumptions: accepted measurement protocols; independent verification; industry cooperation.
Notes across all items:
- Privacy: trace pipelines should exclude content (prompts/tokens) and store only structural/timing/PMC data unless explicit consent is obtained.
- Portability: while ProfInfer targets llama.cpp and specific backends (CPU, OpenCL/CLBlast, Rockchip NPU), generalization to other engines/backends requires adapter probes and stable symbol exposure.
- Overhead budgets: most immediate applications are feasible given measured overheads (<4%), but always validate per device/model and disable high-granularity probes in production when QoS dips.
Glossary
- Adreno GPU: A family of mobile graphics processing units by Qualcomm often used for accelerating compute kernels via OpenCL. "OpenCL backend for Adreno GPU"
- Apache TVM: An open-source deep learning compiler stack that optimizes and deploys models across diverse hardware. "The latter is based on Apache TVM"
- auto-regressive: A generation approach where the model outputs one token at a time conditioned on previously generated tokens. "Most decoder-only LLMs employ an auto-regressive manner to do the inference."
- BCC (BPF Compiler Collection): A toolkit for writing eBPF programs, providing high-level languages and Python bindings for kernel/user-space tracing. "libbpf and BCC (BPF Compiler Collection), to implement eBPF programs."
- CLBlast: An OpenCL-based BLAS library used to offload linear algebra operations (e.g., matrix multiplication) to GPUs. "the CLBlast backend is implemented under the CPU backend"
- DAG (Directed Acyclic Graph): A directed graph with no cycles, used to represent computation dependencies among operators. "computational DAG"
- decoder-only LLM: A LLM architecture that uses only the decoder stack (no encoder), common for generative tasks. "Most decoder-only LLMs employ an auto-regressive manner to do the inference."
- eBPF: Extended Berkeley Packet Filter; a technology for running sandboxed programs inside the OS kernel for tracing and profiling. "eBPF is a powerful technology that enables to run sandboxed programs in the kernel space"
- feed-forward network (FFN): The dense neural sub-block in transformer layers, typically applied after attention. "Each layer is composed of a self-attention layer and a feed-forward network (FFN)."
- GGML: A lightweight machine learning runtime library used by llama.cpp to execute graphs and operators across backends. "GGML, a machine learning runtime library that executes the graph and operator computation"
- gguf: A compressed on-disk model format used by llama.cpp that minimizes structural metadata to reduce footprint. "llama.cpp compresses the model into gguf format"
- GGML_OPENCL_PROFILING: A build/runtime flag in GGML enabling OpenCL kernel-level profiling. "we need to turn on the flag GGML_OPENCL_PROFILING to enable the built-in profiling tool"
- grouped query attention (GQA): A variant of attention where query vectors are grouped to reduce compute/memory while maintaining performance. "adopting grouped query attention (GQA)"
- KV cache: A memory structure storing key/value tensors from previous steps to avoid recomputation during decoding. "KV cache management"
- libbpf: A C library for building and loading eBPF programs without Python, suitable for lightweight environments. "libbpf and BCC (BPF Compiler Collection), to implement eBPF programs."
- llama.cpp: A C/C++-based LLM inference engine supporting CPUs, GPUs, and NPUs, widely used for on-device deployment. "exemplified by llama.cpp but applicable to similar runtime architectures."
- Mixture-of-Experts (MoE): An architecture that routes tokens through a subset of expert networks to reduce compute while increasing capacity. "mixture-of-experts (MoE)"
- mmap: Memory-mapped file I/O that maps files into process memory space, reducing load-time and enabling lazy paging. "llama.cpp can employ mmap well"
- NPU: Neural Processing Unit; a specialized accelerator for neural network operations. "including CPU, GPU, and certain types of NPU."
- ONNX Runtime: A cross-platform inference engine for models in the ONNX format with built-in profiling tools. "ONNX Runtime"
- OpenCL: A standard for heterogeneous parallel programming across CPUs/GPUs/accelerators via command queues and kernels. "OpenCL backend"
- OpenHarmony: An open-source operating system targeting IoT/mobile devices with constrained environments. "OpenHarmony does not support a Python environment by default"
- paged attention: A memory management technique that organizes attention KV cache in pages to improve allocation and reuse. "paged attention"
- perf buffer: An eBPF mechanism for efficient event delivery from kernel to user space with loss awareness. "ring buffer or a perf buffer"
- Perfetto: An open-source trace visualization and analysis tool used to render Chrome Trace Event format timelines. "Perfetto"
- Performance Monitoring Counter (PMC): Hardware/software counters that report low-level events (e.g., cycles, cache refills) for profiling. "performance monitoring counter (PMC) data"
- prefill stage: The initial inference phase where the prompt is processed before iterative decoding begins. "prefill stage"
- Quality of Service (QoS): A performance target or constraint (e.g., minimum token rate) used to adapt tracing overhead at runtime. "Quality of Service (QoS) requirement"
- ring buffer: A circular buffer used by eBPF for high-throughput event passing to user space with potential drops. "ring buffer or a perf buffer"
- Rockchip NPU: A vendor-specific neural accelerator used in RK3588 SoCs for offloading LLM operators. "Rockchip NPU backend"
- rotary positional embedding: A positional encoding method that rotates query/key vectors to encode relative positions. "rotary positional embedding"
- RMS Norm: Root-mean-squared layer normalization; a normalization technique used in some LLM architectures. "root-mean-squared layer-normalization (RMS Norm)"
- sched_switch: A Linux kernel scheduler tracepoint indicating context switches between threads. "sched_switch and sched_wakeup"
- speculative decoding: A technique that uses a faster draft model to propose tokens and a larger model to verify them. "speculative decoding"
- SwiGLU: An activation function combining SiLU and GLU variants used in transformer feed-forward blocks. "SwiGLU as the activation function"
- time per output token (TPOT): The average latency to generate a single output token during decoding. "time per output token (TPOT)"
- time to the first token (TTFT): The latency from start of inference to the generation of the first token. "time to the first token (TTFT)"
- tokens per second (TPS): A throughput metric indicating how many tokens are generated per second. "tokens per second (TPS)"
- tracepoint: A kernel-instrumented event hook used by eBPF to trace system behavior (e.g., scheduler). "tracepoints in Linux scheduler"
- uprobe: An eBPF hook attached to user-space function entry for tracing without modifying binaries. "uprobes, uretprobes, and tracepoints"
- uretprobe: An eBPF hook attached to user-space function return to capture exit timing/outputs. "uprobes, uretprobes, and tracepoints"
Collections
Sign up for free to add this paper to one or more collections.