The LOFAR Two-metre Sky Survey: VII. Third Data Release
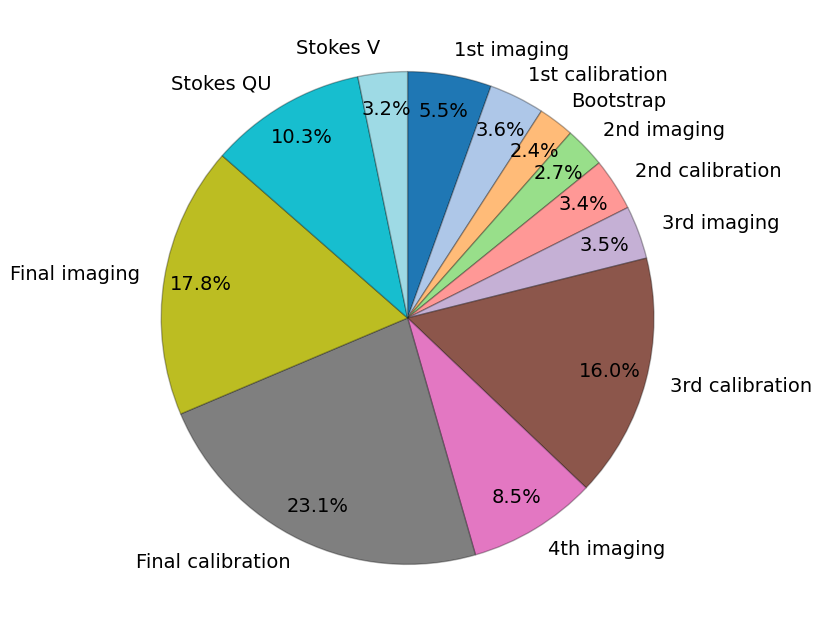
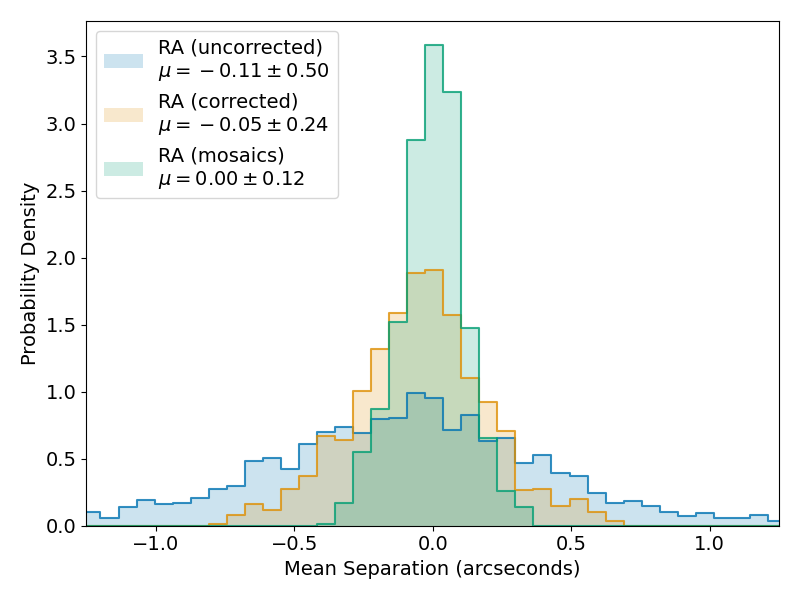
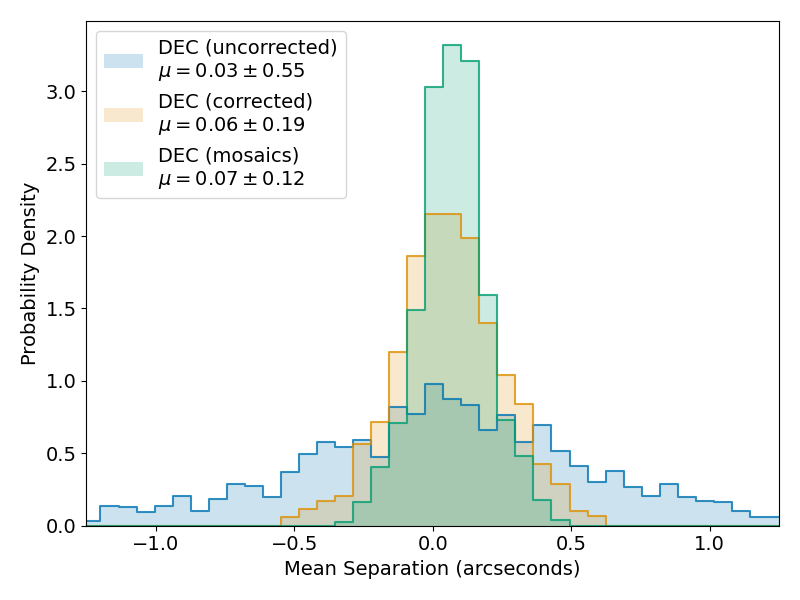
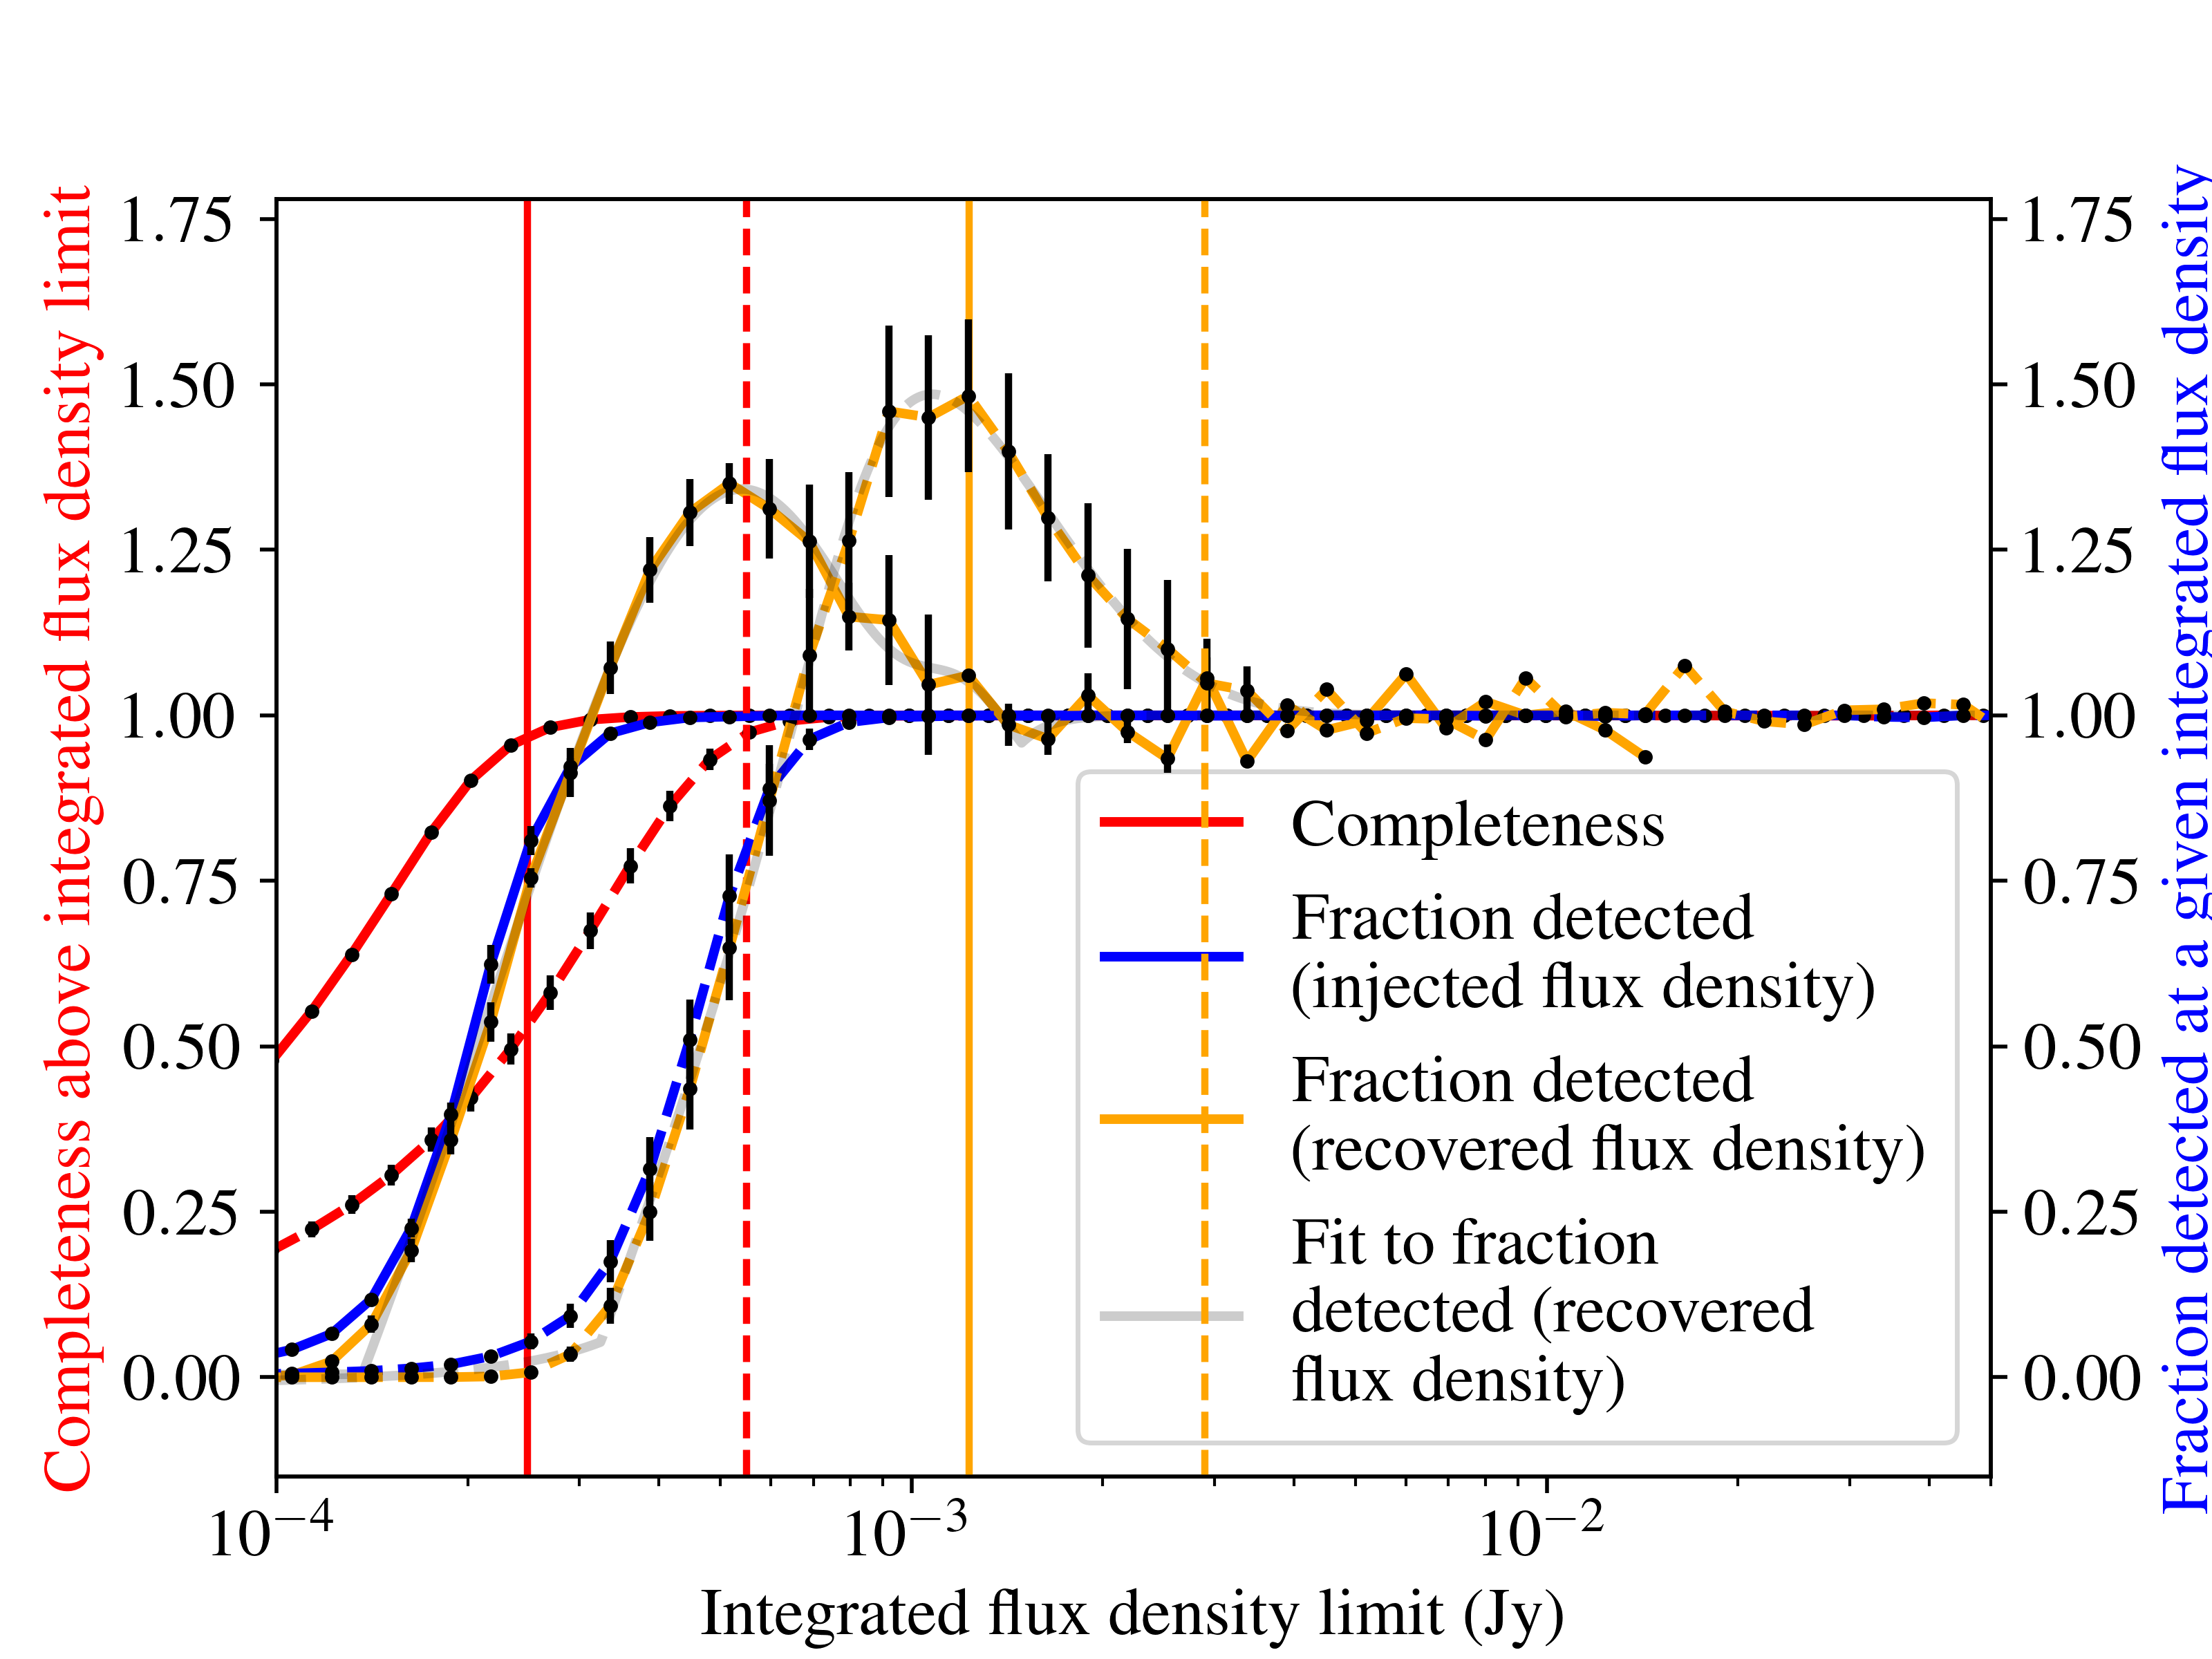
Abstract: We present the third data release of the LOFAR Two-metre Sky Survey (LoTSS-DR3). The survey images cover 88% of the northern sky and were created from 12,950 hrs of data (18.6 PB) accumulated over 10.5 years. The images were produced through direction-independent and direction-dependent calibration pipelines that correct for instrumental effects as well as spatially and temporally varying ionospheric distortions. In our 120-168 MHz continuum mosaic images with an angular resolution of 6 arcsec (9 arcsec below declination 10$\circ$) we catalogue 13,667,877 sources, formed from 16,943,656 Gaussian components. The scatter in the astrometric precision approximately follows the expected noise-like behaviour but with an additional systematic component of at least 0.24 arcsec that is likely due to calibration imperfections. The random flux density scale error is 6%, while the systematic offset was previously shown to be within 2%. The median sensitivity of our mosaics is 92$μ$Jy beam${-1}$. Completeness simulations, accounting for realistic source models, time- and bandwidth-smearing effects, and astrometric errors, indicate that we detect more than 95% of compact sources with integrated flux densities exceeding 9 times the local root mean square (RMS) noise. However, the recovered source counts in a particular integrated flux density bin do not match the injected counts until flux densities exceed 45 times the local RMS noise. The Euclidean-normalised differential source counts derived from the survey constrain the radio source population over five orders of magnitude and are in good agreement with previous deep and wide-area surveys. All data products are publicly available, including catalogues, individual-field Stokes I, Q, U, and V images, mosaicked Stokes I images, and $uv$ data with associated direction-dependent calibration solutions.
Paper Prompts
Sign up for free to create and run prompts on this paper using GPT-5.
Top Community Prompts
Explain it Like I'm 14
The LOFAR Two-metre Sky Survey (LoTSS) — Third Data Release (DR3) Explained
Overview: What is this paper about?
This paper announces and explains the third big release of a giant radio map of the sky, made with a telescope called LOFAR. LOFAR listens to low-frequency radio waves (like very low-pitched radio “music”) with wavelengths around two metres. The new release (called LoTSS-DR3) covers most of the northern sky and lists over 13 million radio sources—things like distant galaxies with black holes, star-forming galaxies, supernova remnants, and more.
Here are a few headline facts: | What | Number/Detail | |---|---| | Sky area covered | 88% of the northern sky (about 19,035 square degrees) | | Frequency | 120–168 MHz (central frequency 144 MHz) | | Sharpness of images | 6 arcseconds (9 arcseconds near the equator) | | Sensitivity (typical faintness detectable) | Median 92 microJansky per beam | | Number of catalogued sources | 13,667,877 | | Observing time | 12,950 hours over 10.5 years | | Computing used | ~20 million CPU core hours |
What questions were the researchers trying to answer?
In simple terms, they wanted to:
- Make a very detailed, very wide radio map of the northern sky at low frequencies.
- Measure how sharp and reliable the images are (positions, brightness, and sensitivity).
- Count how many radio sources exist at different brightness levels and compare with other surveys.
- Provide clean, easy-to-use data so other scientists can study everything from black holes to exploding stars.
How did they do it? (Methods in everyday language)
Think of LOFAR as a giant, spread-out “radio camera” made of many small antennas across Europe. By working together, these antennas act like one huge telescope.
What they did, step by step:
- Observations: They pointed LOFAR at thousands of spots (“pointings”) on the sky, each for hours. Then they moved to the next spot, building a big mosaic like stitching many photos into a giant panoramic picture.
- Handling “glare”: Extremely bright radio sources (like Cygnus A) can wash out parts of the image, a bit like the sun causing lens flare in a photo. The team used special math tricks (“demixing”) to subtract the glare from those bright sources.
- Calibration: This is like cleaning smudges off a camera lens and adjusting the focus, color, and brightness so the picture is accurate.
- Direction-independent calibration (LINC pipeline): Fixes general instrument effects (like timing, bandpass, and polarization) the same way across the whole picture.
- Direction-dependent calibration (DDF-pipeline): Adjusts for local “wobbles” caused by the atmosphere and the telescope’s beams, which can vary in different directions—like focusing different parts of a wide-angle photo separately.
- Mosaicking: They divided the sky into equal tiles (using a system called HEALPix), then carefully stitched and blended overlapping images to make smooth final maps.
- Finding sources: A source-finding tool (PyBDSF) scanned the images to detect and measure radio sources. They also matched positions and brightness against other surveys (like NVSS and FIRST) to check accuracy.
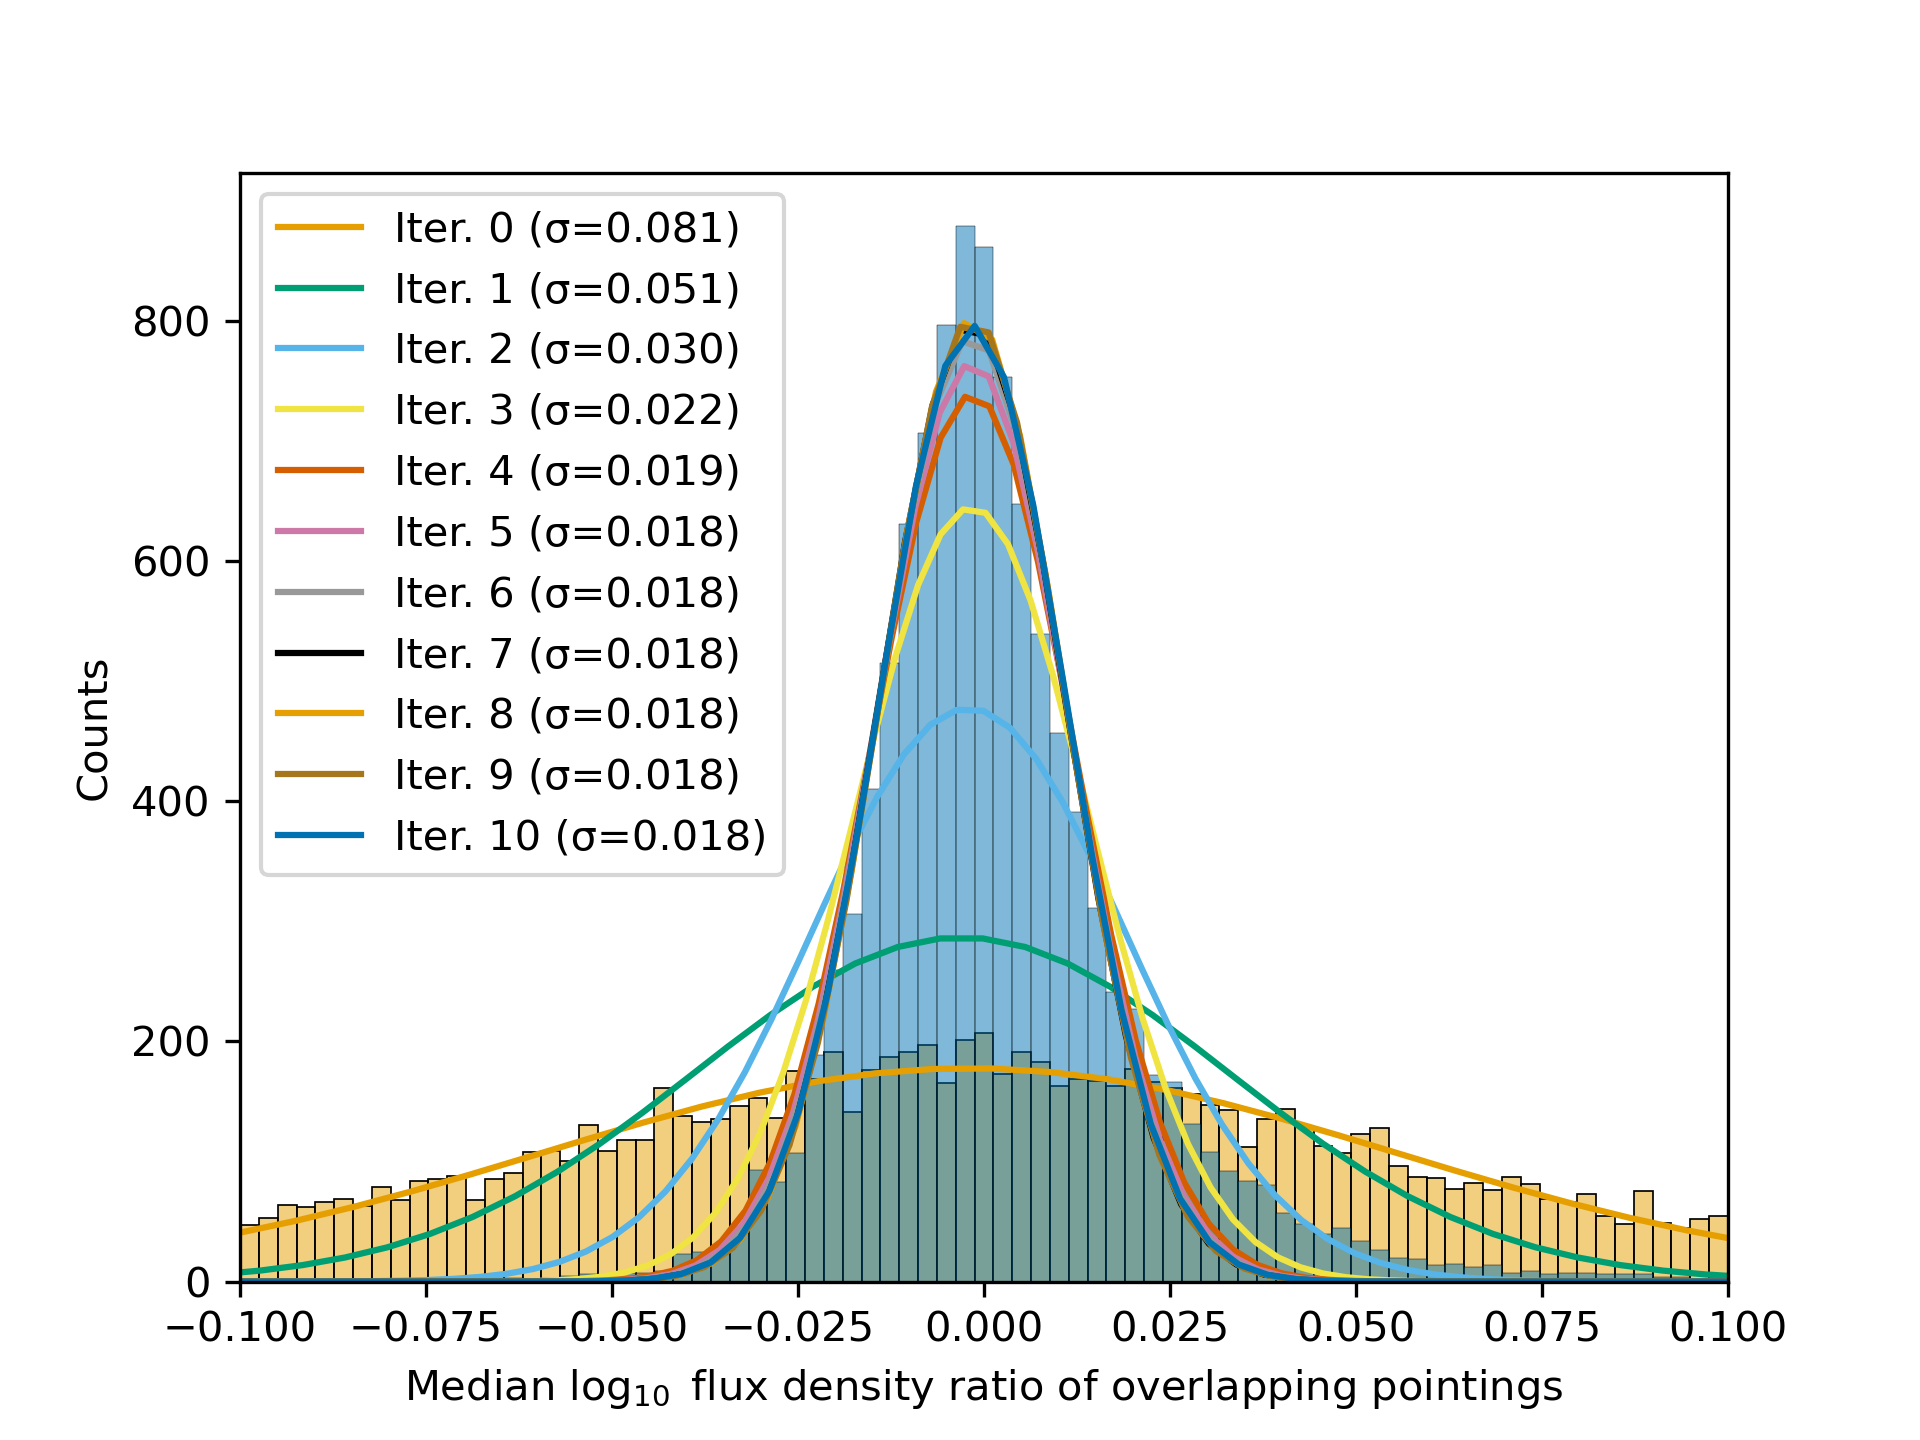
- Quality checks: They tested how well positions lined up (astrometry), how reliable brightness measurements were (flux scale), and how sensitive each image was (RMS noise). They refined the brightness across each pointing so neighboring tiles agreed—like adjusting exposure levels so a panoramic image doesn’t show seams. This reduced brightness mismatches from about 20% down to about 4%.
A helpful analogy:
- LOFAR’s images are like a huge nighttime cityscape. Calibration is removing fog and correcting streetlight color so every block looks right. Mosaicking is stitching many street photos into a single, clean city map. Source finding is counting and measuring every visible building and light.
What did they find, and why is it important?
Main results:
- Massive coverage and catalog: They mapped 88% of the northern sky and catalogued over 13.6 million radio sources at low frequencies. This is one of the largest, sharpest radio surveys at these wavelengths.
- Sharpness and accuracy:
- Positions: After alignment, typical position offsets compared to the FIRST survey are tiny (mean offsets per field ~0.05–0.06 arcseconds), with a small extra systematic scatter (~0.24 arcseconds). For sky maps, that’s very good.
- Brightness: Random brightness (flux) uncertainty is about 6%, and overall systematic offsets are within 2%. That means measurements are consistent and trustworthy.
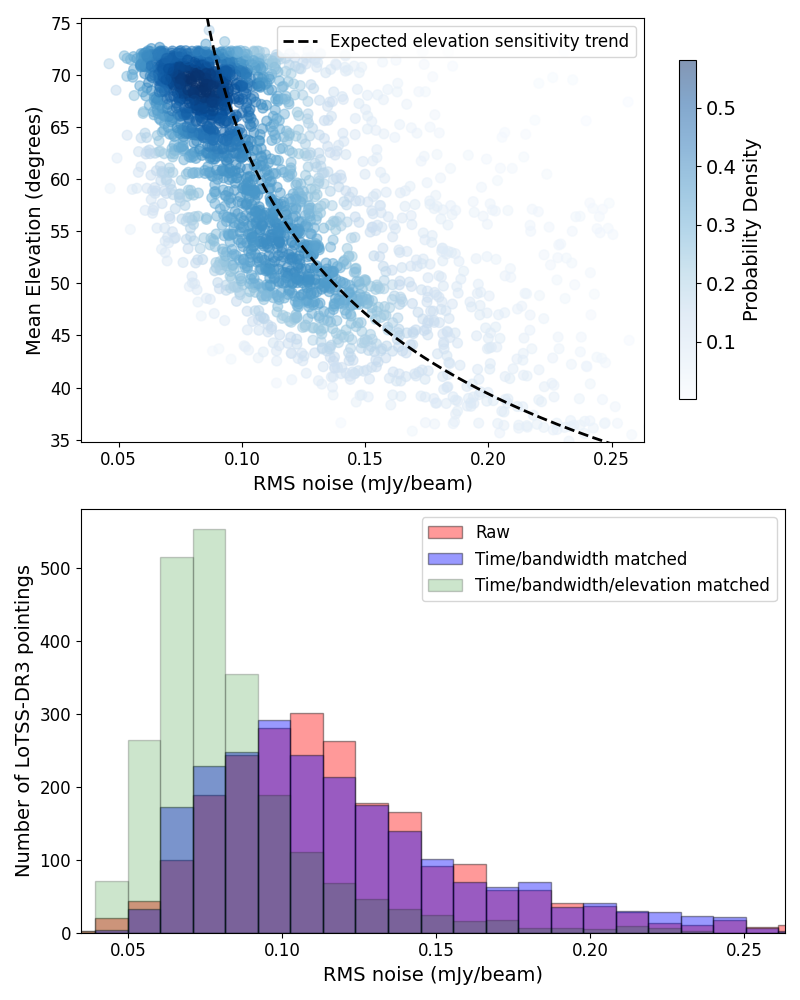
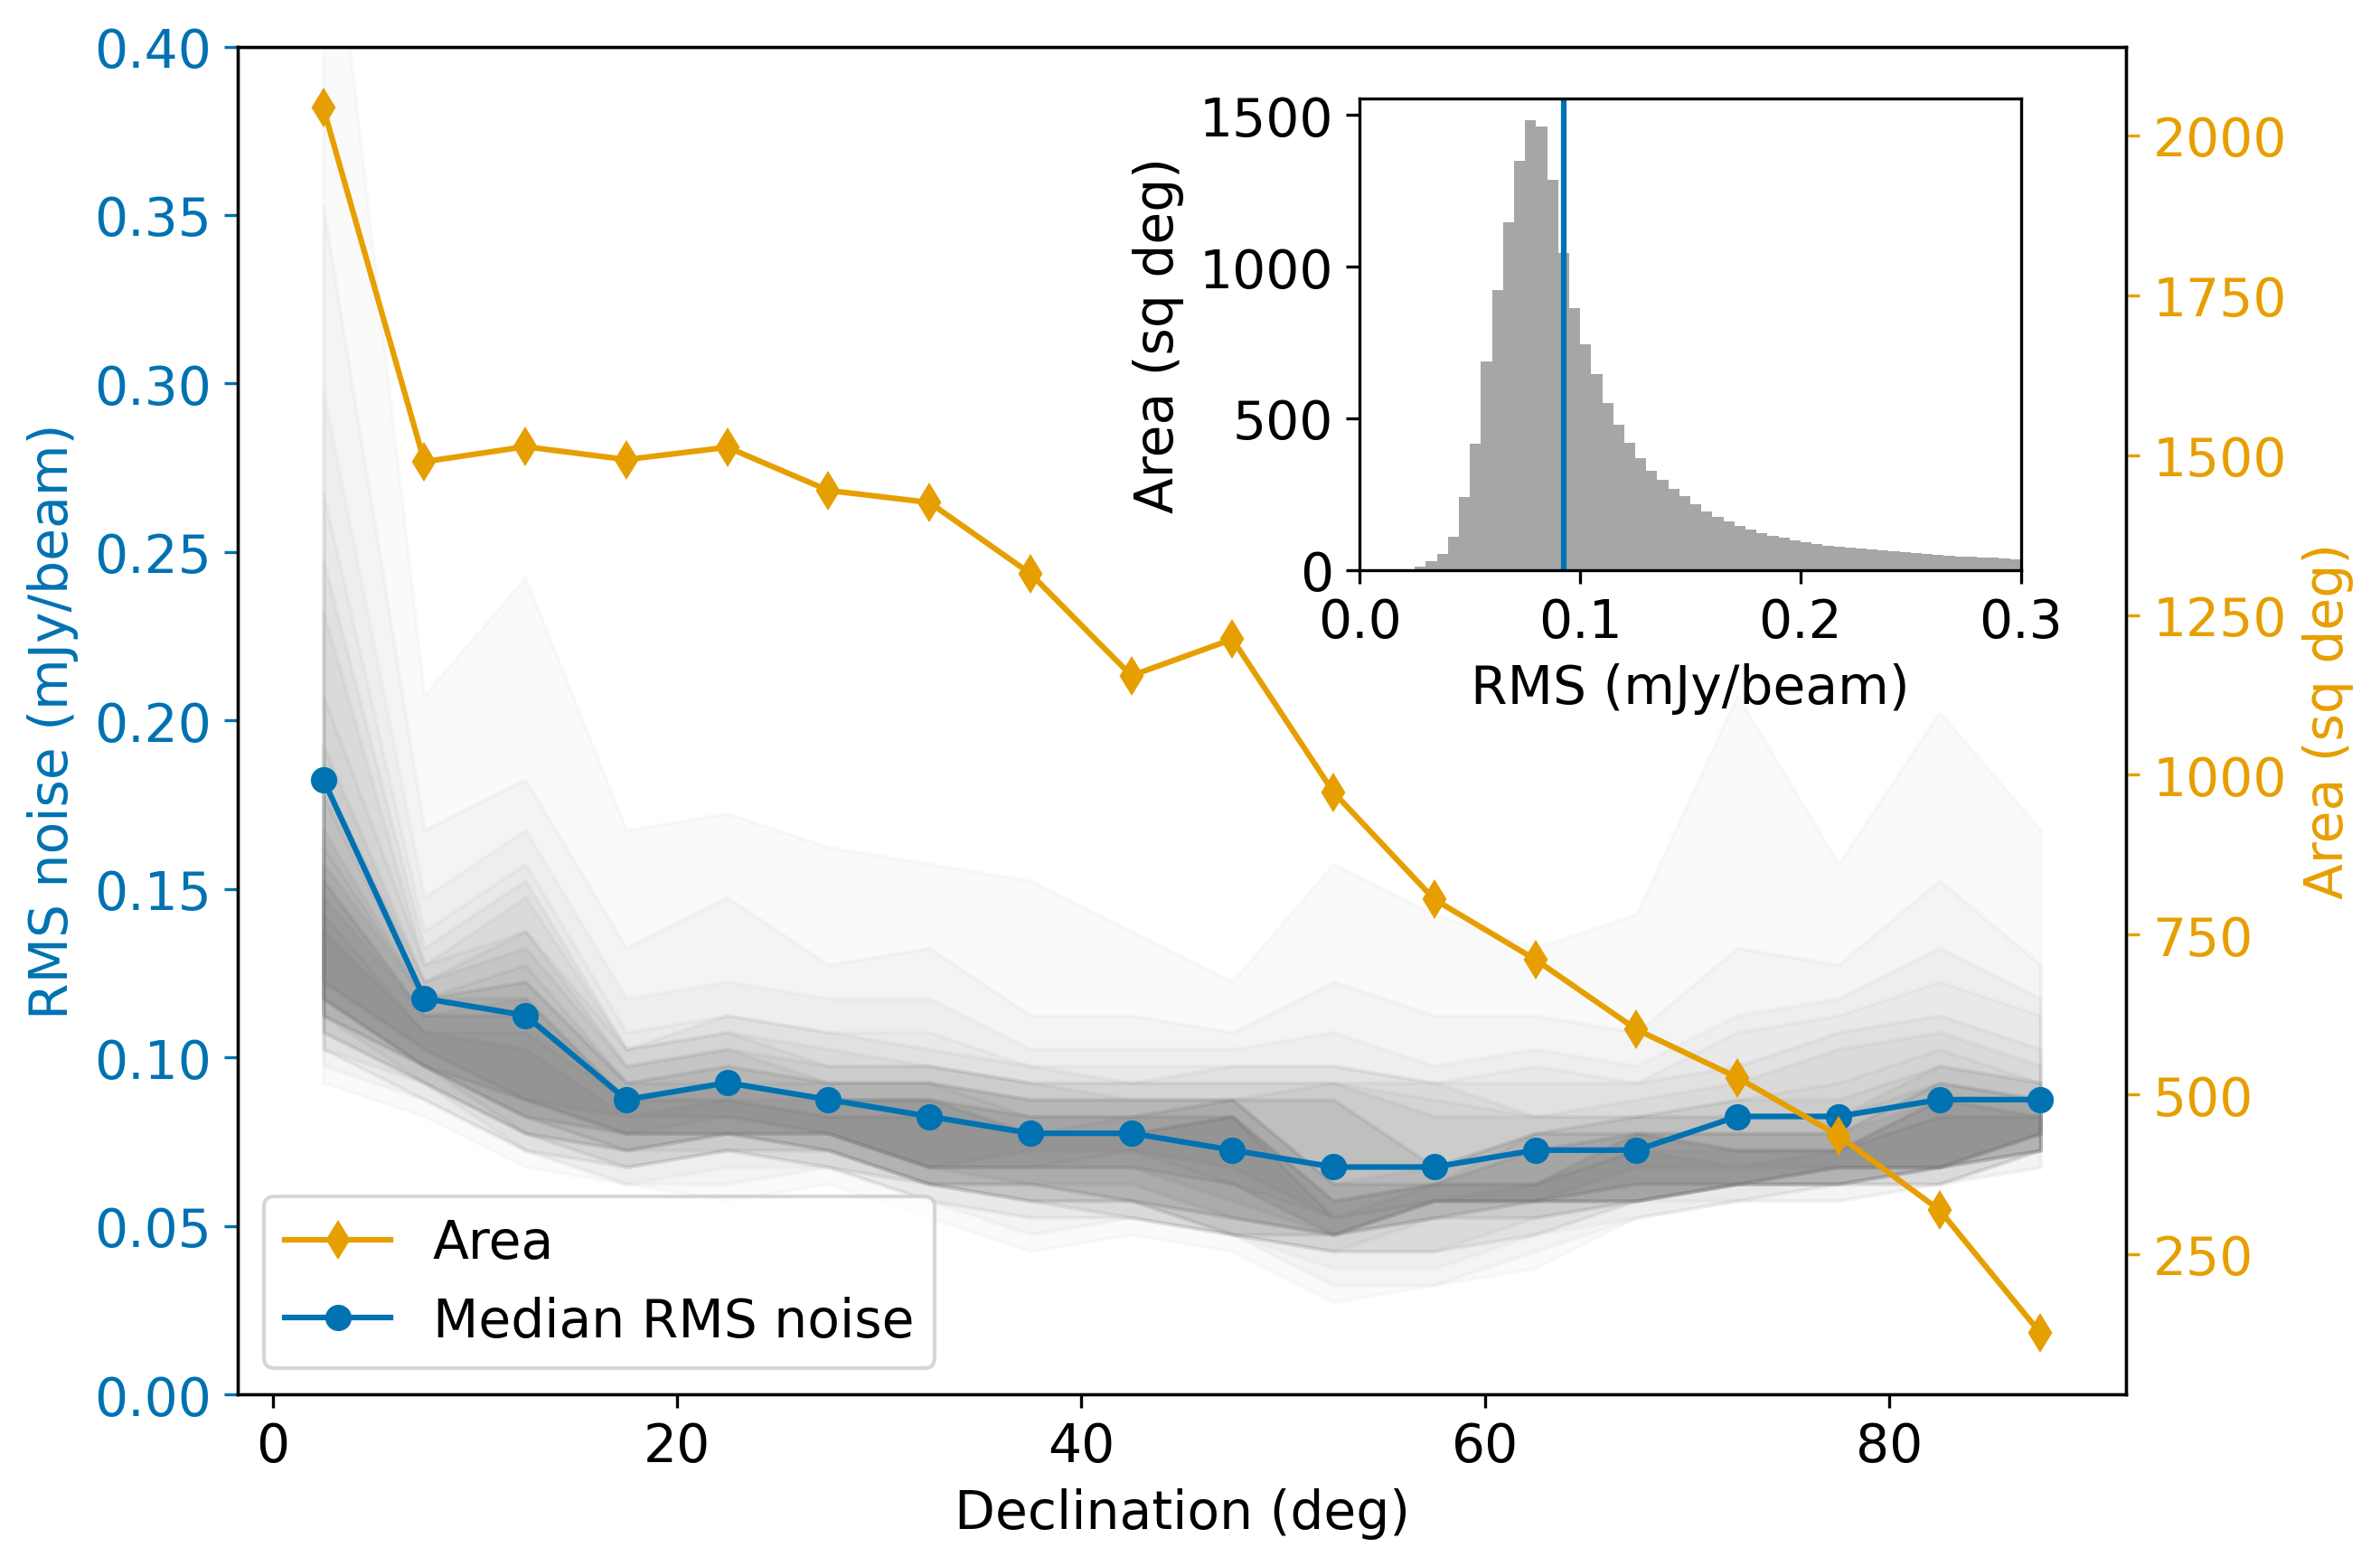
- Sensitivity: The typical faintness they can detect is 92 microJansky per beam, improving at high elevations and slightly worse near the equator (because of how the antennas project on the sky). Even the deepest images are not strongly limited by “confusion” (lots of faint sources blending together).
- Completeness and counts:
- They detect more than 95% of compact (non-extended) sources that are at least 9 times brighter than the local noise level.
- For precise counting of how many sources exist per brightness bin, things become fully reliable above about 45 times the local noise level.
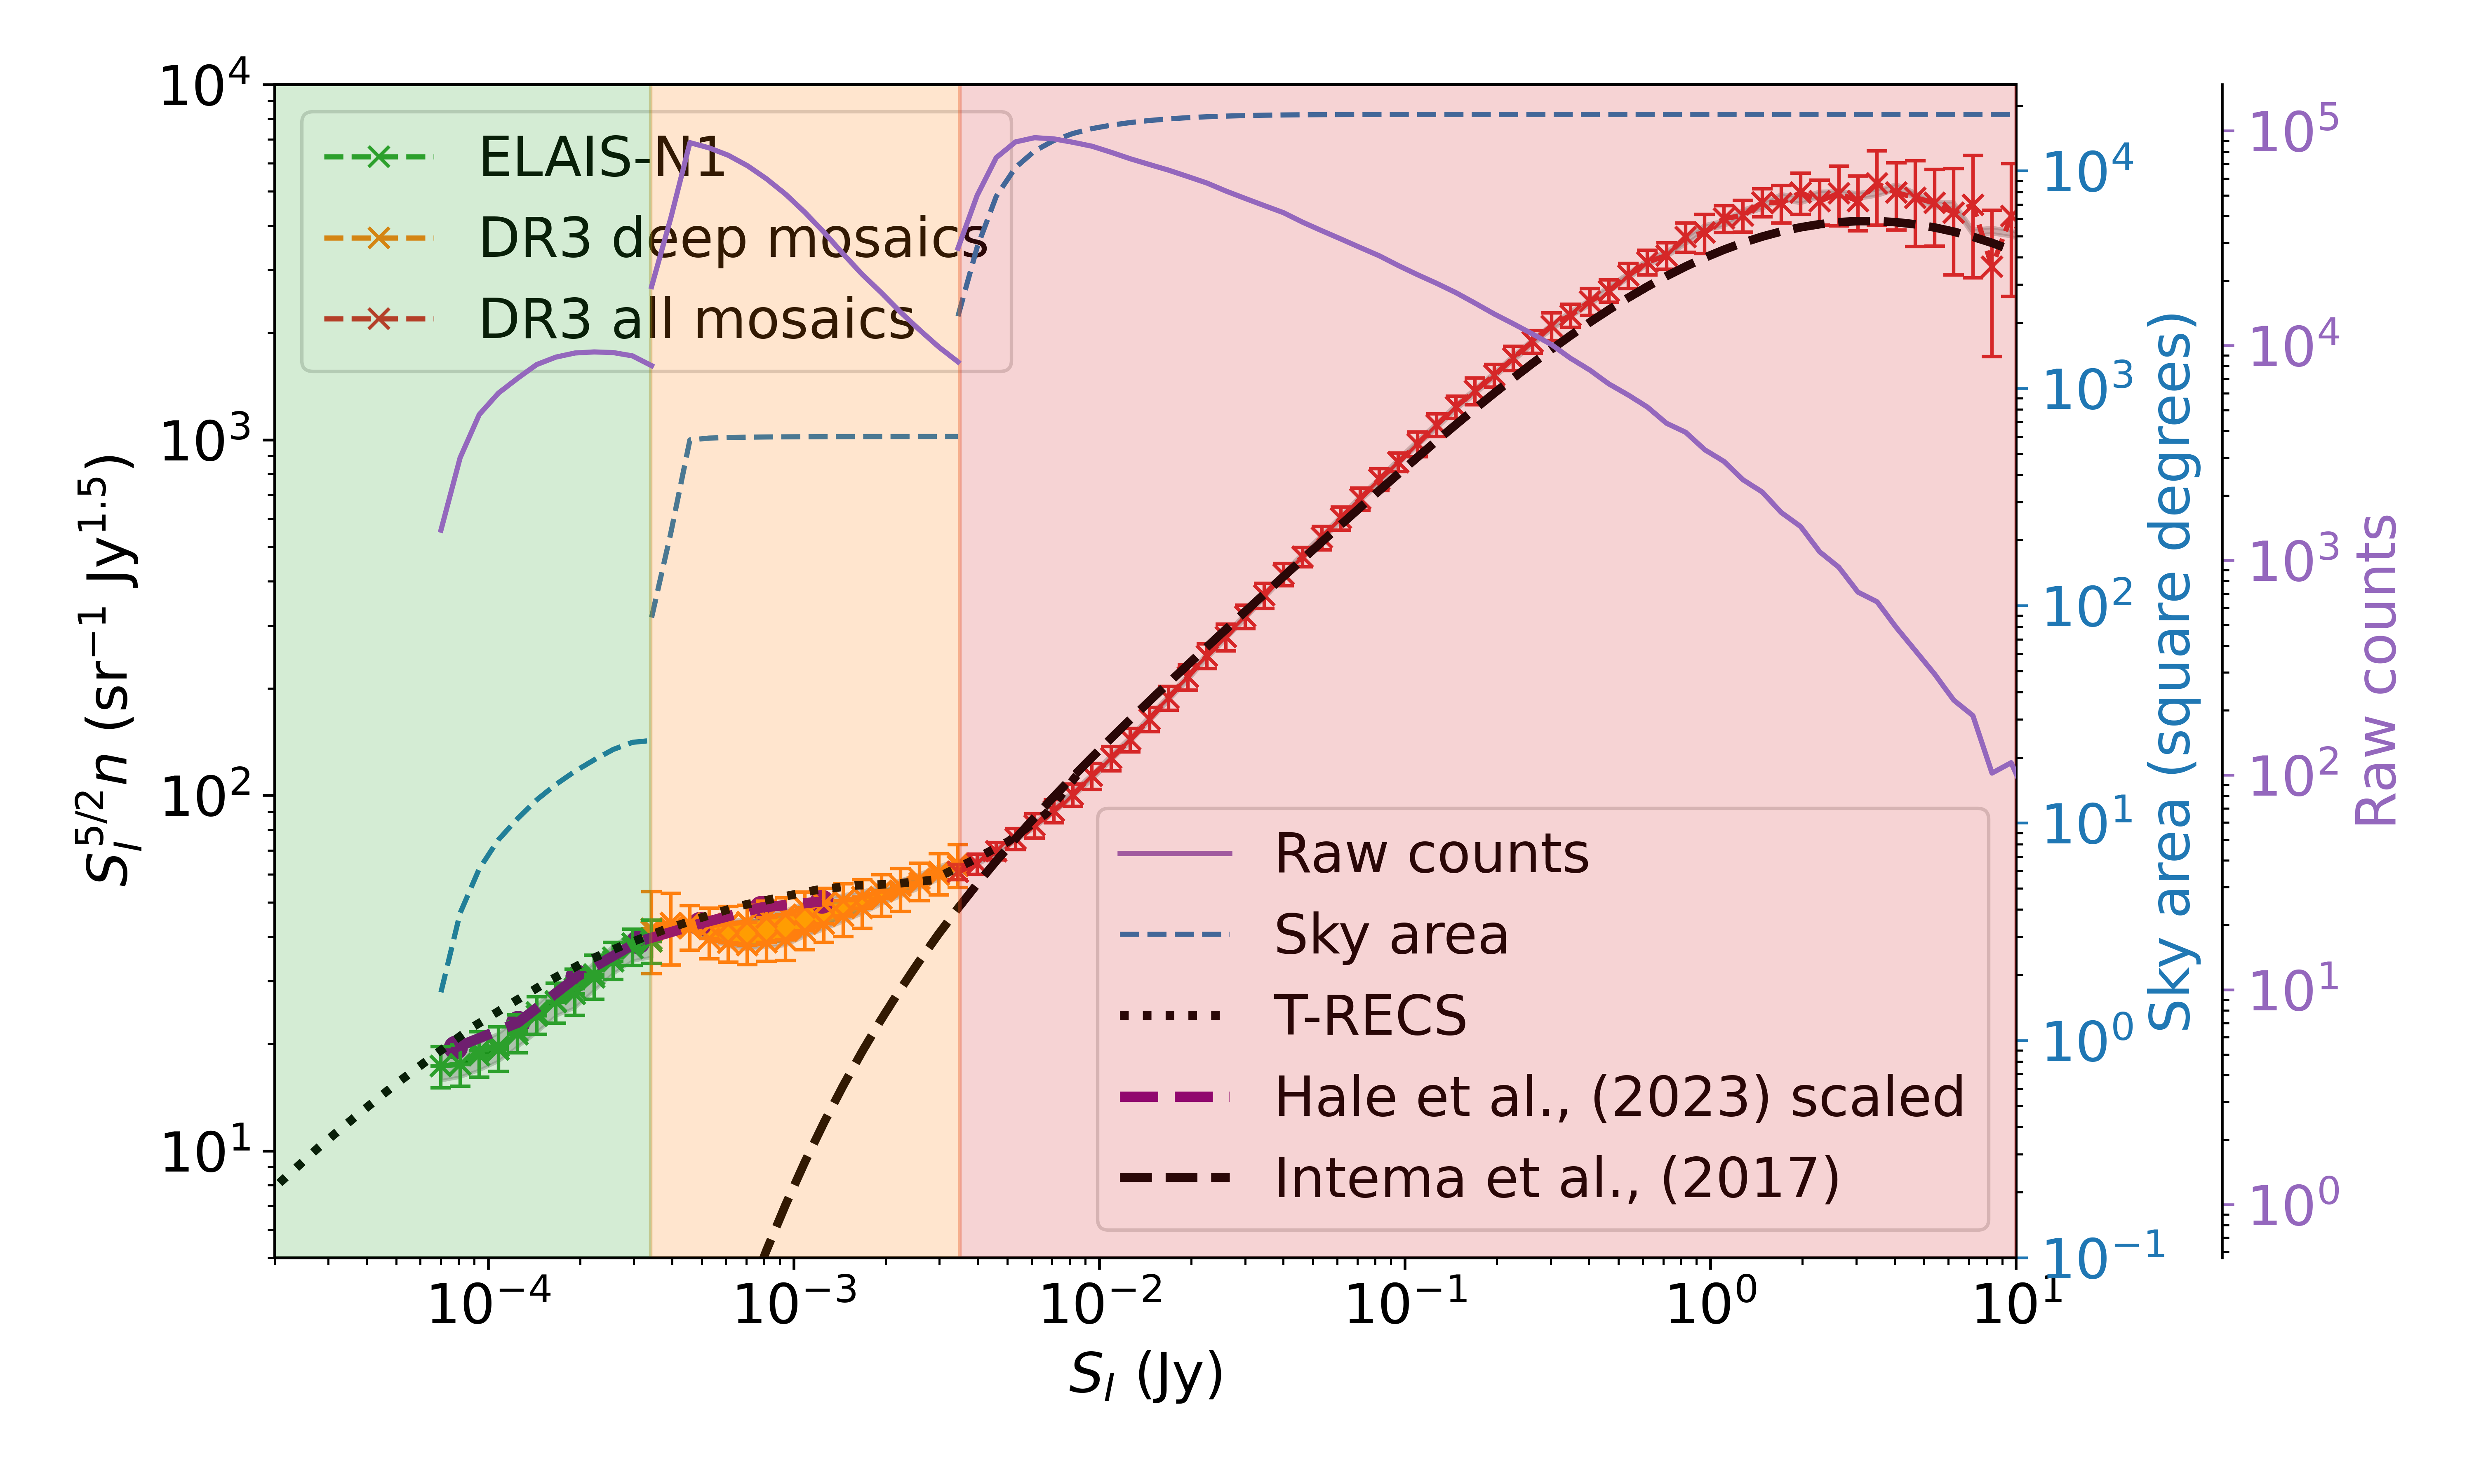
- Their source counts agree very well with other deep and wide-area surveys across five orders of magnitude in brightness.
- Public data: They released images (including different “Stokes” products: I for brightness, Q and U for linear polarization, V for circular polarization), detailed source catalogs, and the raw “uv” data plus calibration solutions so others can reprocess for special purposes (like faint extended emissions or searching for transient events).
Why it matters:
- This is a cornerstone map for radio astronomy at low frequencies. It lets scientists study:
- How supermassive black holes in galaxies feed and blow out jets.
- How stars form in galaxies over cosmic time.
- The gas and magnetic fields inside galaxy clusters.
- Cosmic magnetism and how it shapes the universe.
- Transients (brief radio flashes), pulsars, and supernova remnants.
- It also provides a high-quality baseline to compare with other big surveys (e.g., EMU, GLEAM, VLASS, MeerKAT, and other LOFAR projects), helping build a full picture of the radio sky across many frequencies.
What is the impact and what’s next?
This release is a powerful tool for the astronomy community:
- It dramatically expands the number of known radio sources at low frequencies and improves our view of the radio universe.
- Because the data are public and include the raw measurements, scientists can tailor the processing for their specific goals (for example, removing known sources to hunt for transients).
- It supports cross-matching with optical and infrared data to identify host galaxies, estimate distances (redshifts), and study galaxy properties.
- Future work includes finishing the remaining sky areas, improving models for the telescope’s beam (to further tighten brightness accuracy), and benefiting from the LOFAR2.0 upgrade for even better stability and performance.
In short: LoTSS-DR3 is like delivering a detailed, well-calibrated, and nearly complete radio atlas of the northern sky—one that many different kinds of astronomers can use to explore the universe.
Knowledge Gaps
Unresolved gaps, limitations, and open questions
Below is a consolidated list of concrete knowledge gaps, limitations, and open questions that remain unresolved in this paper. Each item is framed to be actionable for future research and data processing improvements.
- Incomplete sky coverage and difficult regions: 88% of the northern sky is covered; many pointings within |b| < 20° and within 10° of very bright sources (Cassiopeia A, Cygnus A, Taurus A, Hercules A, Virgo A) are missing or excluded. Develop specialized calibration/imaging strategies to recover these regions, and quantify achievable dynamic range and completeness near such sources.
- Handling of extremely bright off-axis sources: Demixing is used for Cas A and Cyg A within 30°, while other A-team sources are mitigated via clipping. Systematically quantify residual contamination and dynamic-range losses versus angular separation, and design generalized bright-source subtraction strategies beyond fixed clipping thresholds.
- Astrometric limitations and residual systematics: Facet-based rigid shifts leave a residual systematic astrometric component of at least 0.24″; 40% of facets could not obtain direct facet-specific offsets (median-of-field applied) and 3% of fields had no corrections at all. Investigate higher-order (non-rigid) astrometric warps per facet, leverage Gaia/VLASS/GLEAM-X for robust references in challenging regions, and deliver per-field astrometric uncertainty maps.
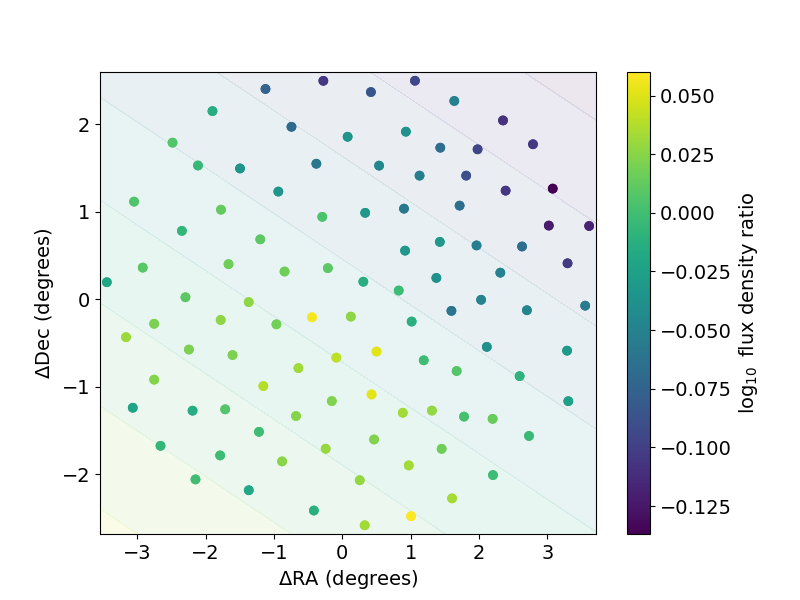
- Origin of flux density scale variations across the field of view: Position-dependent flux scale gradients require empirical alignment; the underlying cause (e.g., LOFAR HBA beam model inaccuracies) remains unquantified. Update and validate the primary beam model (including time/frequency/baseline dependences), and evaluate whether amplitude DDE calibration can remove residuals.
- Flux-scale anchoring assumptions: NVSS is scaled to 144 MHz using α = −0.78 derived from 6C matches, without accounting for spectral curvature or population-dependent spectral indices. Quantify biases introduced by a single α, incorporate multi-frequency constraints (GLEAM/GLEAM-X, EMU, TGSS) for per-source color corrections, and re-evaluate the absolute scale across the sky.
- Extended and diffuse source flux accuracy: Flux scale alignment is derived from compact isolated sources; the impact on extended, complex, or blended sources is not evaluated. Perform uv-plane injection and recovery tests with realistic extended morphologies to quantify flux recovery, deblending accuracy, and surface-brightness biases.
- Faint-end completeness and source counts mismatch: Injected versus recovered source counts agree only above ~45× local RMS despite >95% detection for compact sources above ~9× RMS. Diagnose causes (resolution bias, Eddington bias, smearing, local noise estimation, deblending) and deliver completeness corrections and per-source detection priors as a function of size, flux, and environment.
- Dynamic-range limited areas and failed facets: ~7.6±3.1% of the area within the 30% PB radius is dynamic-range limited; facet calibration divergence is identified via semi-manual QC. Automate QC metrics for facet failure detection, quantify catalogue reliability and spurious detection rates in these areas, and provide flags and reprocessing recipes.
- Non-uniform resolution across the sky: Data below Dec 10° are convolved to 9″ while other regions are at ~6″. Provide homogenized resolution products, per-mosaic PSF/beam maps, and assess the impact on morphology, size measurements, and fluxes; consider global PSF homogenization for uniform cataloguing.
- Elevation-dependent sensitivity losses: RMS degrades to ~183 μJy/beam at the equator due to station area projection effects. Explore scheduling or calibration strategies to mitigate elevation-driven sensitivity losses, and quantify completeness penalties by declination.
- Polarization calibration and quality: Stokes Q/U/V products are released but leakage, absolute polarization angle calibration, RM resolution, and residual ionospheric effects are not assessed. Implement direction-dependent polarization calibration (including ionospheric RM variability), deliver RM cubes with uncertainties, and provide per-field polarization QC metrics.
- Use of international baselines: LINC removes international stations for DI calibration; final products do not exploit sub-arcsecond baselines. Develop workflows retaining international stations with appropriate averaging and DDE calibration to offer high-resolution LoTSS products and quantify the trade-offs.
- Mosaicking and edge effects: HEALPix tiling can split very large sources across mosaics, and catalogues are filtered per tile. Implement edge-aware association/deblending for cross-tile sources, provide contiguous cutouts for giant sources, and validate that no flux or component duplication/loss occurs at tile boundaries.
- Beam correction averaging: Final images are corrected with a baseline-, time-, and frequency-averaged primary beam; residuals from averaging are not quantified. Characterize beam-induced photometric and polarization systematics across time/frequency, and validate with holography or beam-mapping campaigns.
- RFI and A-team clipping impacts: Baselines/time intervals are flagged when predicted signals exceed 5 Jy; the impact on uv-coverage, PSF, and fidelity (especially for diffuse emission) is not analyzed. Quantify biases and design alternative mitigation (e.g., improved demixing or model-based subtraction) to preserve uv sampling.
- Astrometric validation coverage: Validation uses Pan-STARRS DR2 and FIRST, which have limited footprint and potential issues in dense stellar or low-latitude regions. Cross-validate with VLASS, Gaia, and southern surveys (where applicable) and publish sky-dependent astrometric performance maps.
- Catalogue reliability and deblending: PyBDSF with a 4.5σ threshold is used, but false-positive rates, reliability versus flux/size, and deblending accuracy in complex fields are not quantified. Benchmark against truth sets in LoTSS-Deep/MIGHTEE regions, release per-source quality flags, and provide recommended thresholds for different use cases.
- Confusion noise assessment: The paper asserts confusion contributes ≤5% to RMS but does not present empirical measurements across sky and flux regimes. Measure confusion versus beam size, source density, and Galactic latitude, and flag confusion-limited localized regions.
- Time-domain capabilities: Although dynamic spectra of selected variables are mentioned, DR3 does not quantify variability detection limits or provide a transient/variable catalogue. Establish repeat-visit sensitivity, epochal comparison frameworks, and variability metrics, and release a time-domain companion catalogue.
- Galactic plane processing: Imaging in the most complex Galactic regions is shown, but dedicated diffuse emission modelling and compact-source extraction strategies are not described. Develop tailored masks and pipelines for the plane, quantify completeness/reliability, and deliver specialized Galactic catalogues.
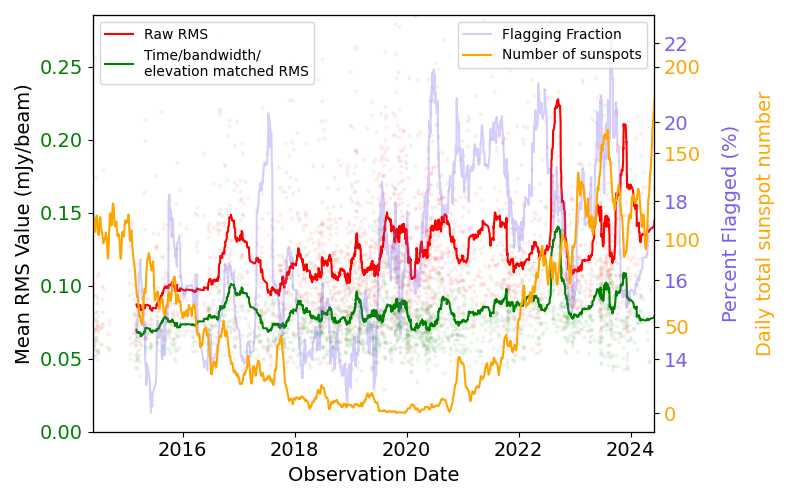
- Calibration performance drivers: The relationship between calibration failures, solar activity (sunspots), flagging fraction, elevation, and data properties is not statistically analyzed. Perform meta-analysis to guide scheduling, parameter tuning, and automated failure prediction.
- User-facing reproducibility: While uv data and DDE solutions are released, step-by-step, standardized workflows and parameter recommendations for common science cases (diffuse emission, morphology, spectral indices, polarization) are not consolidated. Provide vetted pipelines, example notebooks, and benchmarks to lower barriers for reprocessing.
- Per-source uncertainty budget: Global random flux-scale error (~6%) and systematic offset (≤2%) are reported, but per-source and per-facet uncertainty components (including position, shape, flux covariance) and sky-dependent systematics are not provided. Release uncertainty maps and per-source structured error budgets to support precision science.
Practical Applications
Overview
Below are actionable, real-world applications that flow directly from the LoTSS-DR3 survey’s findings, methods, and innovations. Each item notes the most relevant sectors, potential tools/products/workflows, and key assumptions/dependencies that affect feasibility. Applications are grouped into Immediate (deployable now) and Long-Term (requiring further research, scaling, or development).
Immediate Applications
- Wide-area low-frequency sky atlas for scientific analyses
- Sector(s): Academia (astronomy/astrophysics), Software (scientific computing), Education/outreach
- What: Use the public 120–168 MHz images, mosaics, and 13.7M-source catalogue (6″/9″ resolution, median RMS ≈ 92 μJy beam⁻¹) across 88% of the northern sky for studies of AGN, star formation, galaxy clusters, supernova remnants, the Galactic ISM, and cosmic magnetism.
- Tools/workflows: Queryable source catalogues; Stokes I mosaics for large-scale analyses; cutout services and cross-matching against optical/IR (e.g., Pan-STARRS, WISE).
- Assumptions/dependencies: Users account for 6% random flux-scale error and ≤2% systematic offset; astrometric scatter includes a ≥0.24″ systematic; completeness limitations near bright sources and Galactic plane; 9″ resolution below Dec 10°.
- Polarimetry for magnetism and Faraday studies
- Sector(s): Academia (cosmic magnetism, space physics)
- What: Exploit publicly released Stokes Q/U cubes and V images to map magnetised structures (e.g., RM studies of the Milky Way/ICM) and to search for circularly polarized emission (stellar/planetary radio, coherent emitters).
- Tools/workflows: RM-synthesis on LoTSS Q/U data; integration with higher-frequency surveys to model Faraday screens.
- Assumptions/dependencies: Direction-dependent calibration quality varies across facets; ionospheric and beam-model residuals may limit absolute RM accuracy in complex regions.
- Custom reprocessing for diffuse emission and time-domain science
- Sector(s): Academia (transients, galaxy clusters), Software (imaging and calibration)
- What: Reuse the public uv data with direction-dependent calibration solutions to tailor imaging (e.g., enhanced sensitivity to diffuse halos/relics) or to produce snapshot images for transient searches.
- Tools/workflows: DDF-pipeline, DP3, WSClean, DDFacet, kMS; recommended workflows in the release documentation; transient-search snapshots as in prior work cited in the paper.
- Assumptions/dependencies: Requires HPC resources and LOFAR calibration expertise; image artefacts more likely near bright sources (“A-team”); uv reprocessing benefits from updated masks and facet selection.
- Sky-model building for low-frequency telescope calibration
- Sector(s): Academia (observatories), Software (instrument calibration)
- What: Use LoTSS-DR3 as a 144 MHz sky model for calibration of LOFAR and other low-frequency arrays (e.g., MWA, ASKAP low bands, pathfinders).
- Tools/workflows: Source lists with positions and spectral indices; flux-scale alignment with NVSS; per-field flux-plane corrections that reduce relative variations from ~20% to ~4%.
- Assumptions/dependencies: Residual position- and facet-dependent flux-scale variations remain; beam-model imperfections are known contributors.
- PB-scale data engineering patterns for distributed HPC
- Sector(s): Software/Cloud/HPC, Research infrastructure, SKA Regional Centres
- What: Adopt LoTSS-DR3’s end-to-end workflow patterns for petabyte-scale processing: multi-site archival (LTA), distributed computing across heterogeneous clusters (SURF, JUWELS, University of Hertfordshire, etc.), centralized processing registry, and data movement via dCache.
- Tools/workflows: LINC+DDF-pipeline orchestration; containerized execution; job accounting and provenance tracking; AOFlagger-based RFI mitigation; demixing operations for strong off-axis sources.
- Assumptions/dependencies: Requires sustained bandwidth/storage across sites; local ops support; governance for data movement and provenance.
- Automated quality control (QC) for large-scale imaging
- Sector(s): Software (QA/QC for sensing/imaging), Remote sensing/Geospatial analytics
- What: Repurpose LoTSS-DR3’s QC methods—dynamic-range-limited area detection, facet failure scoring (noise Gaussian fits, astrometric offsets, boundary discontinuities)—as generic QC templates for large, tiled imagery.
- Tools/workflows: PyBDSF-derived residual statistics; facet-wise figure-of-merit; automated masking of failed regions during mosaicking.
- Assumptions/dependencies: QC thresholds require domain tuning; automated flags should be complemented by spot checks in complex regions.
- Interference suppression analogs for RF systems
- Sector(s): Telecom/Signal processing, Spectrum management, Defense
- What: Apply “demixing” and A-team clipping practices to mitigate strong off-axis interferers and wide-field sidelobe contamination in other sensor systems.
- Tools/workflows: Predictive subtraction of strong signals via phase rotation and gain solving; threshold-based clipping regimes.
- Assumptions/dependencies: Requires accurate sky/interferer models and propagation knowledge; adaptation to non-astronomical bands involves re-estimation of thresholds and system responses.
- Efficient tiling and mosaicking with HEALPix
- Sector(s): Software (geospatial tiling), Earth observation, Map services
- What: Adopt the HEALPix-centred tile generation and per-tile reprojection strategy to cover large areas with minimal duplication and consistent boundaries.
- Tools/workflows: HEALPix NSIDE=16 tiling; per-facet regridding; edge blanking outside formal tile bounds; weighted co-adds by per-facet RMS and beam.
- Assumptions/dependencies: Requires careful handling of PSF/beam variations; proper weighting by local noise is essential for uniform sensitivity.
- Education, citizen science, and outreach content
- Sector(s): Education, Public engagement
- What: Use the visually rich, wide-field images for curricula on radio astronomy and data-intensive science; launch citizen science projects (e.g., radio galaxy morphology classification, SNR identification).
- Tools/workflows: Web map viewers; simplified catalog queries; curated datasets for coursework.
- Assumptions/dependencies: Requires user-friendly interfaces and documentation; data volume implies server-side cutouts for broad accessibility.
- Evidence for spectrum policy and radio-quiet zoning
- Sector(s): Policy/regulation, Research infrastructure planning
- What: Leverage LoTSS-DR3’s sensitivity and dynamic-range limitations near bright sources and RFI to argue for spectrum protection, quiet zones, and compliant device standards in relevant VHF bands.
- Tools/workflows: Sensitivity-declination curves; dynamic-range-limited area summaries; case studies near “A-team” sources.
- Assumptions/dependencies: Policy impact depends on national frameworks and stakeholder engagement.
Long-Term Applications
- Next-generation direction-dependent calibration for SKA-Low and beyond
- Sector(s): Academia (instrumentation), Software (calibration)
- What: Generalize the 45-direction kMS/DDFacet calibration and facetwise QC to SKA-Low-scale arrays for routine wide-field, high-dynamic-range imaging.
- Tools/products: Scalable, containerized DDE calibration suites; automated facet selection and failure recovery; beam-model integration.
- Assumptions/dependencies: Requires improved beam models and robust automation to reduce per-field operator effort and compute cost.
- Global 150 MHz sky model for cross-instrument calibration and propagation studies
- Sector(s): Observatories, Telecom/Propagation modeling, Space weather
- What: Fuse LoTSS-DR3 with southern surveys (GLEAM-X, EMU) to build a global sky model for telescope calibration and VHF propagation simulations.
- Tools/products: Calibrated, all-sky source and diffuse emission models with spectral indices; APIs for simulators and calibration pipelines.
- Assumptions/dependencies: Harmonized flux scales across surveys; improved diffuse emission recovery at low surface brightness.
- Operational ionospheric and RM foreground products
- Sector(s): Space weather operations, GNSS augmentation, CMB/21-cm cosmology
- What: Transform Q/U products and time-stamped LoTSS metadata into ionospheric Faraday/TEC proxies and RM foreground templates for operational pipelines (e.g., GNSS corrections, foreground subtraction).
- Tools/products: Near-real-time RM maps; historical climatologies across the solar cycle; interfaces to GNSS/CMB/EoR pipelines.
- Assumptions/dependencies: Requires robust disentangling of ionospheric and astrophysical Faraday contributions; tighter absolute RM calibration.
- Automated multi-wavelength source classification at scale
- Sector(s): Academia (cosmology, galaxy evolution), Software (ML/AI)
- What: Train and deploy ML models on 10M+ radio sources (with optical/IR IDs and photometric redshifts, where available) to produce value-added catalogues (morphologies, host properties, redshifts, AGN/SF labels).
- Tools/products: Open ML benchmarks and pre-trained models; cross-match services; uncertainty-aware catalog releases.
- Assumptions/dependencies: Comprehensive, uniform cross-identifications; bias-aware training to handle resolution and sensitivity variations.
- Real-time transient and variable source alerting with LOFAR2.0
- Sector(s): Time-domain astronomy, Multi-messenger coordination
- What: Evolve snapshot imaging workflows into near-real-time alert systems for low-frequency transients (stellar/planetary radio bursts, coherent emitters), integrated with community brokers.
- Tools/products: Low-latency imaging pipeline using pre-computed DDE solutions; VOEvent streams; follow-up coordination tools.
- Assumptions/dependencies: Requires runtime reductions and stable, automated calibration; robust RFI excision in rapid cadence modes.
- Commercial-grade calibration and interference mitigation software
- Sector(s): Telecom/Signal processing, Remote sensing, Defense
- What: Productize demixing, direction-dependent gains, and spatially varying flux correction techniques for distributed sensor arrays and passive/active RF systems.
- Tools/products: Licensed SDKs or open-core platforms; integration with existing RF toolchains; support services.
- Assumptions/dependencies: Demonstrated translation to non-astronomical environments; business model and IP strategy; validation datasets.
- Diffuse emission and magnetic field tomography of the cosmic web
- Sector(s): Academia (large-scale structure)
- What: With deeper, improved beam models and stacking techniques, reconstruct faint diffuse synchrotron and magnetic field structures across the cosmic web.
- Tools/products: Stacking pipelines; RM grids; simulation-informed inversions.
- Assumptions/dependencies: Enhanced surface-brightness sensitivity and beam control; synergy with higher-frequency and X-ray surveys.
- Standards and best practices for PB-scale scientific data operations
- Sector(s): Research infrastructure, Policy/funders
- What: Codify LoTSS-DR3’s multi-site LTA, orchestration, and provenance approaches into community standards for SKA-era operations.
- Tools/products: Recommendations for data lifecycle, compute allocation, and cross-site synchronization; compliance checklists for centers.
- Assumptions/dependencies: International coordination and funding alignment; interoperability across tooling stacks.
- Cross-sector training and workforce development
- Sector(s): Education, Workforce development
- What: Build curricula and professional training that leverage LoTSS-DR3 for hands-on HPC, signal processing, and ML—skills transferable to many data-intensive sectors.
- Tools/products: Course modules, capstone projects, online labs using subsets of LoTSS data and pipelines.
- Assumptions/dependencies: Sustained access to compute resources for teaching; curated, right-sized datasets for instruction.
Notes on Key Dependencies and Assumptions (across applications)
- Data access and tooling: Public availability of images, catalogues, uv data, and calibration solutions is essential; user-friendly APIs and documentation amplify impact.
- Calibration/beam models: Current LOFAR beam-model imperfections drive spatial flux-scale systematics; improvements will unlock tighter absolute calibration and better diffuse emission fidelity.
- Error budgets: Users must incorporate 6% random flux-scale error, ≤2% systematic offset, and ≥0.24″ astrometric systematic into analyses; completeness is ≥95% only for compact sources >9× local RMS, with reliable bin-wise counts above ~45× local RMS.
- Compute/storage: Many advanced uses (custom imaging, ML at scale, real-time alerts) require significant HPC resources and data engineering capacity.
- Sky coverage nuances: DR3 excludes most regions within 10° of the brightest radio sources and has lower resolution (9″) below Dec 10°; Galactic plane regions remain challenging.
- RFI and dynamic range: Operational environments with strong sources or RFI need tailored mitigation (demixing, clipping); QC methods help identify affected areas.
Glossary
- A-team clipping: A flagging strategy that removes data segments contaminated by very bright off-axis sources. "baselines and time intervals are instead flagged (`A-team clipping') if the predicted signal from these sources (and also Taurus A, Hercules A or Virgo A) exceeds the observatory recommended threshold of 5\,Jy."
- AOFlagger: A tool for automated detection and removal of radio-frequency interference in radio astronomy data. "The data are flagged using AOFlagger (\citealt{Offringa_2012})"
- astrometric accuracy: The precision of measured source positions on the sky, often improved by aligning with high-accuracy reference catalogues. "We improved the astrometric accuracy of our images by aligning them with the Pan-STARRS DR2 optical catalogue"
- baselines: The distances between pairs of interferometric antennas, determining resolution and sampling of spatial frequencies. "baselines 40\,m to 3,700\,m"
- beam model: A representation of the telescope’s directional sensitivity pattern used to correct images for instrumental response. "errors in the current LOFAR beam model may play a role."
- deconvolution: The process of removing instrumental point-spread function effects from radio images to recover true source structure. "creating refined masks for deconvolution"
- demixing technique: A method to subtract bright off-axis sources by calibrating visibilities in their direction and removing their predicted contribution. "using the demixing technique (\citealt{vandertol_2007})"
- DDF-pipeline: A calibration and imaging pipeline for LOFAR data that performs direction-dependent self-calibration and imaging. "DDF-pipeline performs a direction-dependent self-calibration"
- DDFacet: An imaging tool that applies direction-dependent calibration solutions during image formation. "DDFacet (\citealt{Tasse_2018}) for imaging with the derived solutions applied."
- direction-dependent calibration: Calibration that varies across the field of view to correct position-dependent effects (e.g., ionosphere, beam). "direction-independent and direction-dependent calibration pipelines"
- direction-independent calibration: Calibration that assumes a uniform correction across the field of view (e.g., bandpass, clocks). "direction-independent and direction-dependent calibration pipelines"
- DP3: A LOFAR data processing tool for averaging, calibration, and selection of interferometric datasets. "averaged in DP3 (\citealt{vanDiepen_2018})"
- Dysco: A compression scheme for interferometric data that reduces storage while preserving scientific fidelity. "compressed using Dysco with a bit rate of 10 (\citealt{Offringa_2016})"
- dynamic spectra: Time–frequency representations of radio emission used to study variability and transient behavior. "dynamic spectra of selected variable sources"
- Euclidean-normalised differential source counts: Source counts scaled by flux density to remove geometric effects, enabling population comparisons across surveys. "The Euclidean-normalised differential source counts derived from the survey constrain the radio source population"
- facets: Subdivisions of the field used for local calibration and imaging to manage direction-dependent effects. "generally calibrating the data in 45 different directions (facets)"
- Faraday rotation measure: A measure of the rotation of the polarization angle due to magnetized plasma along the line of sight. "direction-independent ionospheric Faraday rotation measure"
- flux density scale: The calibration of measured fluxes to a standard reference ensuring accurate brightness measurements. "The random flux density scale error is 6\%"
- HEALPix: A hierarchical equal-area pixelization of the sphere used for dividing and mosaicking the sky uniformly. "The sky was divided into equal-area HEALPix\footnote{\cite{Gorski_2005}: \url{https://healpix.sourceforge.io/} pixels"
- High Band Antenna (HBA): The LOFAR antenna system operating at high radio frequencies (approx. 110–240 MHz). "High Band Antenna, HBA, Dual Inner mode"
- interferometric: Pertaining to techniques that combine signals from multiple antennas to form high-resolution images. "techniques: interferometric"
- ionospheric distortions: Spatial and temporal phase errors caused by the Earth’s ionosphere that blur or shift radio images. "spatially and temporally varying ionospheric distortions."
- kMS: A solver for direction-dependent calibration that estimates gains in multiple directions simultaneously. "kMS (\citealt{Tasse_2014} and \citealt{Smirnov_2015}) for simultaneously deriving calibration solutions in a number of directions"
- LINC: The LOFAR Initial Calibration pipeline that applies direction-independent calibration steps before DD calibration. "utilises the LOFAR Initial Calibration pipeline (LINC\footnote{\url{https://linc.readthedocs.io/en/latest/}; \citealt{deGasperin_2019}, previously called PreFactor) for direction-independent calibration"
- LOFAR Long Term Archive (LTA): The storage infrastructure where LOFAR observational data products are archived. "before being archived in the LOFAR Long Term Archive (LTA\footnote{\url{https://lta.lofar.eu/})"
- mosaicking: Combining multiple overlapping images into a single, larger image with weighted contributions. "During mosaicking, each individual pointing image is cut at the 30\% level of the power primary beam"
- NVSS: The NRAO VLA Sky Survey, a 1.4 GHz survey used for flux scale comparison and calibration. "NRAO VLA Sky Survey (NVSS: \citealt{Condon_1998})"
- Pan-STARRS DR2: An optical sky survey catalog used to refine radio astrometry via cross-matching. "Pan-STARRS DR2 optical catalogue (\citealt{Flewelling_2020})"
- primary beam: The sensitivity pattern of an antenna, defining the effective field of view and weighting in mosaics. "30\% level of the power primary beam"
- PyBDSF: A Python tool for source detection and characterization in radio images. "Python Blob Detector and Source Finder (PyBDSF; \citealt{Mohan_2015}; version 1.10.3)"
- RMS noise: The root-mean-square image background level used to quantify sensitivity. "root mean square (RMS) noise of 100Jy beam"
- self-calibration: Iterative calibration using the target data themselves to improve image quality and reduce errors. "DDF-pipeline performs a direction-dependent self-calibration"
- spectral index: The exponent α describing how flux density scales with frequency, . "The spectral index, , is defined throughout the paper as "
- Stokes parameters: Quantities (I, Q, U, V) describing total intensity and polarization state of radio emission. "Stokes I, Q, U, and V images"
- TGSS-ADR1: A low-frequency sky survey used as a model for initial phase calibration. "the phase is calibrated using the TGSS-ADR1 model of the field"
- time- and bandwidth-smearing: Blurring of sources due to finite integration time and channel width, especially on long baselines. "time- and bandwidth-smearing effects"
- uv data: Visibility measurements in the spatial-frequency domain sampled by interferometers. "and data with associated direction-dependent calibration solutions."
- visibilities: The complex correlation measurements between antenna pairs that are the fundamental interferometric data. "its contribution to the input visibilities."
- WSClean: A fast wide-field radio imaging package used to form interferometric images. "WSClean (\citealt{Offringa_2014}) for imaging"
Collections
Sign up for free to add this paper to one or more collections.