- The paper reveals that mid-to-late M dwarfs lack the bimodal Radius Valley seen in higher-mass stars, indicating a reduced impact of atmospheric loss mechanisms.
- The study employs a robust transit survey of 8,134 stars with Gaia DR3 filtering and injection–recovery tests that confirm high detection completeness.
- The findings support water-rich formation scenarios with a dominant planet population peaking at 1.25±0.05 R⊕ and a negligible occurrence of hot Jupiters.
TESS Occurrence Rates and the Disappearance of the Radius Valley Around Mid-to-Late M Dwarfs
Survey Design and Target Characterization
This study presents a comprehensive transit survey of 8,134 mid-to-late M dwarfs observed by TESS, spanning stellar masses 0.1−0.4M⊙. Detailed filtering using Gaia DR3 astrometry and photometry ensures purity from binary contaminants and over-luminous sources. Stellar parameters (radius, mass, luminosity, effective temperature) are derived via empirical calibrations and band-dependent bolometric corrections.
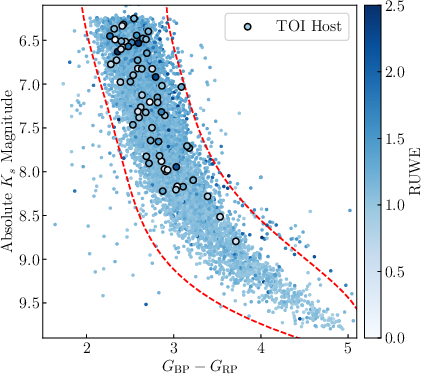
Figure 1: MKs/$G_{\mathrm{BP}-G_{\mathrm{RP}}$ color-magnitude diagram highlighting color cuts applied to the target sample to remove contaminant populations.
Target selection leverages the redder TESS bandpass (600–1000 nm) for improved photometric sensitivity to these cool stars versus Kepler’s more limited capacity. The resulting sample enables robust demographic analyses inaccessible from prior surveys.
Transit Search Pipeline and Sensitivity Characterization
Light curves from TESS sectors 1–86 are cleaned for instrumental and astrophysical systematics. Flare and rotational variability are excised using change-point algorithms and Gaussian process (GP) detrending with celerite2 kernels. Detrending reliability is validated via injection–recovery tests, demonstrating that GP-induced transit depth degradation is minimal for Rp/R⋆<0.05 (10% bias).
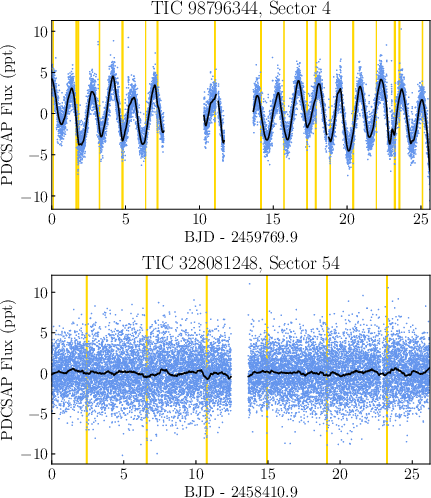
Figure 2: Example M dwarf light curves after flare and variability removal, with transit events highlighted and trends overplotted.
Periodic transit signals are detected using Transit Least Squares (TLS), with statistical and astrophysical false positive filtration via TRICERATOPS and exovetter. Vetting includes centroid offset analysis, requiring >1% on-target probability.
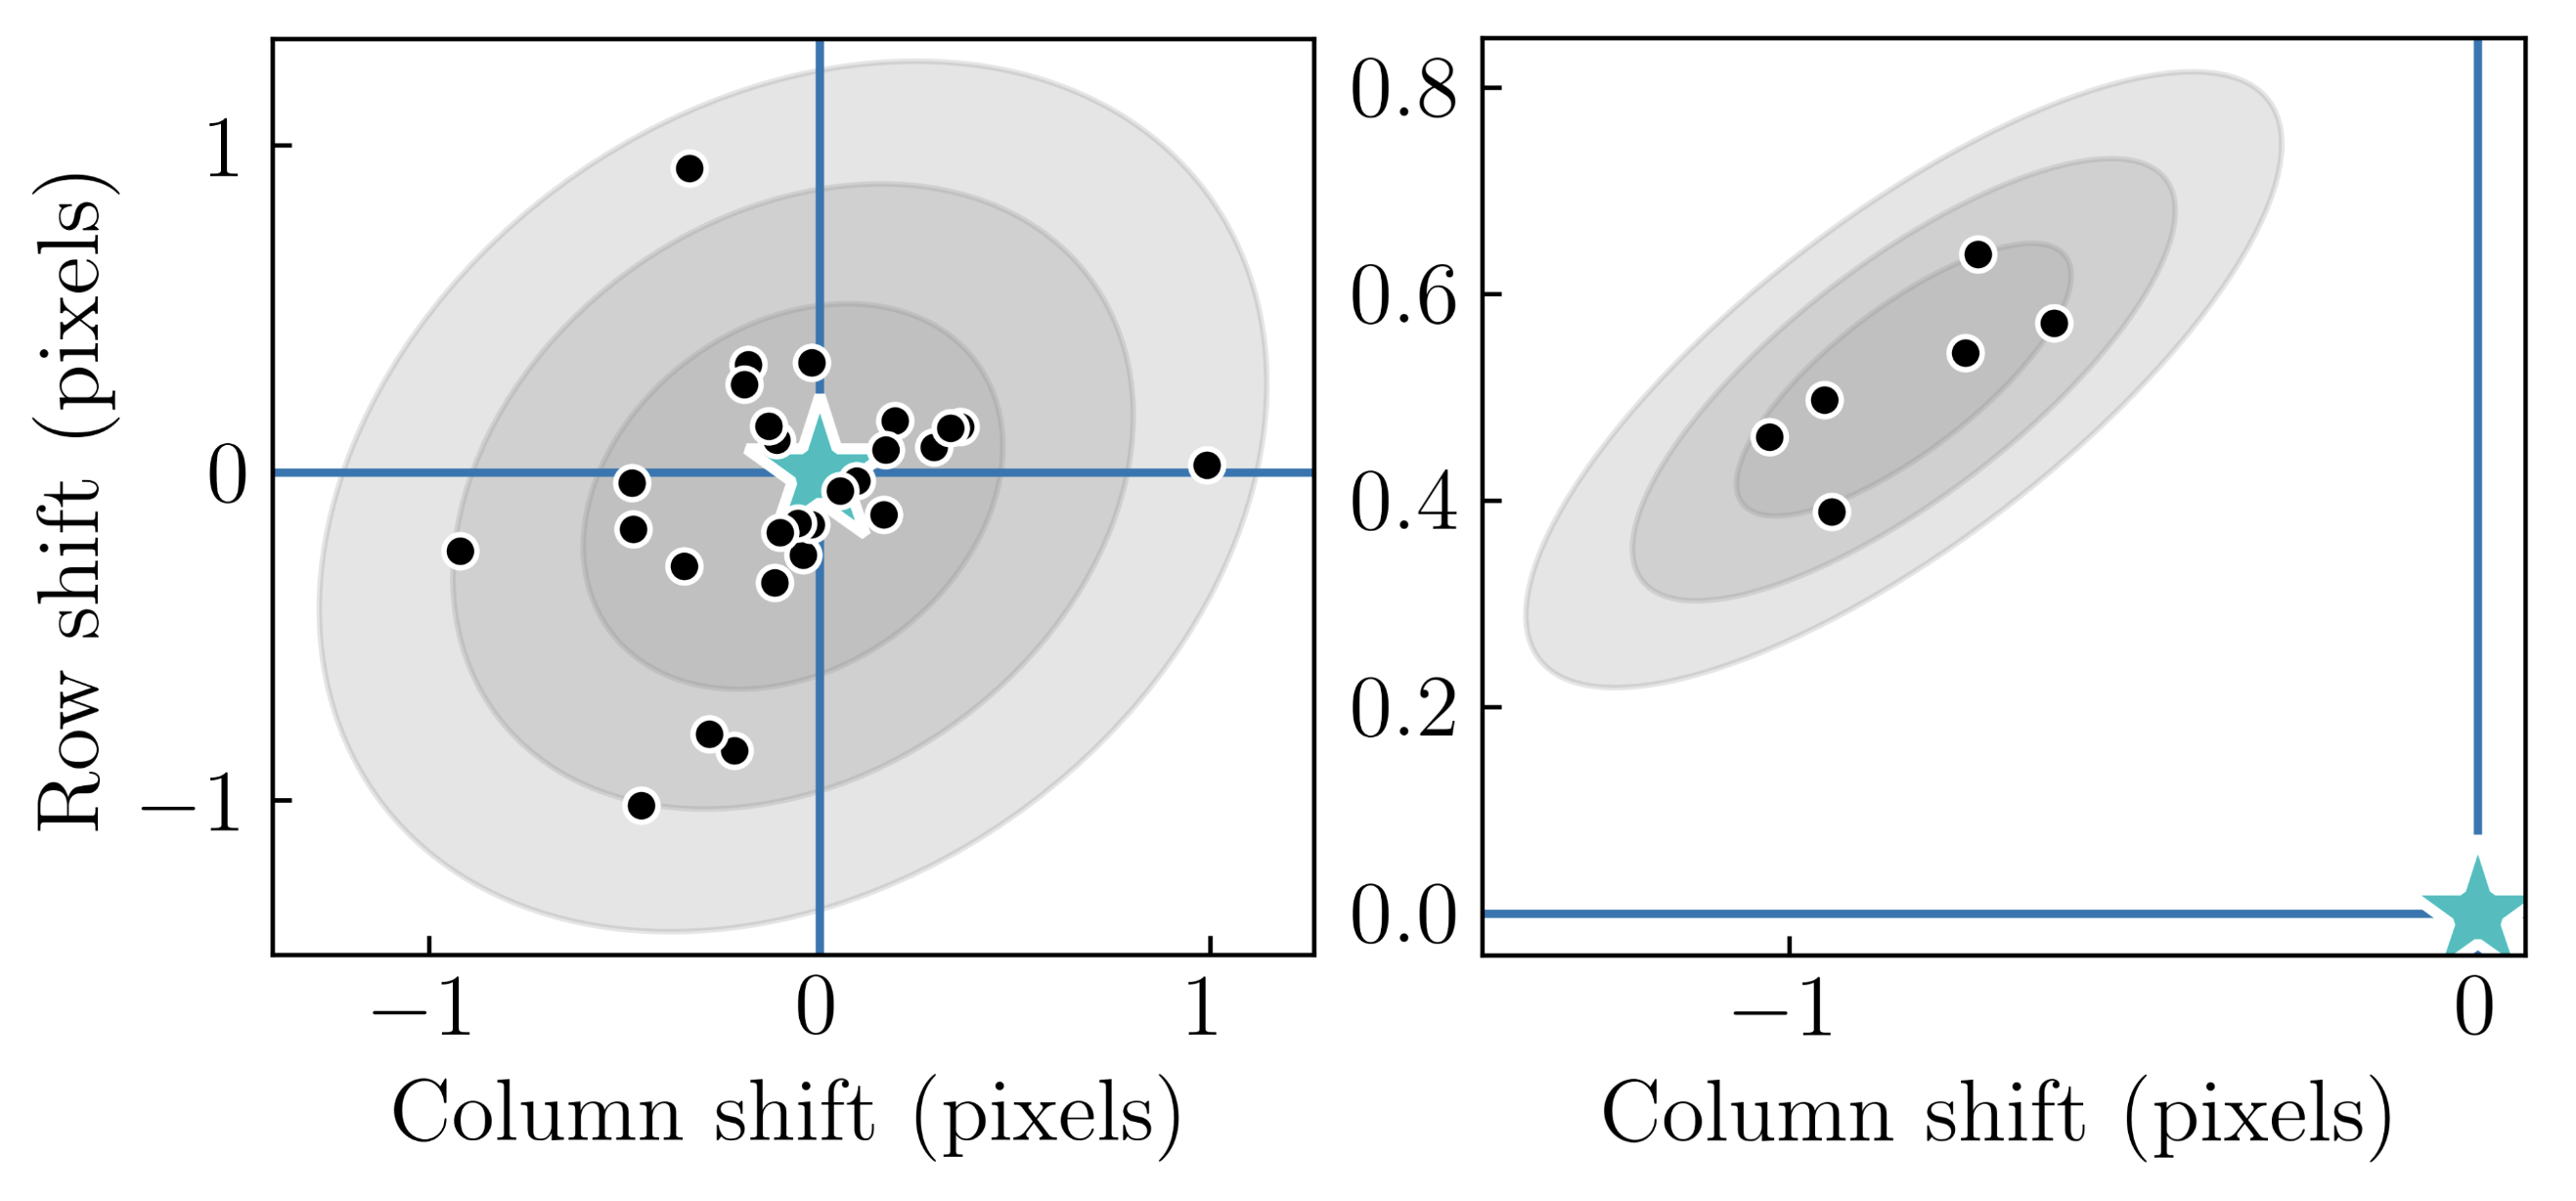
Figure 3: In-transit centroid offset comparison for high vs. low on-target probability PCs.
Detection efficiency is mapped by a hierarchical injection–recovery process, stratified by TESS magnitude and rotation. Sensitivity declines steeply for Rp<1R⊕ and P>14 days due to limited sector overlaps and target faintness.
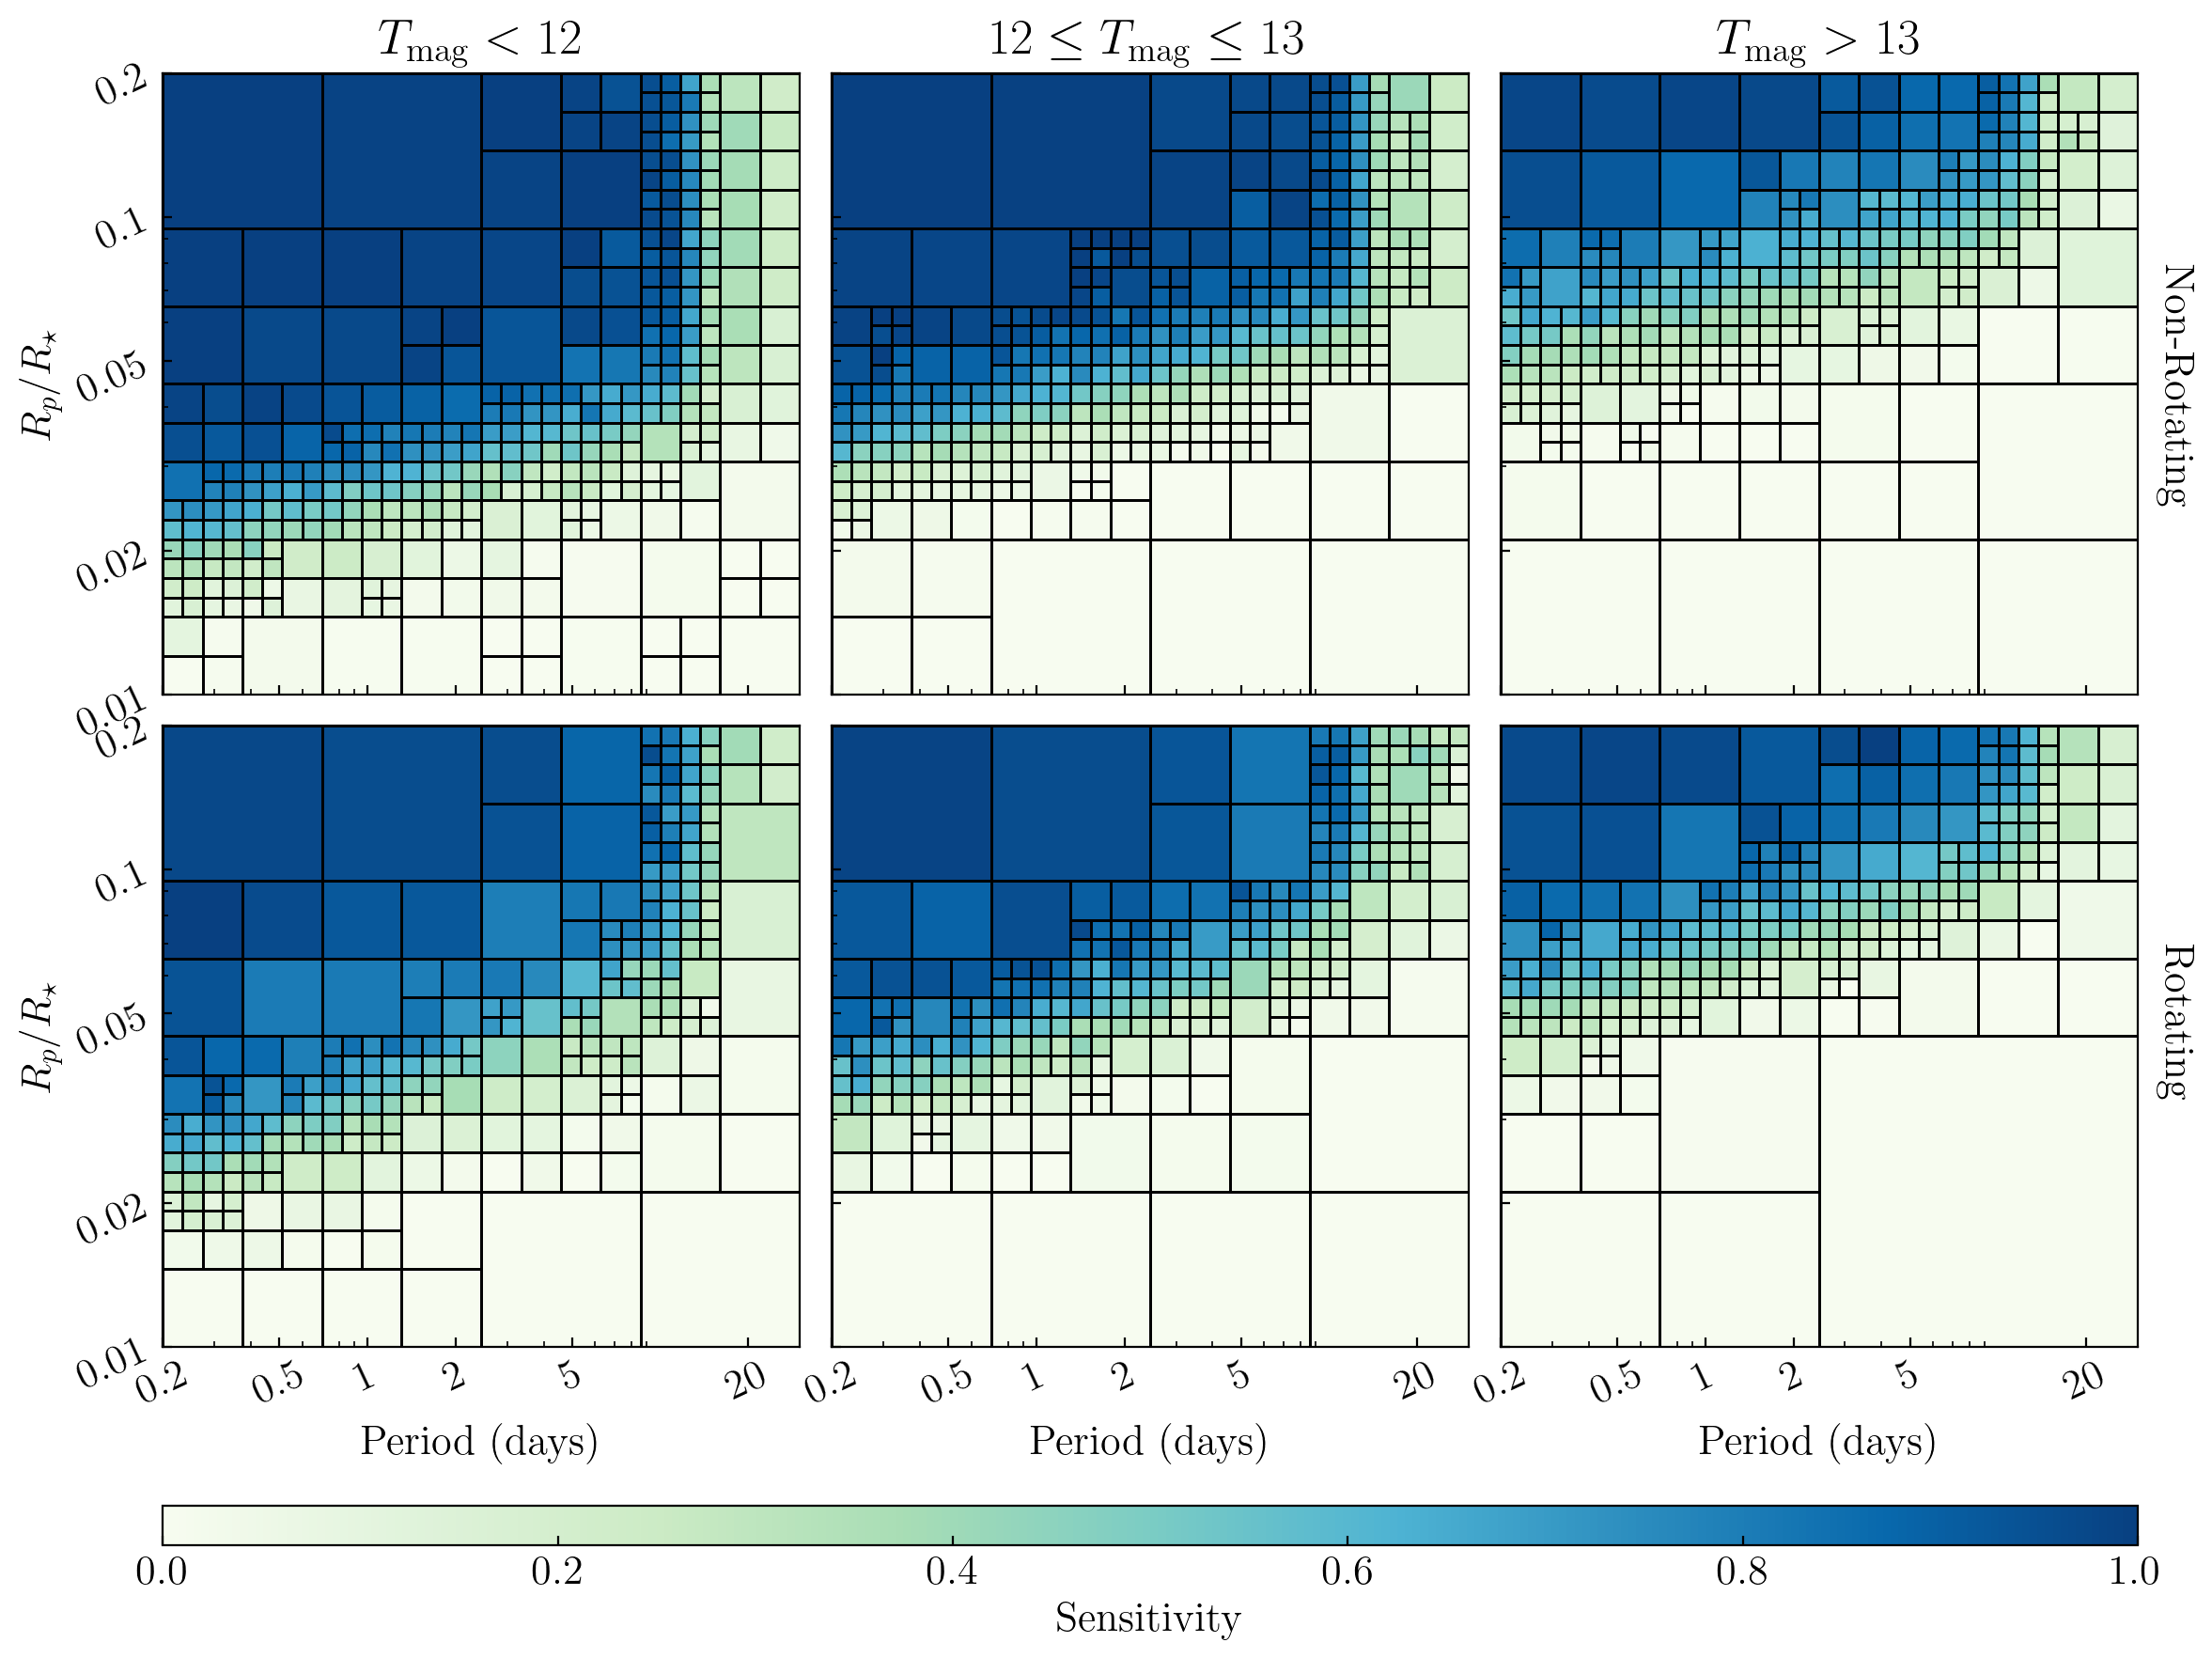
Figure 4: Injection/recovery maps visualizing pipeline sensitivity across period–Rp/R⋆ space for each target bin.
Radius recovery bias is quantified, confirming Rp,rec/Rp,inj=0.96±0.05 for median-filtered light curves and 0.86−0.20+0.10 for GP-detrended, with lower impact at small radii.
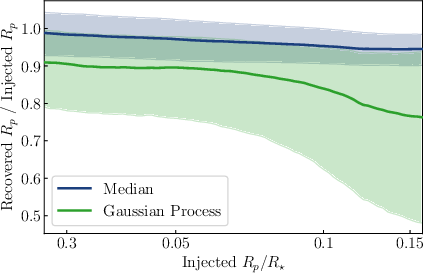
Figure 5: Transit radius recovery bias as a function of injected Rp/R⋆ for median and GP detrending models.
Combined sensitivity and geometric transit probability yield completeness corrections for occurrence rate calculation.
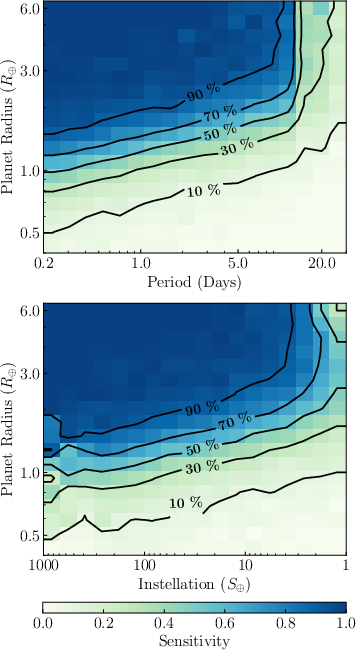
Figure 6: Average survey sensitivity as a function of period, radius, and instellation.
Planet Population and Occurrence Rate Inference
The vetted survey yields 77 planet candidates (PCs) around 65 stars, with robust removal of statistical and astrophysical false positives.
Two-dimensional occurrence rates in period–radius (f(P,Rp)) and instellation–radius (f(S,Rp)) space reveal a unimodal planet population peaking at 1.25±0.05R⊕, absent of the bimodal Radius Valley seen in FGK and early-M hosts.
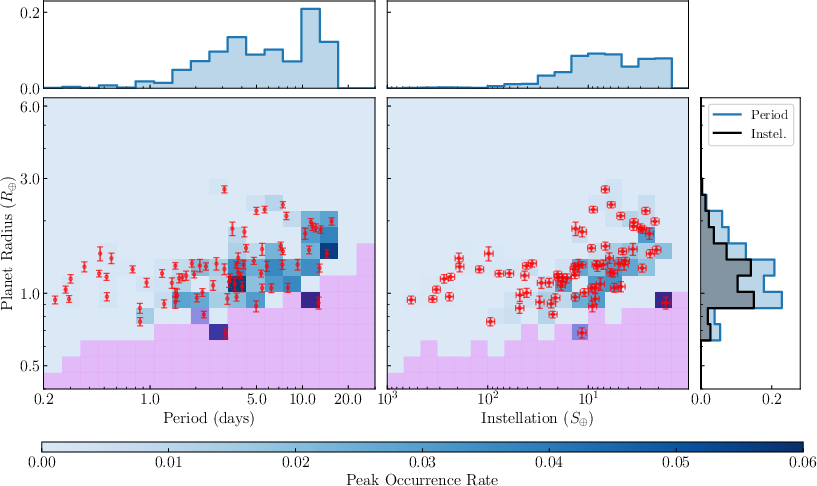
Figure 7: Distribution of detected planets in period–radius and instellation–radius space, with occurrence rate density grids.
Detection completeness recovers all 36 confirmed planets and 93% of TOIs in the sample as of October 2024, demonstrating high fidelity for Rp>1R⊕ and P<14 days.
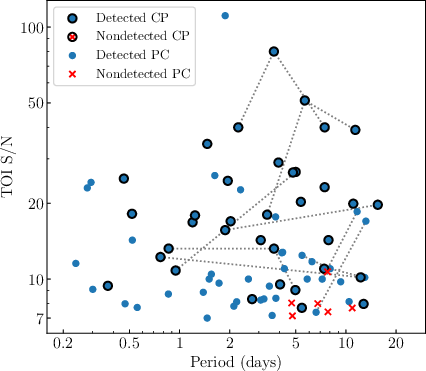
Figure 8: Survey TOI recovery as a function of orbital period and transit S/N, with detected and missed TOIs contrasted.
Occurrence rates are derived using binomial estimation within completeness-corrected grid cells. Sub-Earth planets are rare due to limited sensitivity; the dominant population comprises super-Earths (Rp=1−1.6R⊕) with an occurrence of $0.954$ per star. Sub-Neptunes (Rp=1.8−3R⊕) are suppressed, at $0.148$ per star, a 5.5:1 ratio.
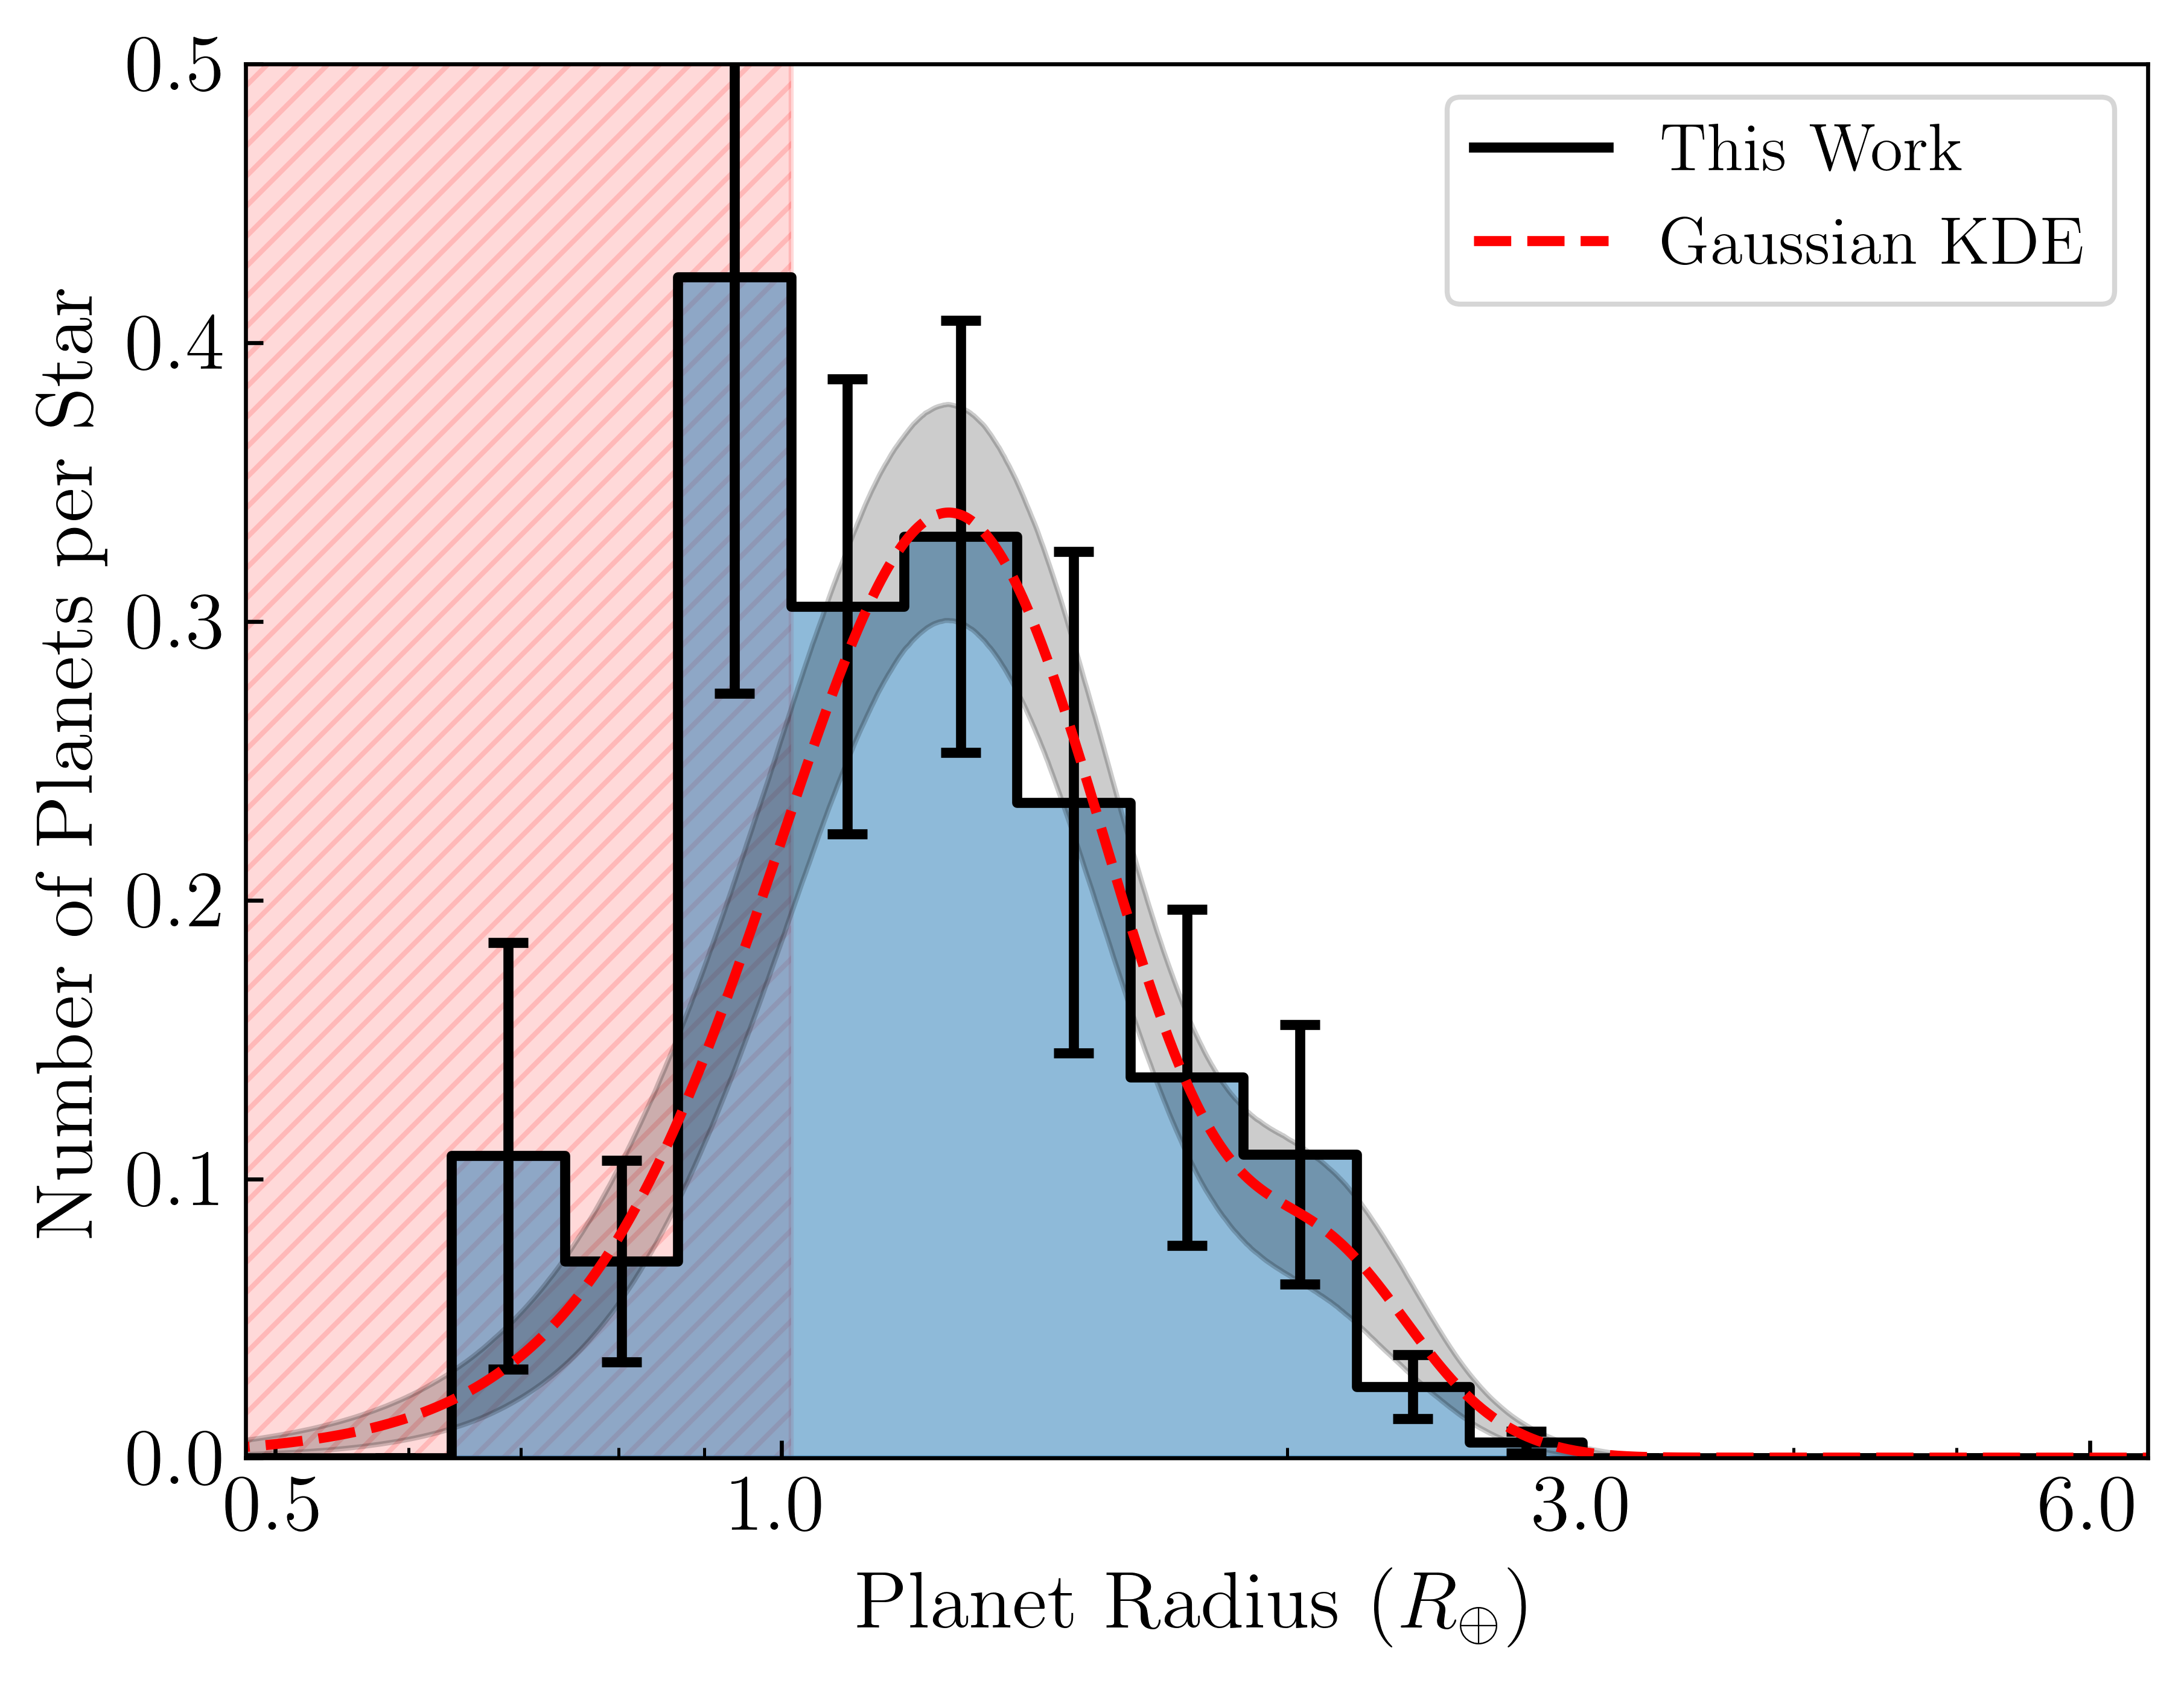
Figure 9: Radius-structured occurrence rate distribution, confirming unimodality and the absence of a Radius Valley.
Comparisons against FGK and early-M surveys show that mid-to-late M dwarfs lack the prominent Radius Valley structure found around higher-mass stars.
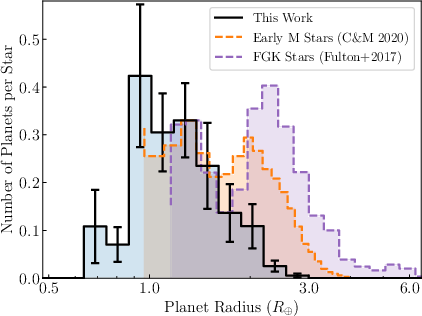
Figure 10: Comparative occurrence rates from independent transit surveys, showing the disappearance of the Radius Valley in the present sample.
Cumulative occurrence rates for Rp>1R⊕ and P<30 days yield $1.10$ planets per star, matching values from earlier-M surveys and establishing the collective M dwarf population as the most prolific hosts of small, close-in planets.
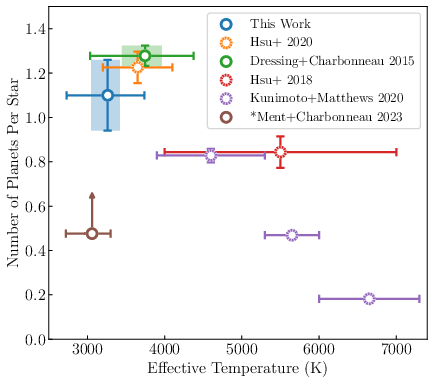
Figure 11: Cumulative occurrence rates spanning 1−4R⊕ and P<30 days as a function of Teff.
The population's unimodality is further contextualized with theoretical models. The dearth of sub-Neptunes agrees with pebble accretion, water-rich formation scenarios, and NGPPS planetary synthesis predictions, which anticipate a fading Radius Valley with decreasing stellar mass.
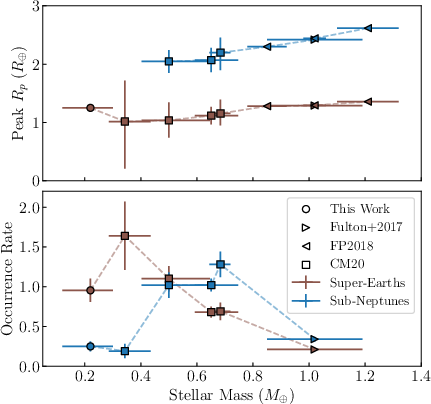
Figure 12: Stellar mass dependence of super-Earth and sub-Neptune population peaks and cumulative occurrence across spectral types.
Other notable findings include zero hot Jupiter detections (upper limit: <0.012 per star within 10 days) and weak constraints on habitable zone planet occurrence (terrestrial HZ upper limit: <0.351 per star).
Practical and Theoretical Implications
The absence of the Radius Valley around the lowest mass stars suggests that planetary atmospheric evolution, particularly photoevaporation and core-powered mass loss, is less impactful than water-driven formation/migration under low-mass disk regimes. The dominant population at 1.25R⊕ with low occurrence of enveloped sub-Neptunes strongly supports the overlapping rocky/water world hypothesis, favoring theoretical frameworks such as Venturini et al.’s water-rich scenario.
Comparative occurrence rates across stellar mass indicate nearly constant super-Earth abundance and sharp sub-Neptune suppression below 0.5M⊙, consistent with predictions from disk mass and migration models. Future studies with radial velocity follow-up and atmospheric spectroscopy (e.g., JWST) are essential to differentiate rocky and water-rich sub-Neptunes and confirm compositional inferences.
Future Directions in Exoplanet Demographics
Advancements in target selection, injection–recovery granularity, and multi-sector TESS analyses will enhance sensitivity to longer-period and smaller-radius planets. Combining TESS and future missions (e.g., PLATO) for extended baseline photometry, alongside systematic RV and transmission spectroscopy campaigns, will provide the necessary mass and atmospheric data required to test the water-rich hypothesis and refine planetary formation theory across the stellar mass spectrum.
Conclusion
This survey constitutes the most exhaustive demographic analysis of mid-to-late M dwarf exoplanet populations, demonstrating that the classical Radius Valley disappears at low stellar mass. The unimodal planet radius distribution, significant suppression of sub-Neptunes, and high cumulative occurrence rates place mid-to-late M dwarfs as primary hosts of small, close-in planets. The results bolster water-driven formation models and demand further observational constraints to elucidate compositional diversity and atmospheric evolution in the low-mass regime.