- The paper demonstrates that AMM mechanics in Bittensor subnets explicitly generate a size premium, with small subnets outperforming large ones by up to 1.01% daily.
- It applies rigorous causal inference using a token emission halving event, linking protocol parameters directly to factor premia.
- The study highlights that liquidity constraints and AMM-induced slippage set practical capacity limits for implementing SMB strategies.
Structural Origins and Empirical Characterization of Risk Factors in Decentralized AI Subnet Markets
Introduction
The paper "Common Risk Factors in Decentralized AI Subnets" (2603.29751) conducts a comprehensive analysis of risk and return in the Bittensor subnet marketplace, a novel intersection of decentralized finance and machine intelligence. Bittensor subnets employ constant-product automated market makers (AMMs) for token pricing, resulting in unique, mathematically driven factor structures. The study evaluates daily returns across 128 subnets and rigorously tests the presence and origins of systematic factors, focusing particularly on the size premium derived from AMM mechanics. Beyond empirical documentation, the paper leverages a token emission halving event for causal inference, establishing a transparent linkage between protocol parameters and factor premia.
Bittensor Network Architecture and Tokenomics
Bittensor is structured around 128 specialized subnets, each issuing tradable alpha tokens priced against TAO via AMM pools. Emission allocation and staking activities serve as primary capital inflow mechanisms, with each pool's depth directly reflecting subnet market capitalization and liquidity.
The constant-product AMM operates as:
pi=αiτi
where pi is the alpha token price, τi and αi are TAO and alpha reserves, respectively. Emission rewards, distributed based on validator scores, are staked back into AMM pools, reinforcing capital flows and price impact.
Factor Portfolio Construction and Returns
The main cross-sectional factors include market (MKT), small-minus-big (SMB), momentum (WML), emission yield (HMLEMIS), and liquidity (LIQ). Portfolios are constructed via tercile sorts on lagged characteristics:
- Size (SMB): Small subnets outperform large by 1.01% per day, with a Newey-West t=3.28; bottom tercile annualize to 317%, top tercile to -50%.
- Momentum: 30-day winners-minus-losers deliver 0.68% daily (NW t=3.69), 7-day variant yields 0.75% (NW t=3.05).
- Emission Yield: Not independently significant, but spanning tests show it captures additional return variation (t=2.11).
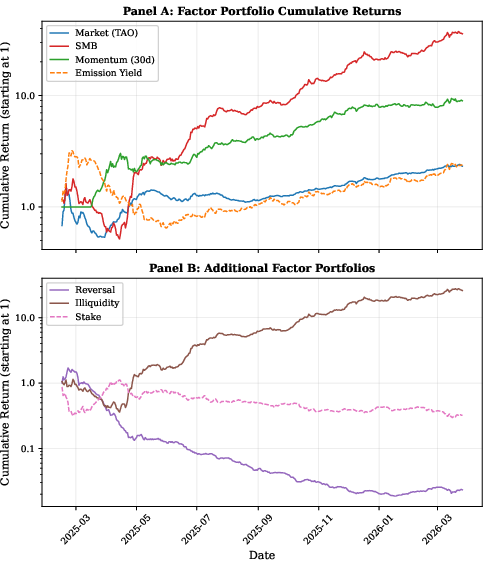
Figure 1: Cumulative returns of TAO-denominated factor portfolios, revealing dominant SMB and momentum performance across the sample.
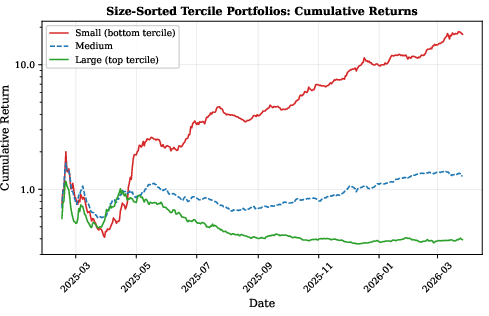
Figure 2: Size-sorted tercile portfolios display persistent outperformance by small subnets due to AMM-driven price impact.
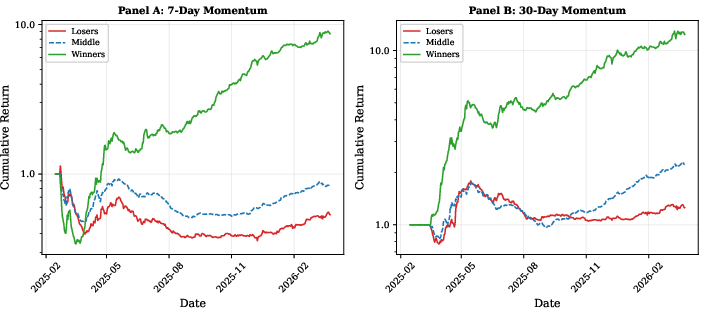
Figure 3: Momentum-sorted tercile portfolios illustrate strong return persistence via winners-minus-losers over both 7- and 30-day horizons.
Mechanistic Derivation of the Size Premium
Unlike equity markets, where the economic origins of the size premium are contested, the constant-product AMM induces an explicit arithmetic link:
pΔp≈τ2Δτ
This relationship (Proposition 1) asserts that for a fixed emission, percentage price change is inversely proportional to pool size, mechanistically generating SMB. Empirical inference leverages the TAO emission halving (December 2025), where the premium falls from 1.17% to 0.51% (post/pre ratio pi0, theory predicts pi1, pi2).
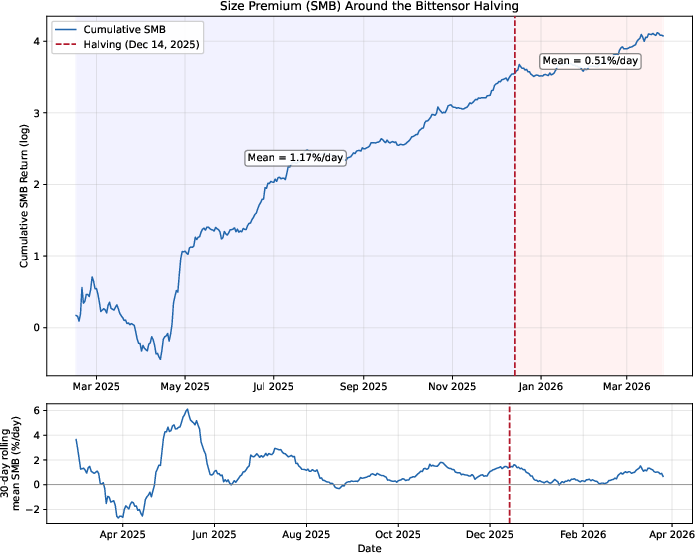
Figure 4: Cumulative SMB return and TAO halving; the flattening post-halving provides direct causal evidence for AMM-driven size premium.
Factor Correlation and Model Specification
SMB and liquidity exhibit near-perfect correlation (0.93), reflecting structural ties in AMM pools. Fama-MacBeth regressions find a significant cross-sectional SMB premium (0.80% daily, pi3), while momentum generates temporally persistent, but non-compensatory, returns (in line with time-series predictability, not risk compensation).
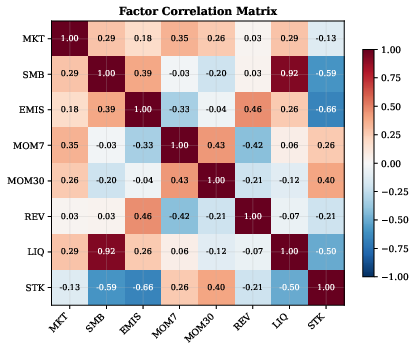
Figure 5: Factor correlation matrix, establishing high collinearity between SMB and LIQ and expected negative correlation between momentum and reversal.
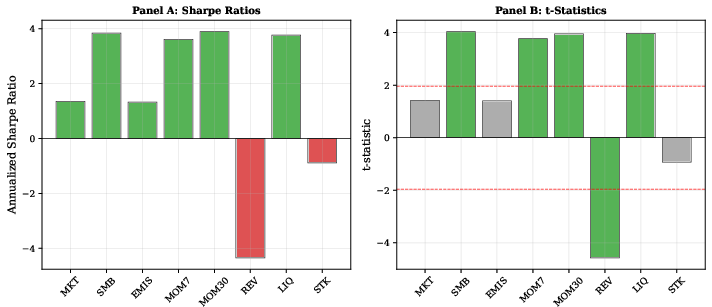
Figure 6: Factor Sharpe ratios and pi4-statistics; SMB and both momentum variants surpass significance thresholds, confirming robust sorting.
GRS tests on multifactor models fail to reject explanatory power for sorted portfolios (pi5, pi6).
Transaction Costs and Capacity Constraints
AMM slippage is deterministic:
pi7
Slippage scales linearly with AUM relative to pool depth. For typical small-tercile subnets (median pi8 TAO), SMB is only implementable below \$p_i$9100K, transaction costs negate returns.
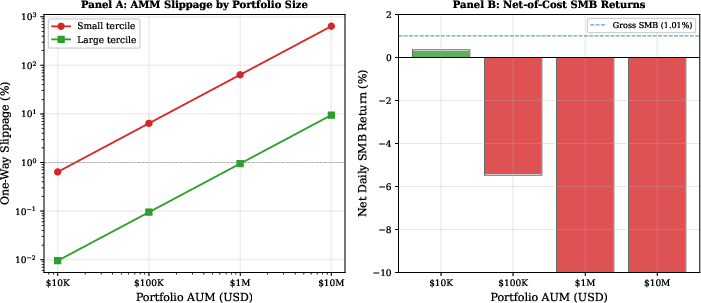
Figure 7: Deterministic AMM slippage and net-of-cost SMB, demonstrating liquidity-driven limits on strategy scalability.
Volatility, Downside Risk, and Anomaly Reversal
Contrary to equity markets, high-volatility and high-beta subnets outperform, reflecting AMM mechanics where small, thin pools amplify price movement. SMB displays favorable asymmetry: upside semi-deviation exceeds downside, Sortino ratio (4.90) surpassing Sharpe (3.84).
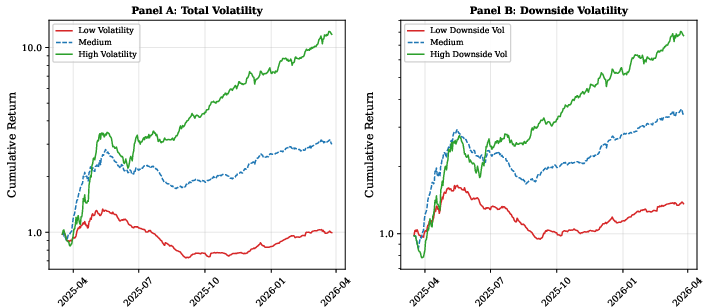
Figure 8: Volatility-sorted portfolios indicating positive risk-return association due to AMM-induced amplification.
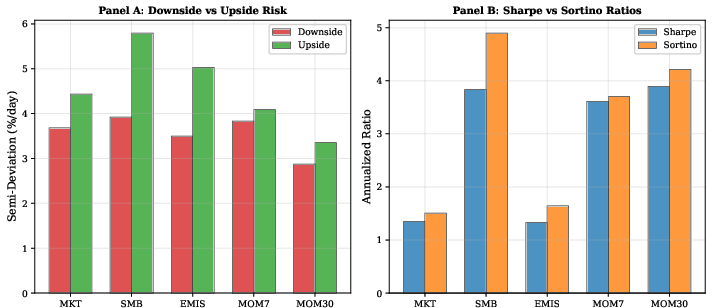
Figure 9: Downside vs upside semi-deviations and Sharpe vs Sortino ratios; SMB shows improved risk-adjusted performance via downside metrics.
Robustness and Limitations
TAO-denominated results are robust to USD conversion, though volatility increases and Sharpe declines. Subsample and characteristic sorts show persistent factor structure, with the premium attenuated by emission halving and market cross-section expansion. Survivor and entry effects are addressed via stringent sample filters and momentum masking.
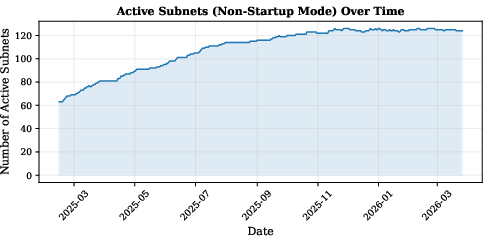
Figure 10: Expansion in number of active subnets over time, mitigating cross-sectional noise and volatility.
Emission Yield and Spanning Effects
While emission yield lacks standalone significance, spanning tests indicate it captures unspanned return variation, likely due to substantial differences in protocol reward intensity among subnets.
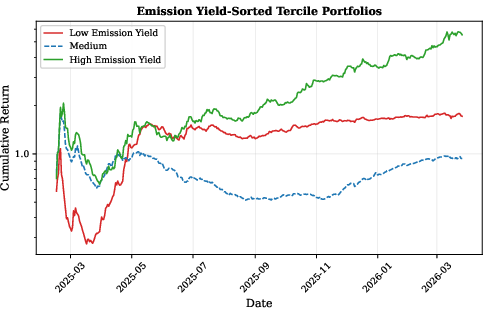
Figure 11: Emission yield-sorted portfolios with high-yield subnets demonstrating additional risk exposure.
Implications and Prospective Developments
The study establishes the first direct causal link between protocol parameter changes and factor premia, uniquely enabled by the transparency of AMM pricing and emission policy in Bittensor. As pool depths increase and market structure matures, it remains an open question whether mechanical premia persist or diminish under arbitrage pressure and enhanced liquidity. The structural analogy to equity markets (Kyle's price impact) suggests broader applications for protocol-native tokenomics in transparent asset pricing. Future research may investigate how evolving staking dynamics, validator strategies, and external capital flows modify the risk ecosystem of decentralized AI economies.
Conclusion
The paper rigorously demonstrates that risk premia in decentralized AI subnets are structurally generated by AMM mechanics and protocol emission rules. The dominant size effect, directly derived and causally tested via protocol halving, exists because implementable capacity remains below institutional thresholds due to deterministic liquidity constraints. The positive risk-return associations observed invert traditional equity anomalies, further underscoring the mechanical consequences of decentralized pricing. This setting, where factor origins and cross-sectional dynamics are fully transparent and exogenously testable, provides a fertile ground for theoretical and empirical advances in token economy asset pricing.