- The paper quantifies 'bubble breaking', showing that 78% of deprived areas experience exposure to less deprived environments beyond gravity model predictions.
- It employs high-resolution mobile phone GPS data and satellite-derived deprivation indices to empirically measure mobility-driven exposure in urban clusters.
- Findings highlight the roles of urban form, amenity composition, and spillover effects in facilitating cross-boundary movement that mitigates localized deprivation.
Measuring "Bubble Breaking" Mobility: Urban Deprivation Exposure in Indian and Mexican Cities
Introduction
The study "Urban mobility enables deprivation bubble breaking in Indian and Mexican cities" (2603.29782) constructs a systematic, empirical framework for investigating how daily mobility enables residents in deprived urban areas to experience more favorable socioeconomic conditions than their residential context would suggest. The central innovation is the quantification of "bubble breaking," defined as mobility-driven exposure to less deprived environments, by integrating high-resolution mobile phone mobility networks with satellite-derived spatial deprivation indices in 64 Indian and Mexican cities.
This work pivots from traditional residence-based deprivation assessments toward analyzing experienced exposure, testing whether the daily movement of individuals in highly unequal contexts systematically shifts their realized socioeconomic setting beyond what canonical urban models would predict. The study identifies the structural and behavioral determinants of bubble breaking, including the roles of urban form, amenity supply, and neighboring area effects, providing a granular lens on spatial inequality that extends beyond static urban geography.
Methodology and Metrics
Empirical mobility flows are reconstructed from anonymized GPS traces, mapped onto H3 hexagons (∼5 km²), for 64 spatial clusters in India and Mexico. Nodes carry attributes including NASA’s Global Gridded Relative Deprivation Index (GRDI), population density (GHSL), and local amenity information (POI data from Overture Maps). The study introduces several pivotal metrics:
- Bubble Breaking Indicator (Di): Quantifies deviation between the residential deprivation of home area i and the deprivation level of visited destinations, weighted by observed flow volumes.
- Gravity Model Baseline (Dit): Simulates expected exposure based on classical population and road network constraints.
- Residual Bubble Breaking (RBB): The empirical excess of bubble breaking over the gravity-model baseline, isolating the mobility component not attributable to urban structure.
Core Findings
Systematic Bubble Breaking Beyond Structural Expectations
The analysis reveals that 78% of areas show positive bubble breaking, indicating that the majority of urban residents, across both countries, experience systematically lower deprivation during daily activities compared to their home neighborhoods. The majority of this effect exceeds predictions from gravity-based models anchored to population and travel time constraints (Wilcoxon signed-rank test, p<0.001).
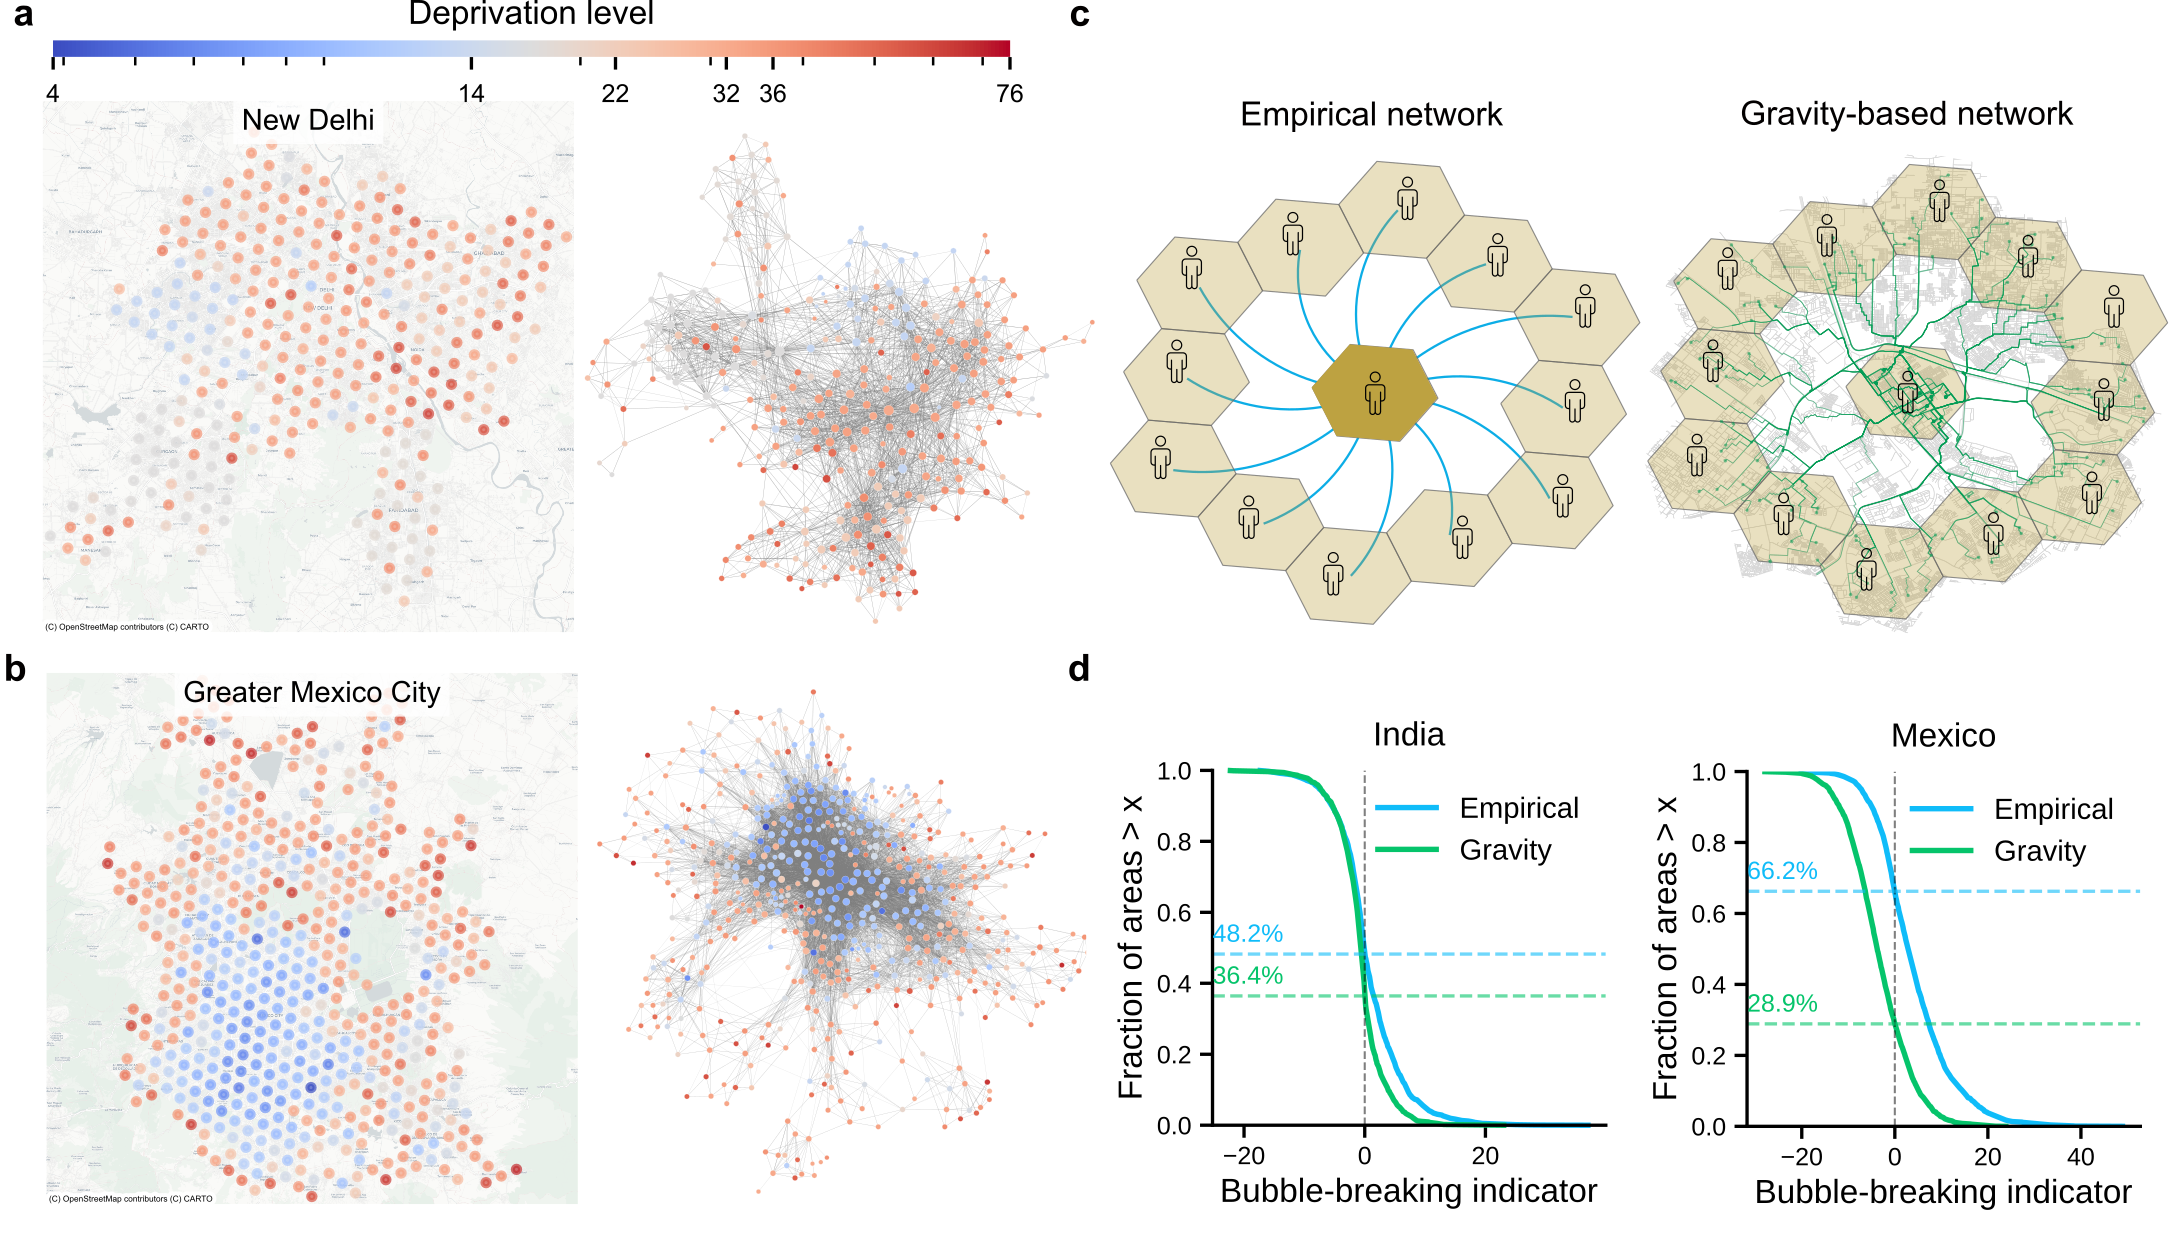
Figure 1: Bubble breaking manifests as residents from high deprivation neighborhoods frequently traveling to less deprived areas, visualized here for New Delhi and Greater Mexico City.
Heterogeneity Across the Deprivation Spectrum
Bubble breaking is most pronounced in areas of high deprivation. The correlation between residential deprivation and the bubble breaking indicator is sizable (India: 0.45, Mexico: 0.60; p<0.001), showing a monotonic increase in RBB with deprivation, particularly for Ri>25.
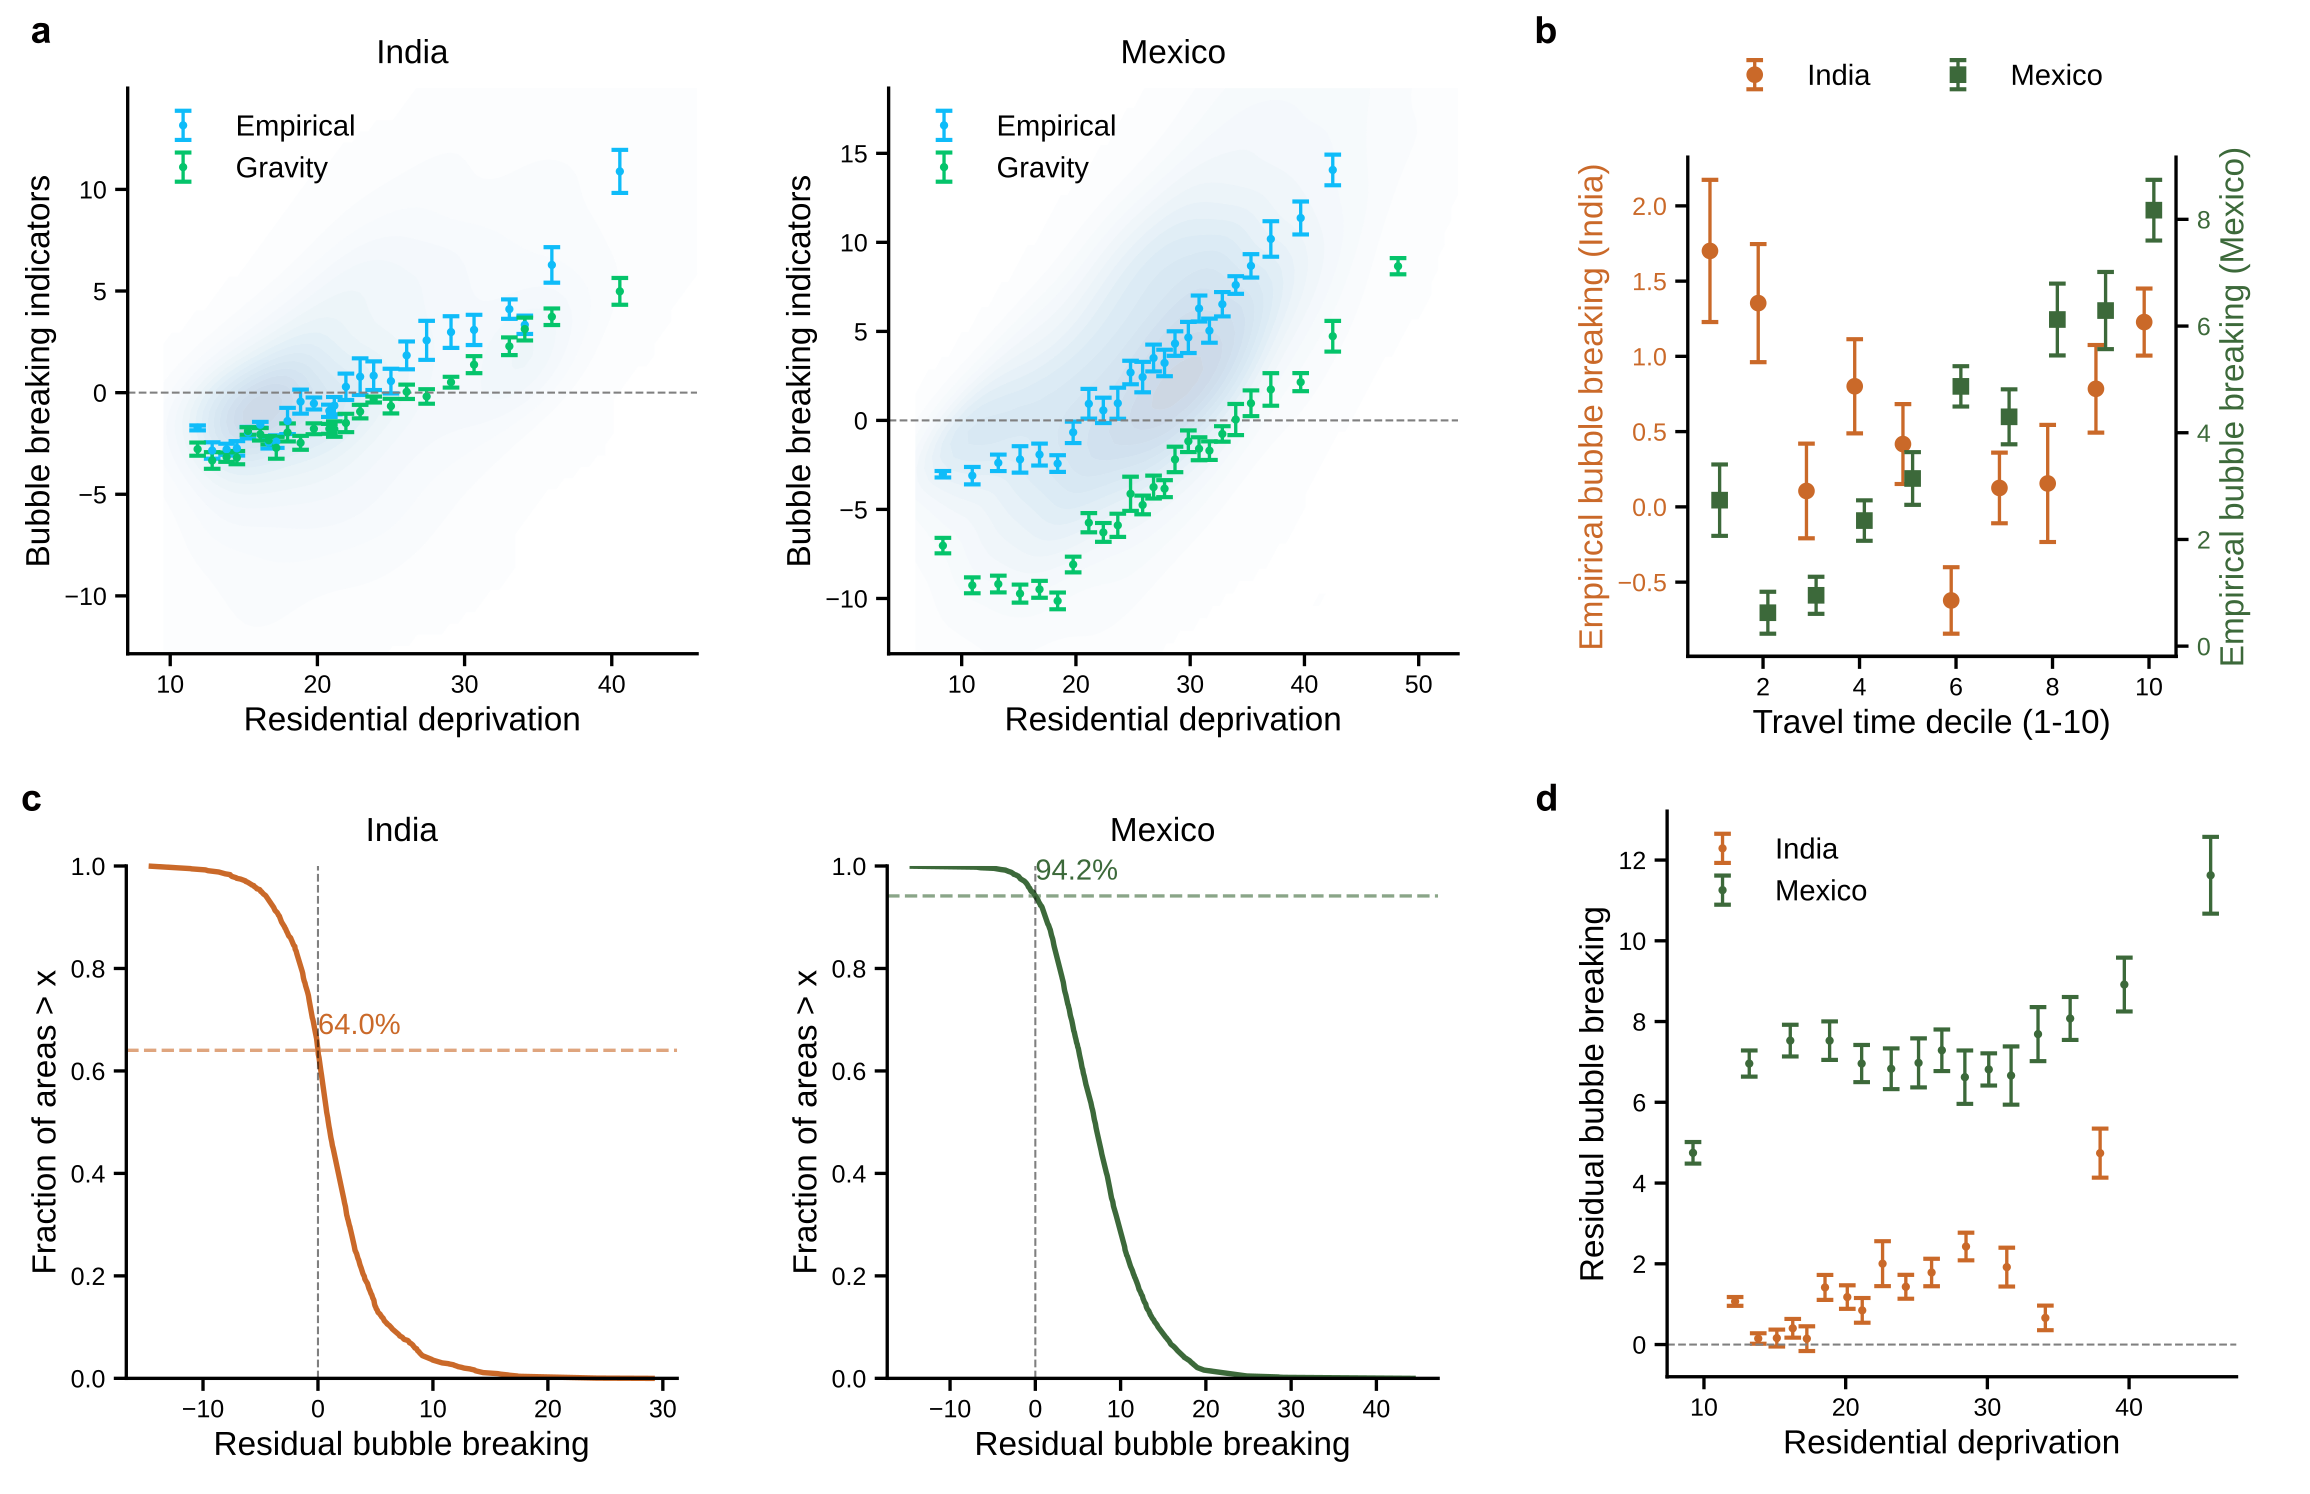
Figure 2: Bubble breaking as a function of deprivation: strongly positive in highly deprived areas, with a diminishing-trend in low deprivation districts.
Crucially, gravity models produce only weak or null bubble breaking, suggesting that structure alone does not explain realized exposure patterns.
Multilevel Determinants: Direct and Spillover Effects
The study uses Spatially Lagged X (SLX) modeling to decompose the contributions of local (direct) versus neighboring (spillover) environmental features to RBB. Three dominant predictors emerge:
- Residential Deprivation: Positive direct effect, negative spillover effect. Households in highly deprived areas are more likely to break their bubble, but being surrounded by deprivation (“trapping”) suppresses such behavior.
- Amenity Composition: POI entropy (diversity) is negatively associated with RBB, indicating that functional mix supports local satisfaction of needs. Conversely, high POI density (intensity) is positively associated with RBB, particularly in transit hubs or activity centers acting as “mobility corridors.”
- Urban Compactness: More compact cities exhibit larger RBB, suggesting that contiguous urban form eases cross-boundary movement.
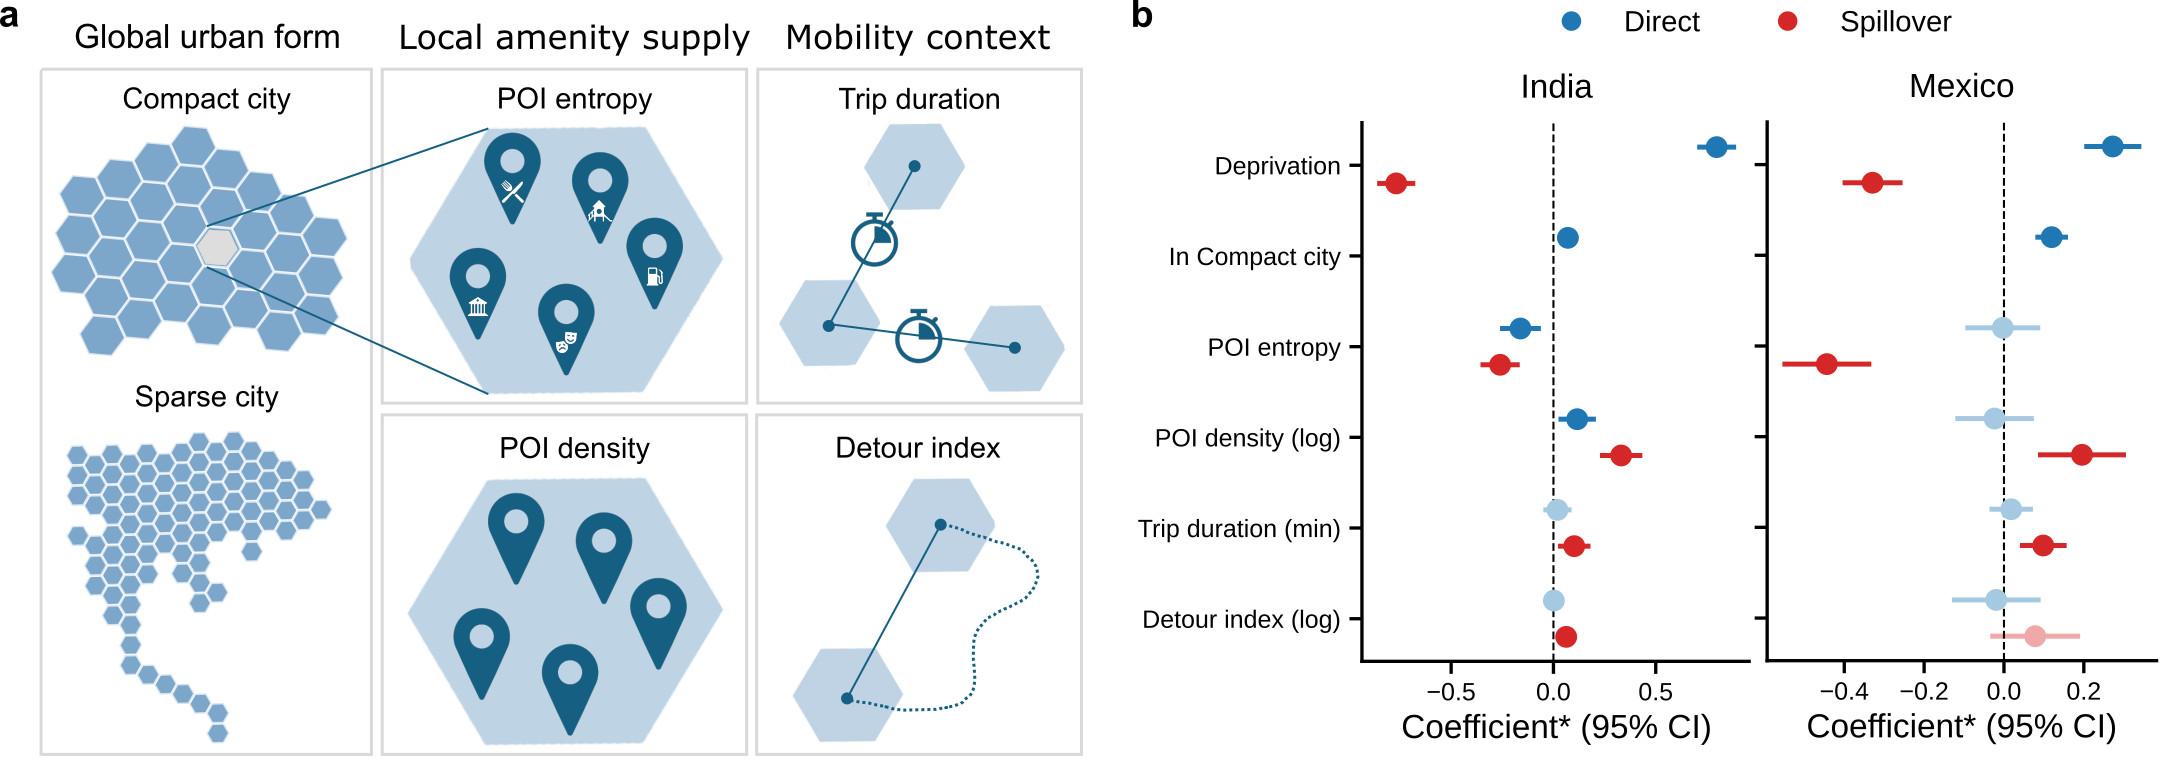
Figure 3: SLX regression highlights direct and spillover effects of global form, amenity, and mobility context on residual bubble breaking.
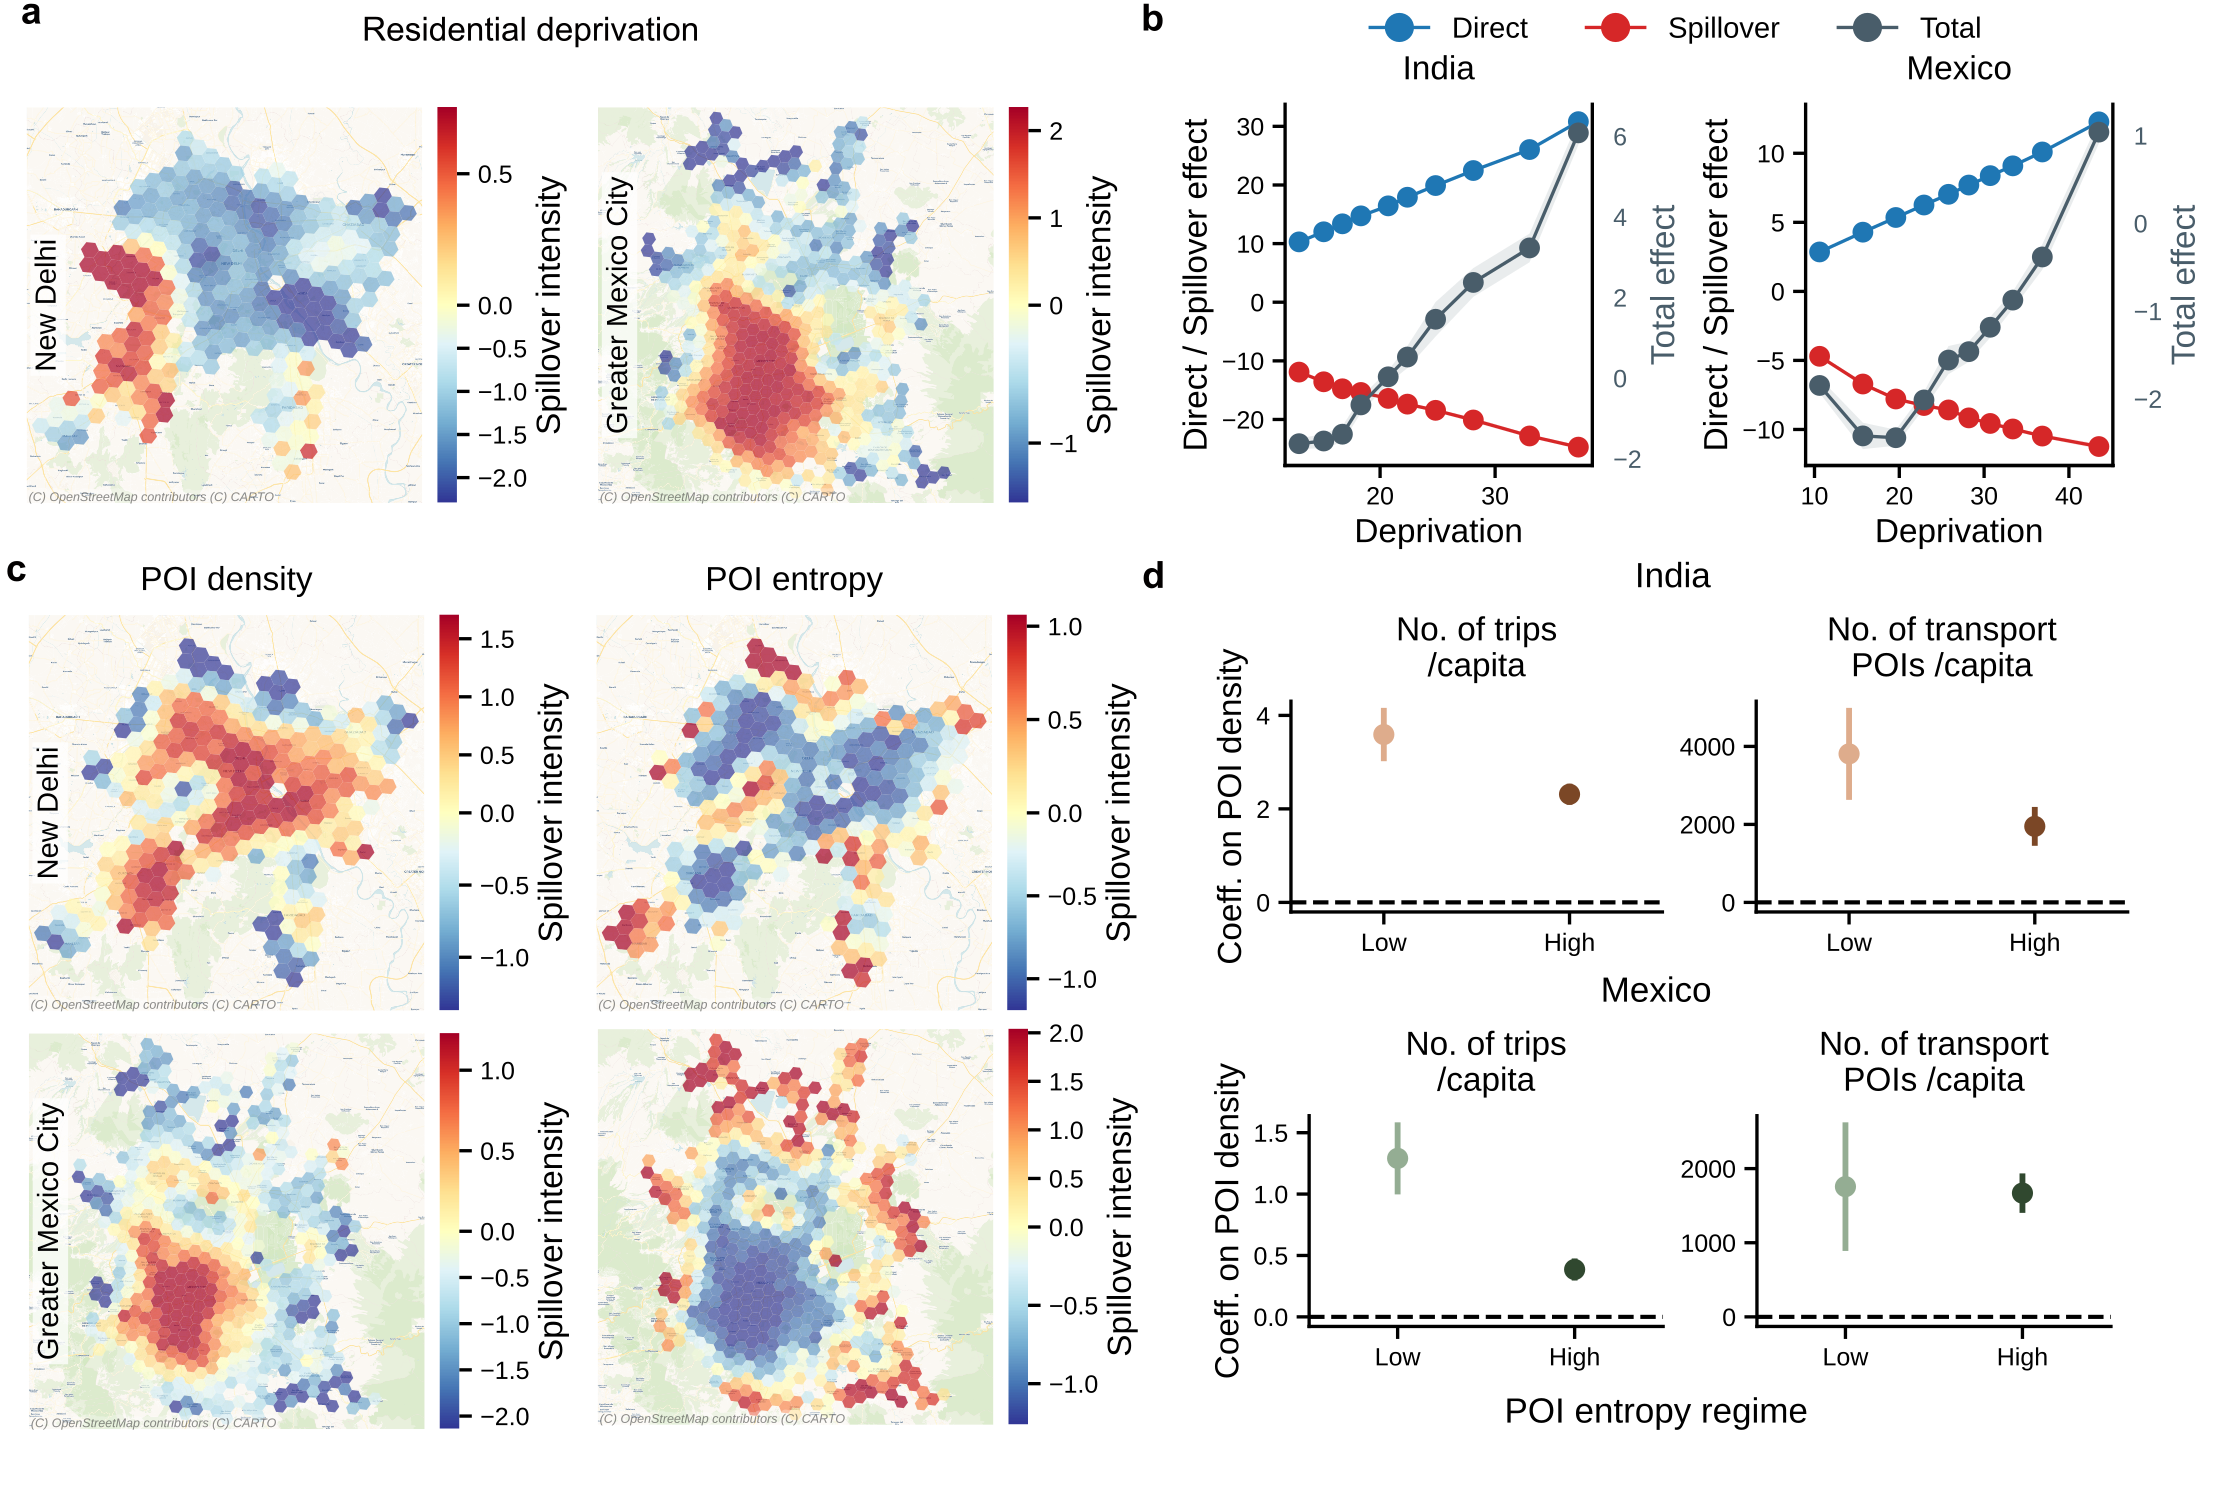
Figure 4: Spatial renderings show intense negative spillovers (“trapping”) in deprivation clusters and positive spillovers along well-connected corridors; marginal effect curves illustrate sharp direct-spillover contrasts.
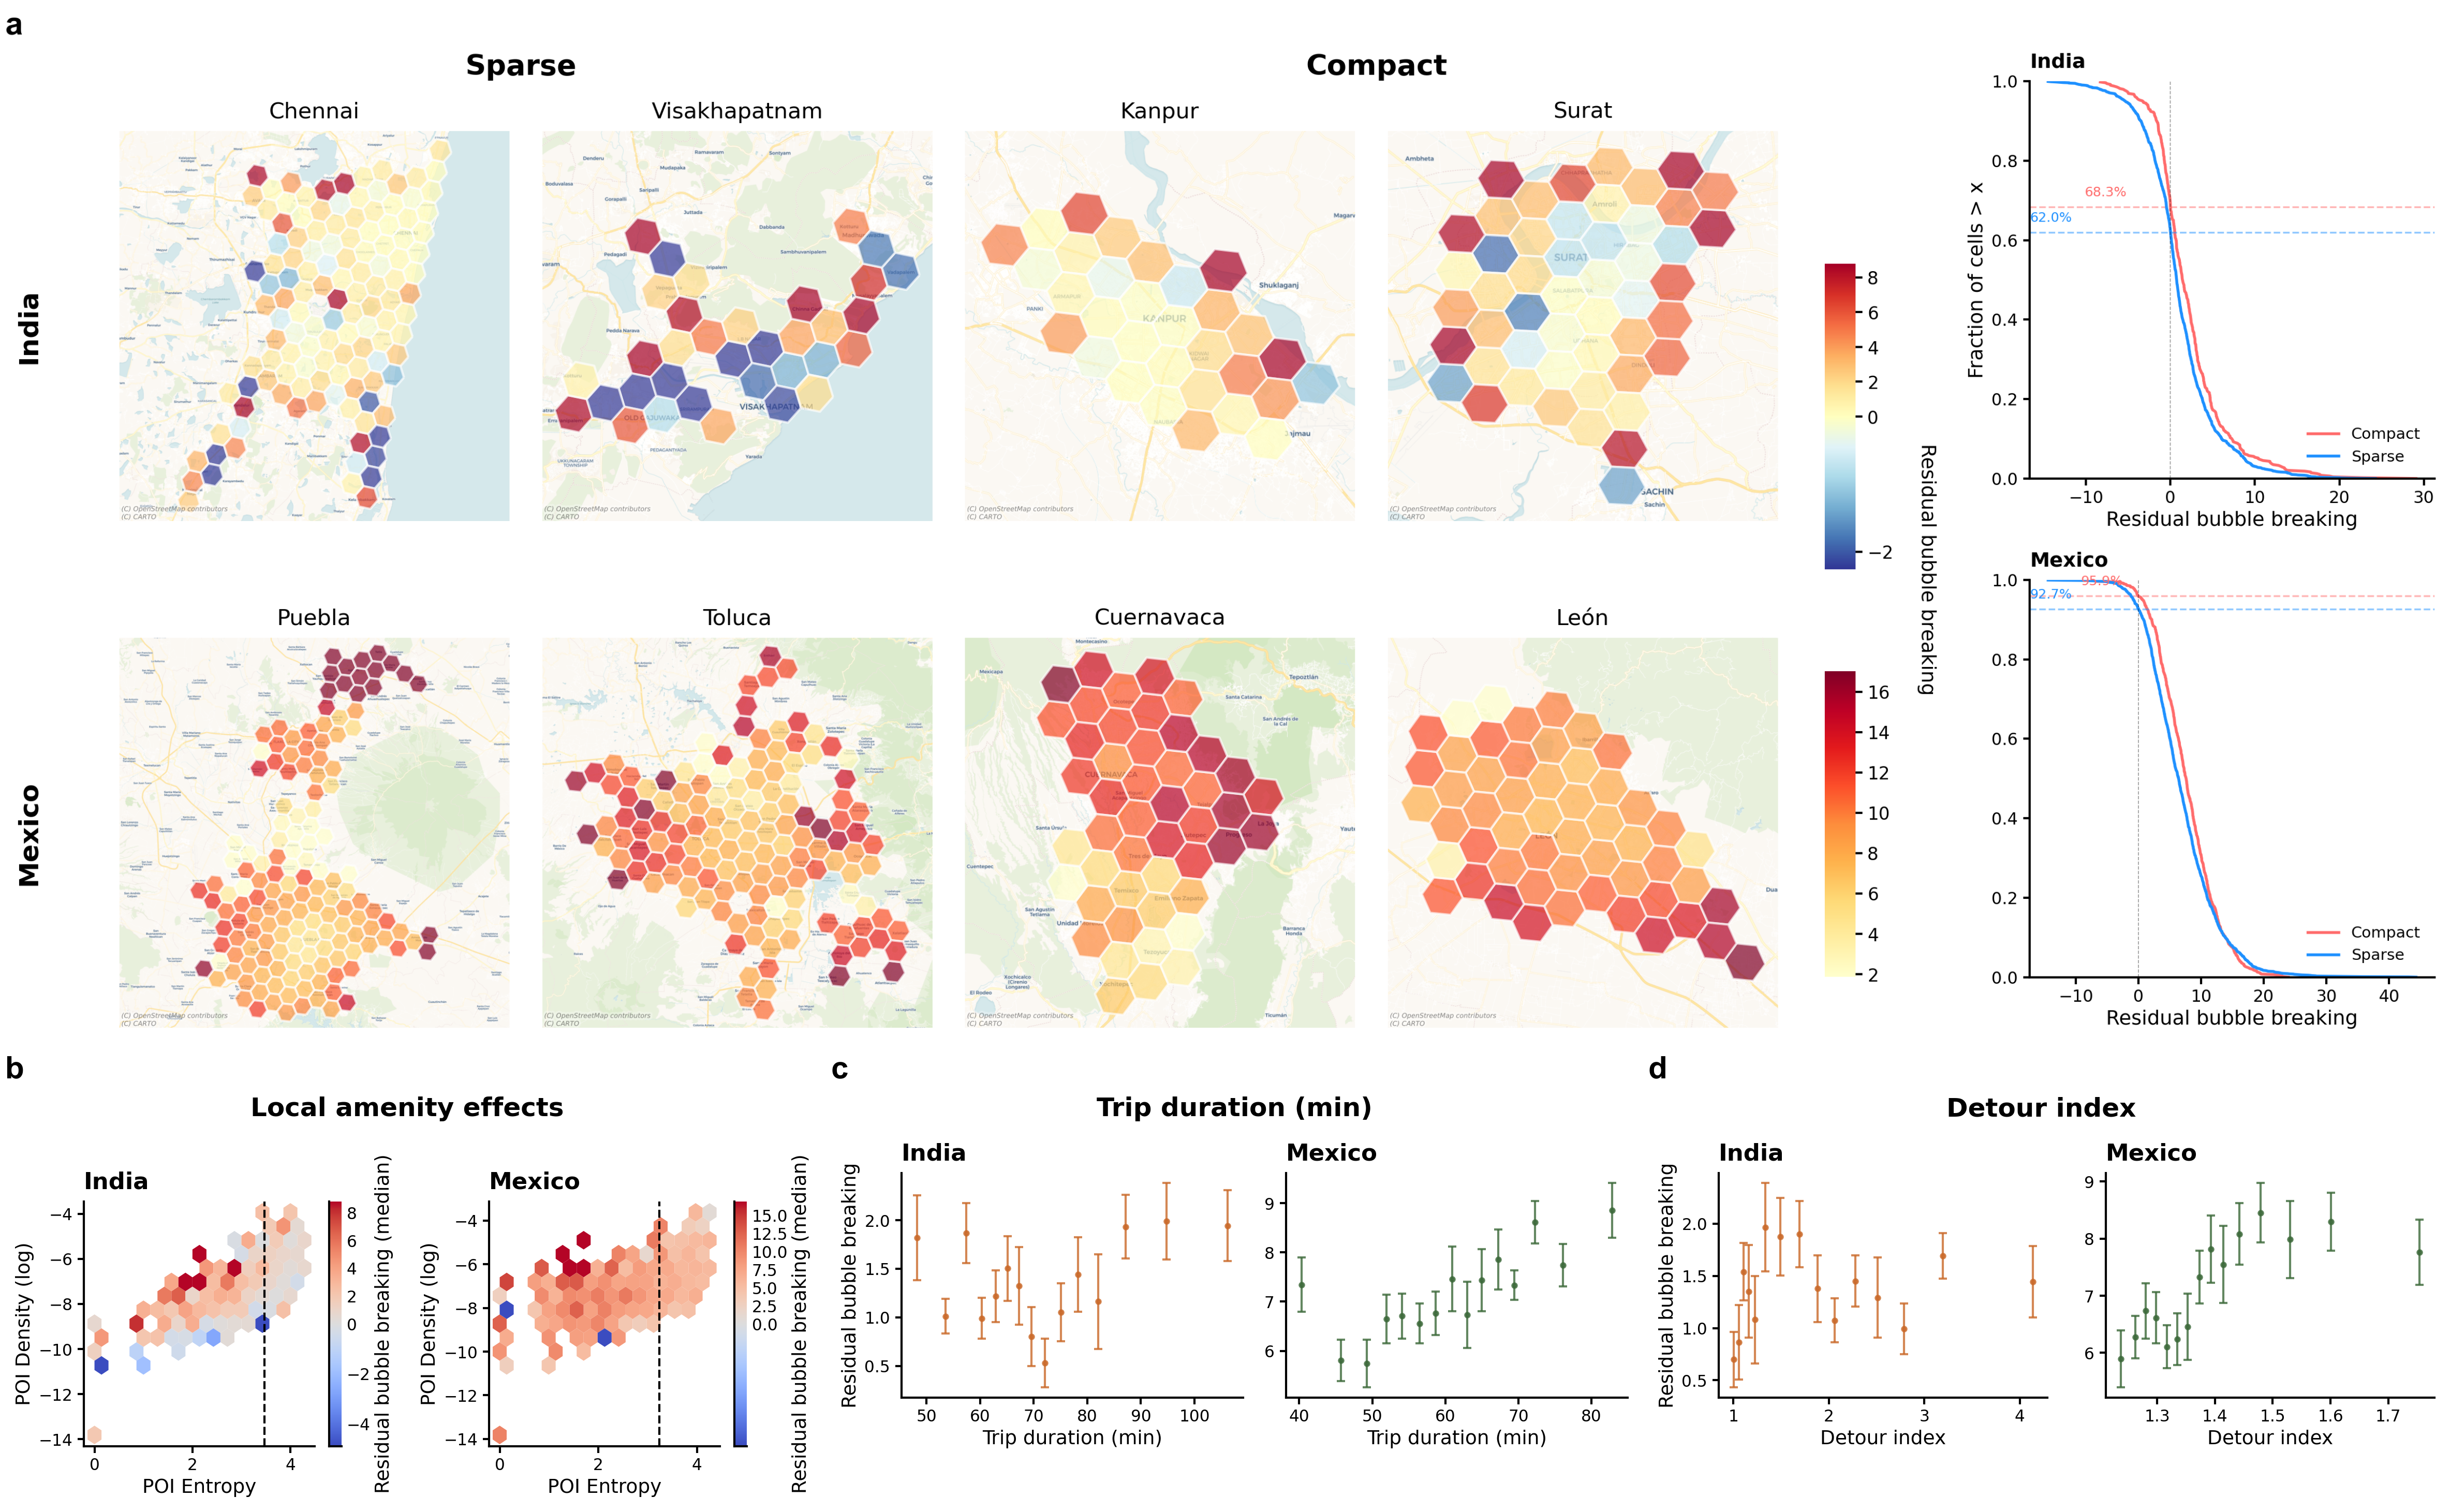
Figure 5: Patterns of RBB across city types (compact/sparse) and associations with amenity, travel time, and detour index.
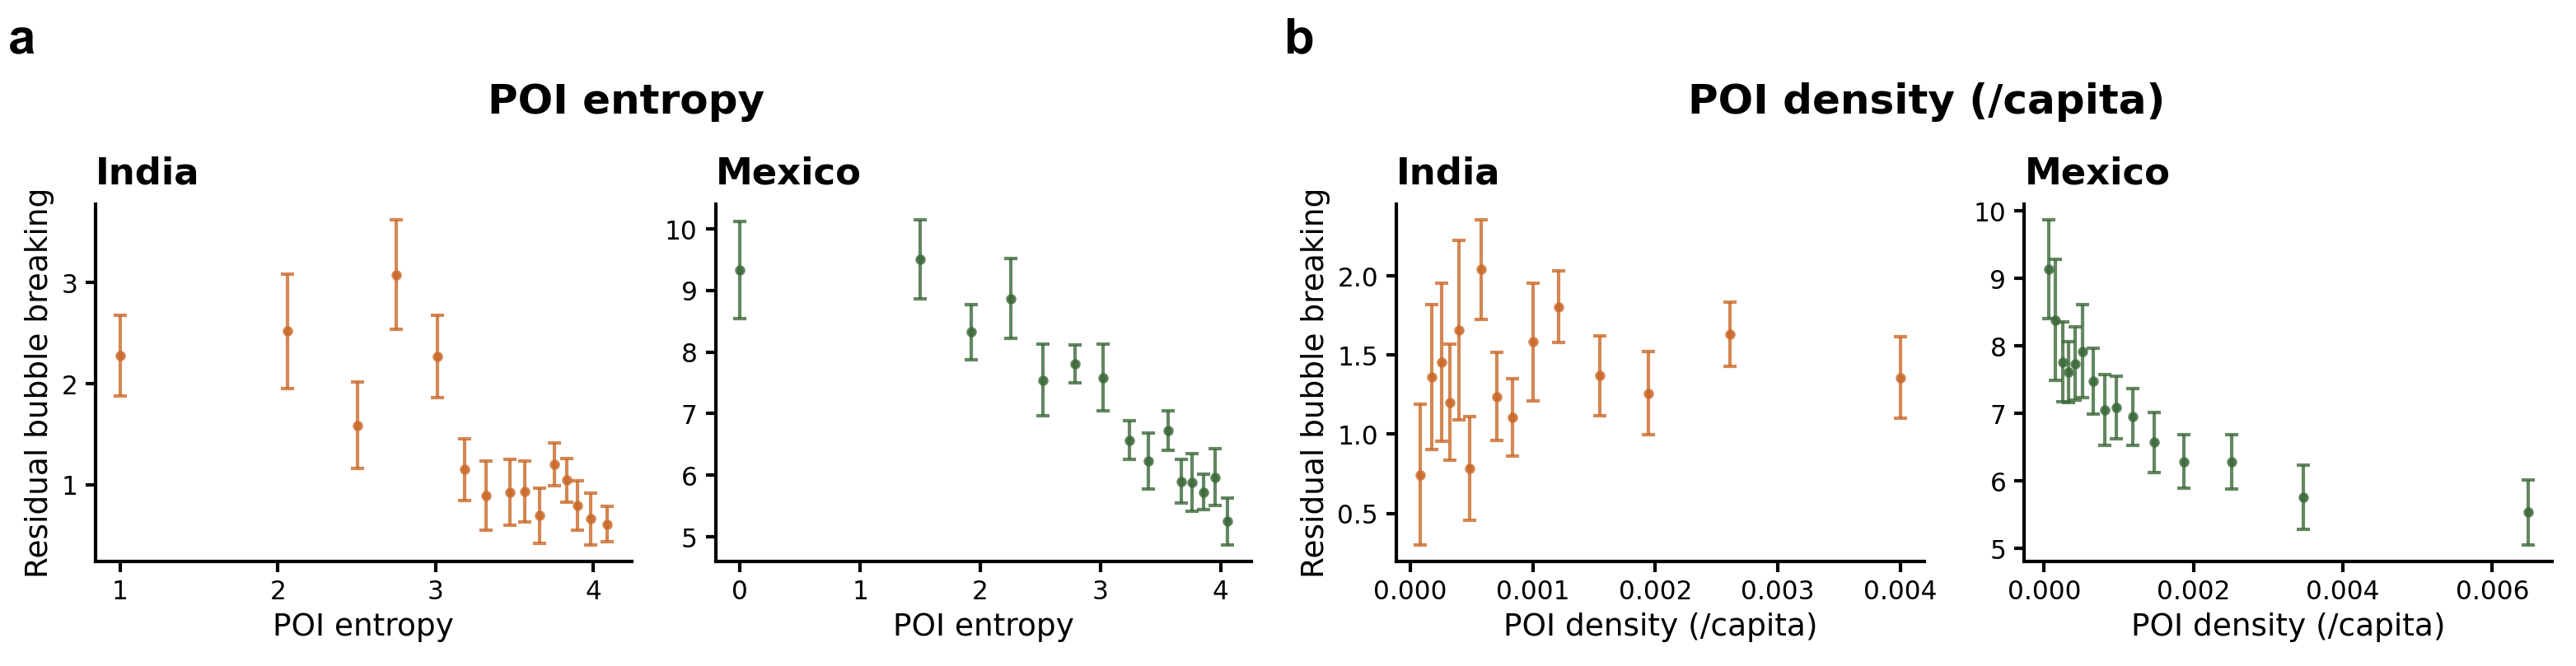
Figure 6: Detailed stratification of POI entropy and density effects on residual bubble breaking.
Theoretical and Practical Implications
Reconciling with Classical Urban Theory
These results offer a quantitative, behavioral residual—actual exposure unexplained by population distribution and infrastructure—from urban economics and accessibility theory. The systematic mobility from highly deprived areas to more privileged ones suggests persistent compensatory travel, consistent with needs-driven behavioral adaptations to spatially fragmented opportunity landscapes.
Urban Policy Relevance
High levels of RBB are diagnostic of spatially-induced vulnerability: they reflect areas where amenity deficits force reliance on mobility to access opportunities. Strategies emphasizing increasing local functional diversity (e.g., mixed-use zoning, targeted amenity provision) are supported by the observed negative association of POI entropy with RBB, as these interventions could mitigate compelled cross-boundary travel.
Clustered deprivation, marked by strong negative spillovers, highlights the limits of localized intervention—the spatial interdependence identified here indicates that effective policy requires coordination at the supra-neighborhood scale.
Additionally, the COVID-19 analysis underscores the fragility of mobility-driven compensatory mechanisms during disruptions. Areas heavily reliant on bubble breaking experienced greater activity collapse under mobility constraints.
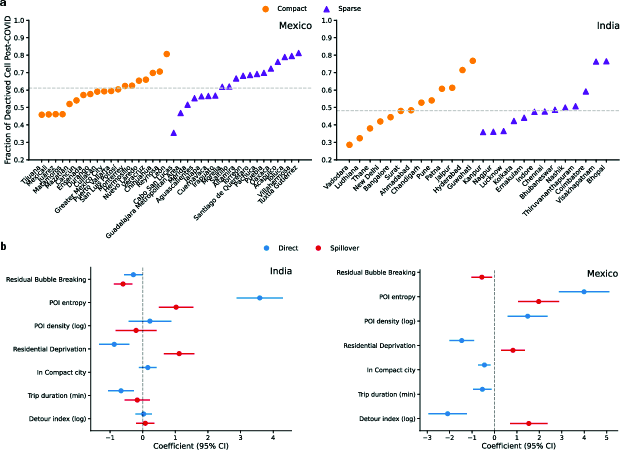
Figure 7: COVID-19 led to fragmentation of mobility networks, with spillover-driven area-level deactivation most pronounced in cities and neighborhoods dependent on cross-boundary mobility.
Limitations and Directions for Future Research
Several gaps are recognized:
- Data Constraints: Mobile phone data underrepresent the poorest and POI data often miss informal economies, possibly underestimating true local diversity in deprived neighborhoods.
- Causality: Cross-sectional design identifies associations but not mechanism; longitudinal data and natural experiments are needed for robust causal inference.
- Behavioral Interpretation: RBB cannot distinguish preference from constraint; further disaggregation by trip purpose and ground-truth surveying is necessary for interpreting voluntarity.
- Network Structure Sensitivity: The gravity-model baseline is sensitive to travel time thresholds and infrastructural granularity. Future work may examine robustness to more complex cost structures.
Conclusion
This research supplies robust empirical evidence that urban mobility substantially mediates the spatial experience of deprivation in cities of the Global South. Residual bubble breaking quantifies exposure to opportunity beyond what residence-based and canonical accessibility models capture. The findings emphasize the critical roles of functional urban diversity, corridor connectivity, and spatial interdependence in both perpetuating and alleviating urban disadvantage. As such, RBB offers a powerful, policy-relevant metric for targeting interventions and diagnosing both the behavioral and structural dimensions of spatial inequality.
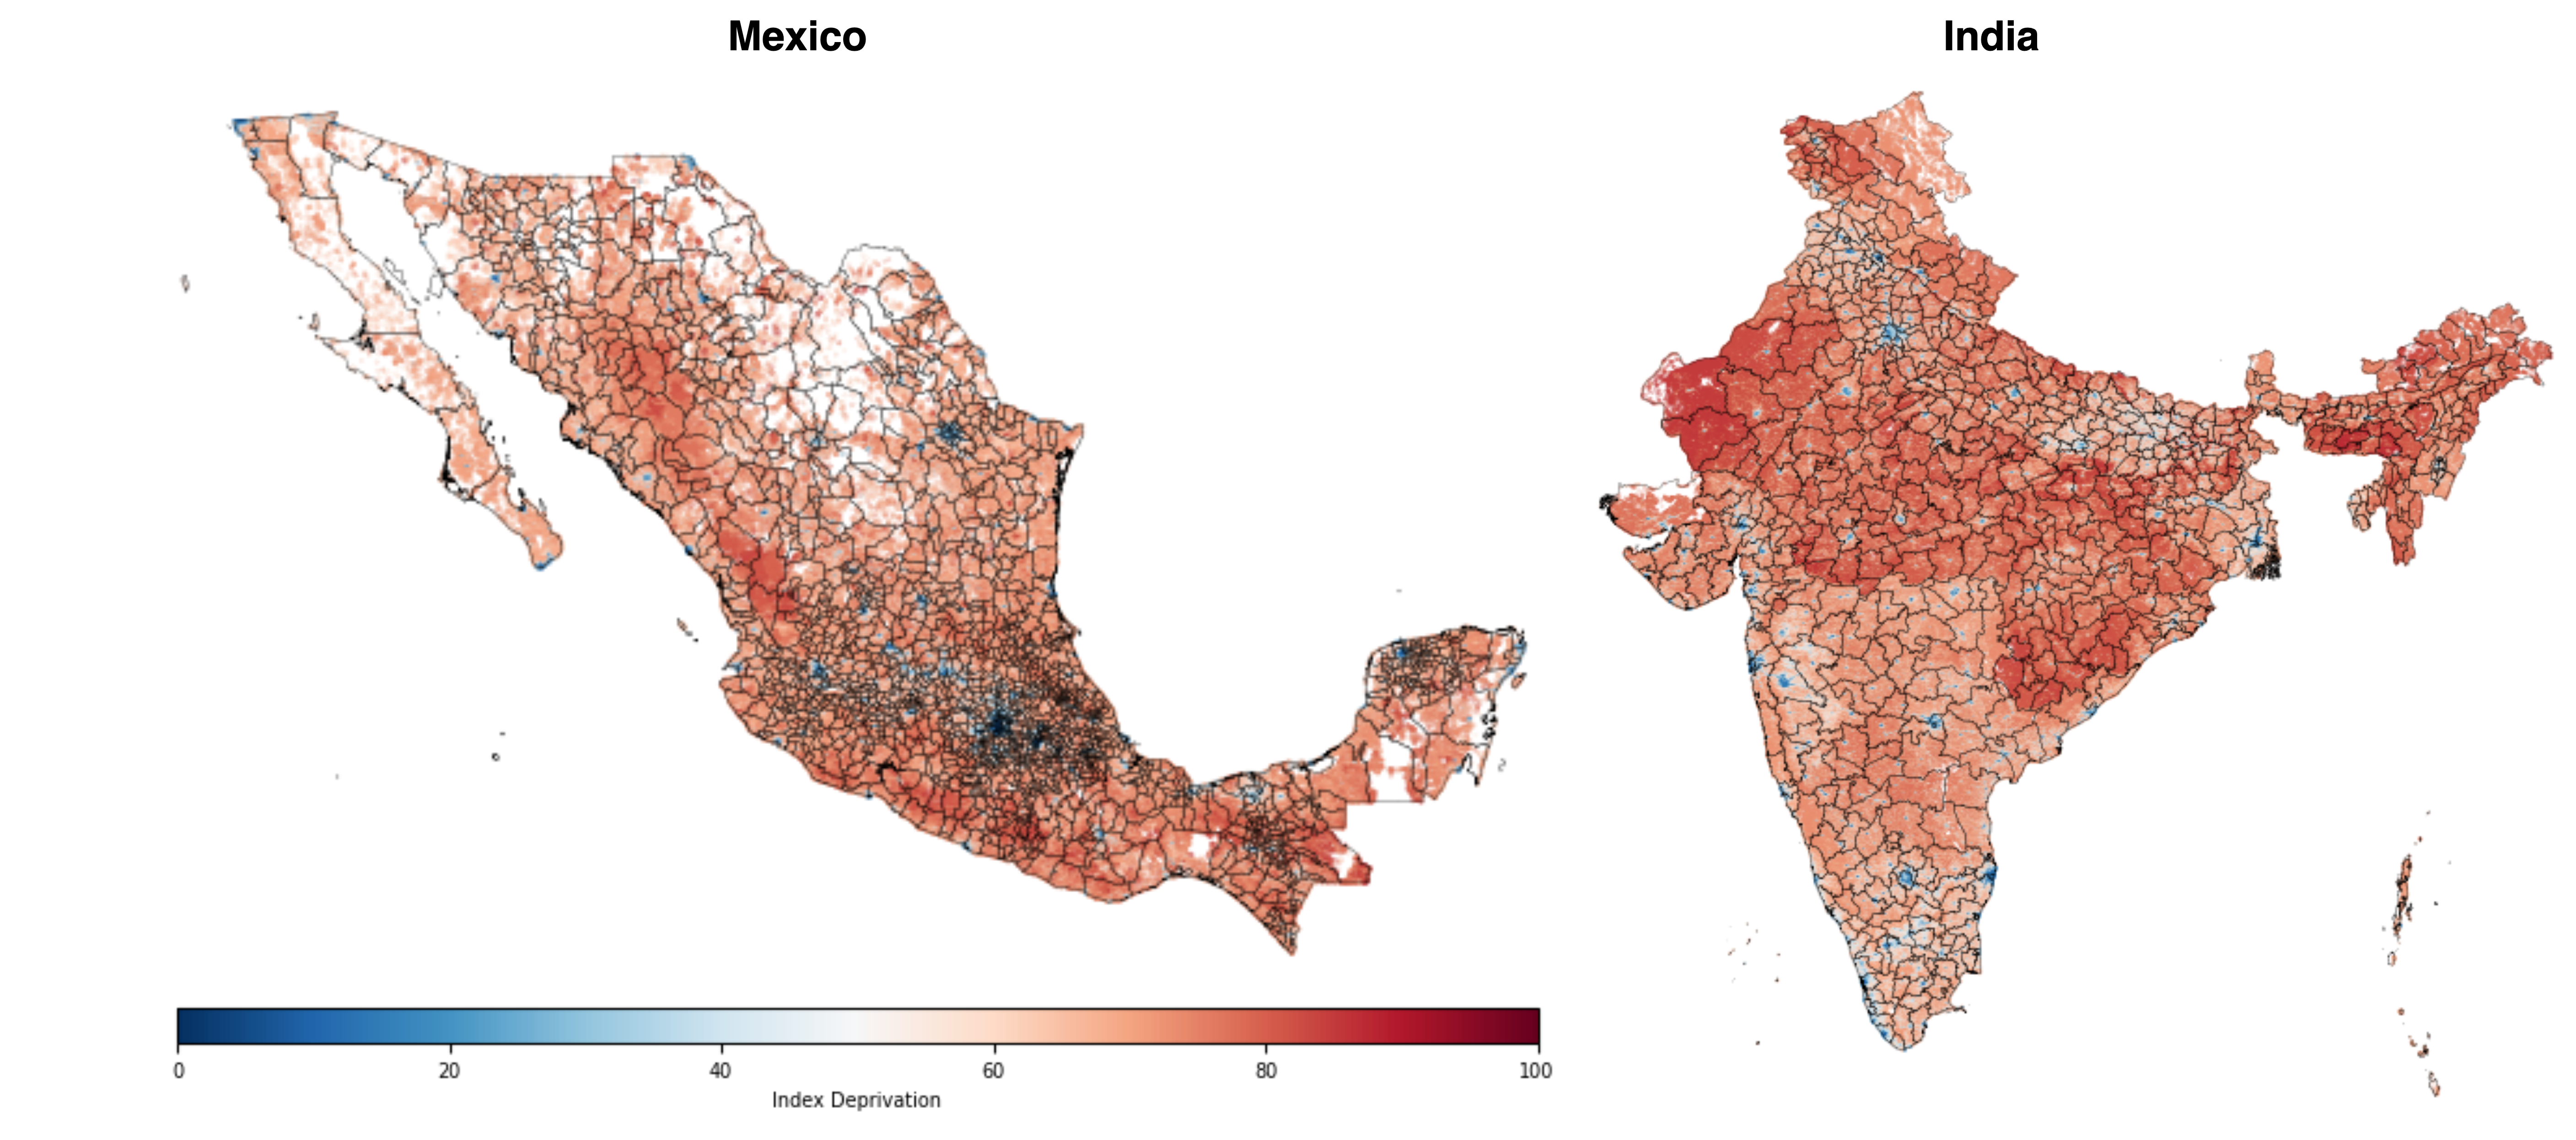
Figure 8: High-resolution mapping of the Global Gridded Relative Deprivation Index (GRDI) for both countries contextualizes the scale and spatial patterning of deprivation.