- The paper introduces a transformer-based model that robustly performs SED analysis and multi-task inference from J-PAS data.
- It employs a masked, autoregressive architecture enabling simultaneous classification and regression for redshifts, emission lines, and physical parameters.
- OJALÁ achieves high performance with F1-scores up to 0.9 and redshift precision (σ_NMAD < 0.01), underscoring its scalability for large survey datasets.
Motivation and Context
The exponential growth in astronomical survey data, enabled by facilities such as J-PAS, DESI, and LSST, necessitates the development of scalable, robust algorithms for the automated analysis of both photometric and spectroscopic observations. The J-PAS survey's unique 54 narrow-band system delivers quasi-spectroscopic SEDs, providing robust diagnostic power for redshift estimation, emission-line analyses, and spectral classification, bridging the traditional photometry/spectroscopy divide. However, conventional SED-fitting and supervised ML models struggle at these scales due to high dimensionality, heterogeneity, and incompleteness in survey data.
The OJALÁ model addresses this need by establishing a transformer-based, autoregressive foundation model capable of ingesting variable context J-PAS and complementary broad-band photometry—including partial or missing inputs—and simultaneously performing classification (galaxy/star/QSO) and the regression of a wide suite of physical parameters (e.g., photometric redshift, emission line EWs, stellar mass, SFR, and stellar parameters) (2604.00661).
Data, Synthetic Mock Pipeline, and Validation
OJALÁ is trained with ∼20 million SEDs derived from DESI DR1 spectra, convolved with the J-PAS filter transmission curves, and supplemented by DESI Legacy Survey and WISE broad-band data. For reliable benchmarking and sim-to-real evaluation, a J-PAS–DESI cross-matched validation sample of 121,065 objects is constructed, comprising 86,140 galaxies, 25,958 stars, and 8,967 QSOs.
A critical engineering detail is the treatment of photometric errors for training mocks: errors are assigned through an embedding-similarity approach matching synthetic SEDs to real J-PAS objects across magnitude bins. This realistic error sampling ensures consistency between training and inference domains and captures the noise covariance structure characteristic of J-PAS observations.
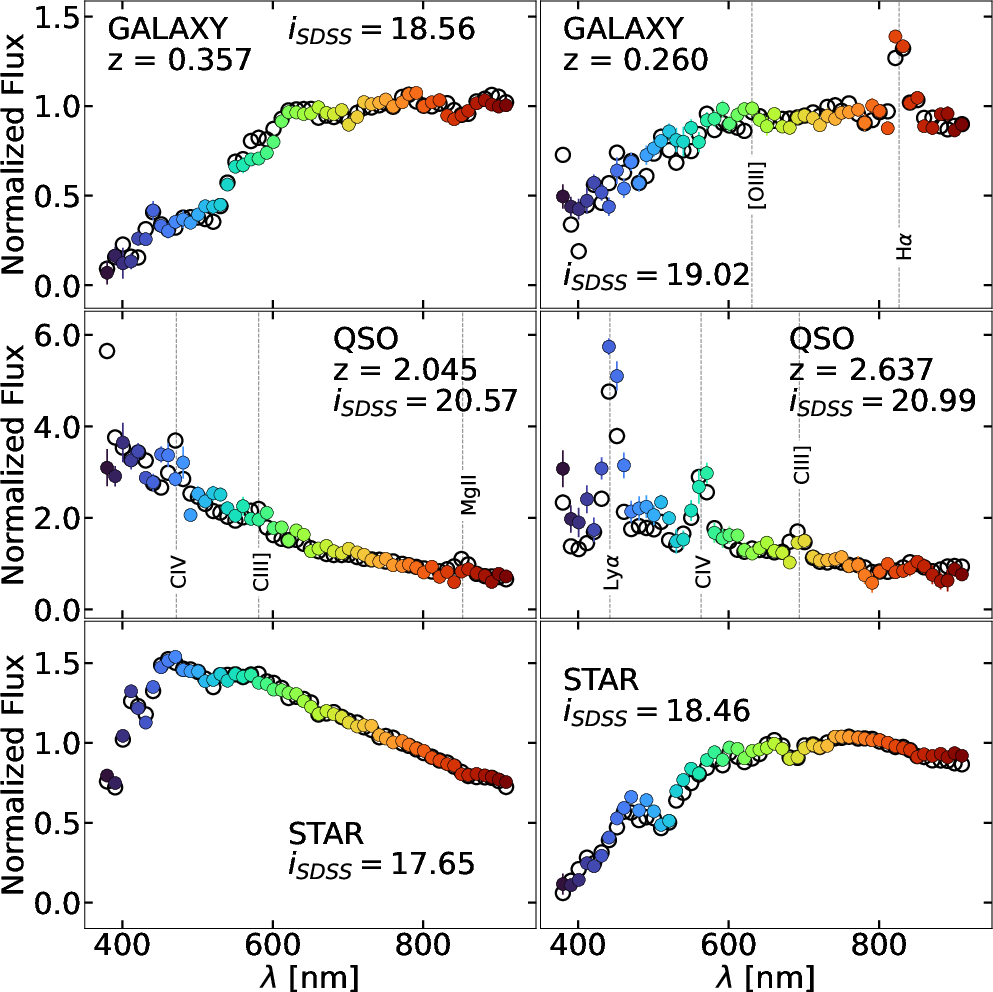
Figure 1: Examples of synthetic J-PAS fluxes from DESI (white dots) and similar real J-PAS objects (colored dots) used in the error-mapping process.
The datasets Sample distributions in magnitude and color space confirm adequate representation and coverage, with the caveat that DESI’s target selection induces biases at parameter space boundaries.
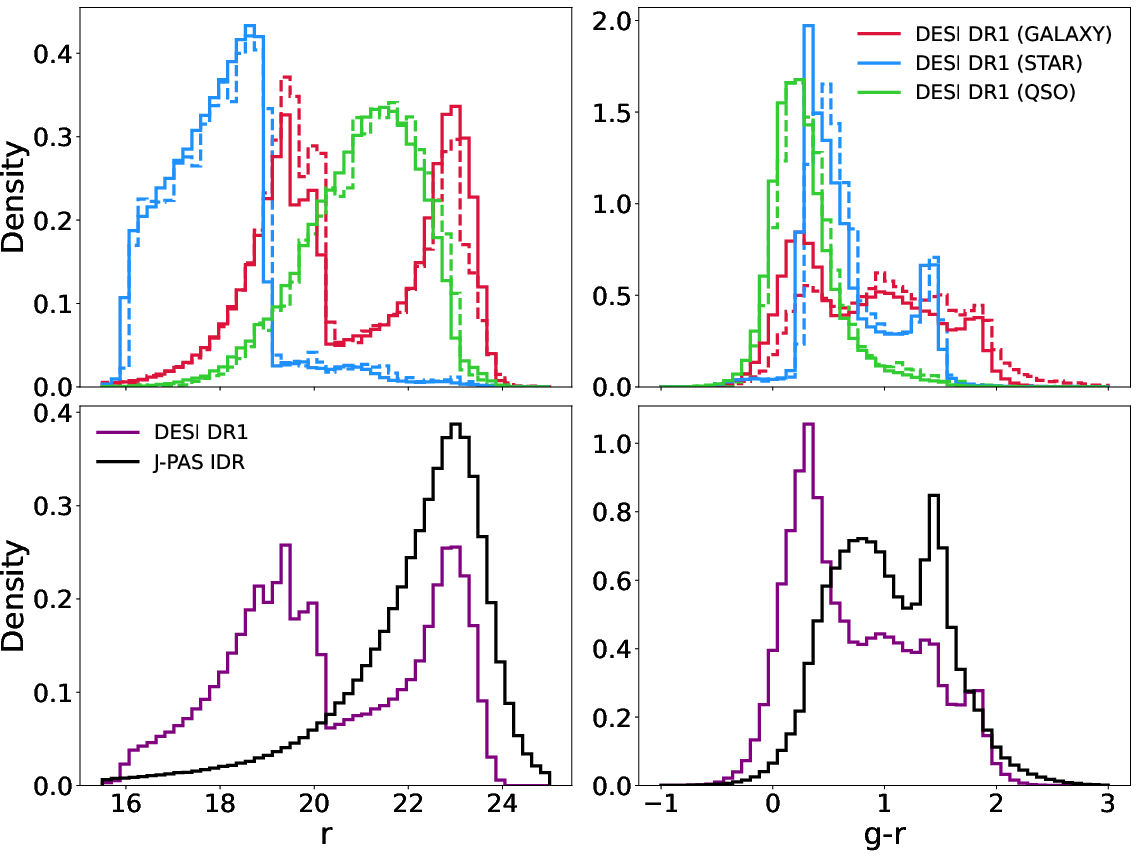
Figure 2: Distributions of r-band magnitude and g−r color for training, validation, and full J-PAS datasets.
Model Architecture and Training Protocol
OJALÁ departs from traditional fixed-input ML models, employing an encoder–decoder transformer with self-attention. All observed fluxes, magnitudes, and known physical parameters are cast as input tokens in a flexible sequence; the model autoregressively predicts any subset of hidden or missing tokens conditioned on the others, mimicking a masked language modeling regime.
This design enables:
- Robustness to missing data and heterogeneity (partial photometry, incomplete parameter coverage),
- Unified training on non-strict cross-matched catalogs,
- Direct applicability to inference settings typical in next-generation surveys.
For the training objective, a multi-task loss is minimized, combining heteroscedastic negative log-likelihood for regression tokens (with explicit modeling of both predictive and observational uncertainties), categorical cross-entropy for class and morphological labels, and a domain alignment MMD penalty for unsupervised domain adaptation (UDA). The UDA term enforces distributional similarity between latent spaces for synthetic and real J-PAS data, favoring generalization.
OJALÁ yields high classification accuracy across stars, galaxies, and QSOs up to i ∼ 21, achieving a global weighted F1-score of ∼0.9 (Test-Real). Misclassification predominantly occurs at bright magnitudes due to intrinsic ambiguity at the galaxy–low-z QSO boundary (see detailed confusion analysis). The F1-score remains stable under various restricted input subsets; performance is robust even when only the blue trays and broad-band photometry are provided, retaining F1 ∼ 0.8.
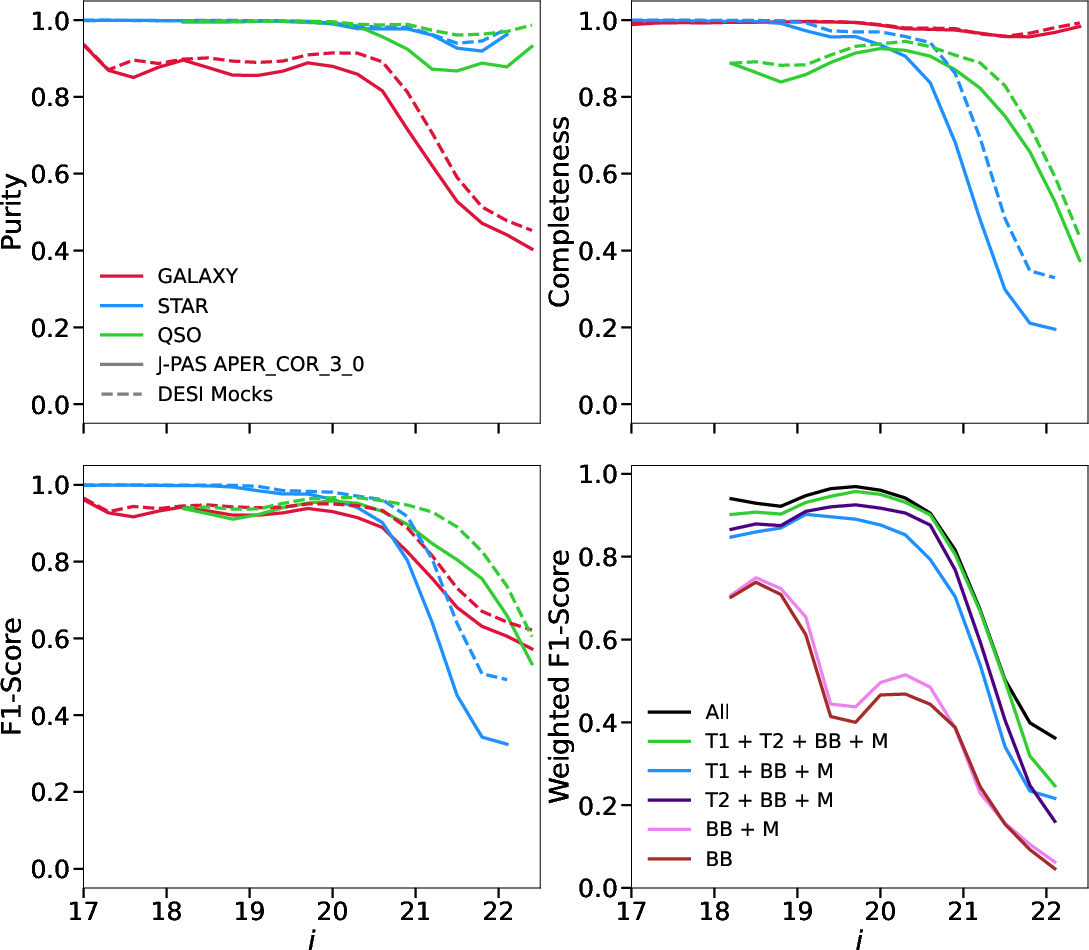
Figure 3: Balanced metrics (Purity, Completeness, F1-score) and global weighted F1-score versus i-band magnitude for galaxies (red), stars (blue), QSOs (green) in real and synthetic test sets.
In photometric redshift estimation, OJALÁ reaches σNMAD<0.01 for galaxies and shows minimal bias up to i∼22, with an outlier fraction η<5%. For QSOs, performance improves significantly at z>1.5 (σNMAD≈0.006 at g−r0), where prominent emission lines enter the optical bands. Redshift regression is essentially immune to the exclusion of broad-band or morphology tokens as input.
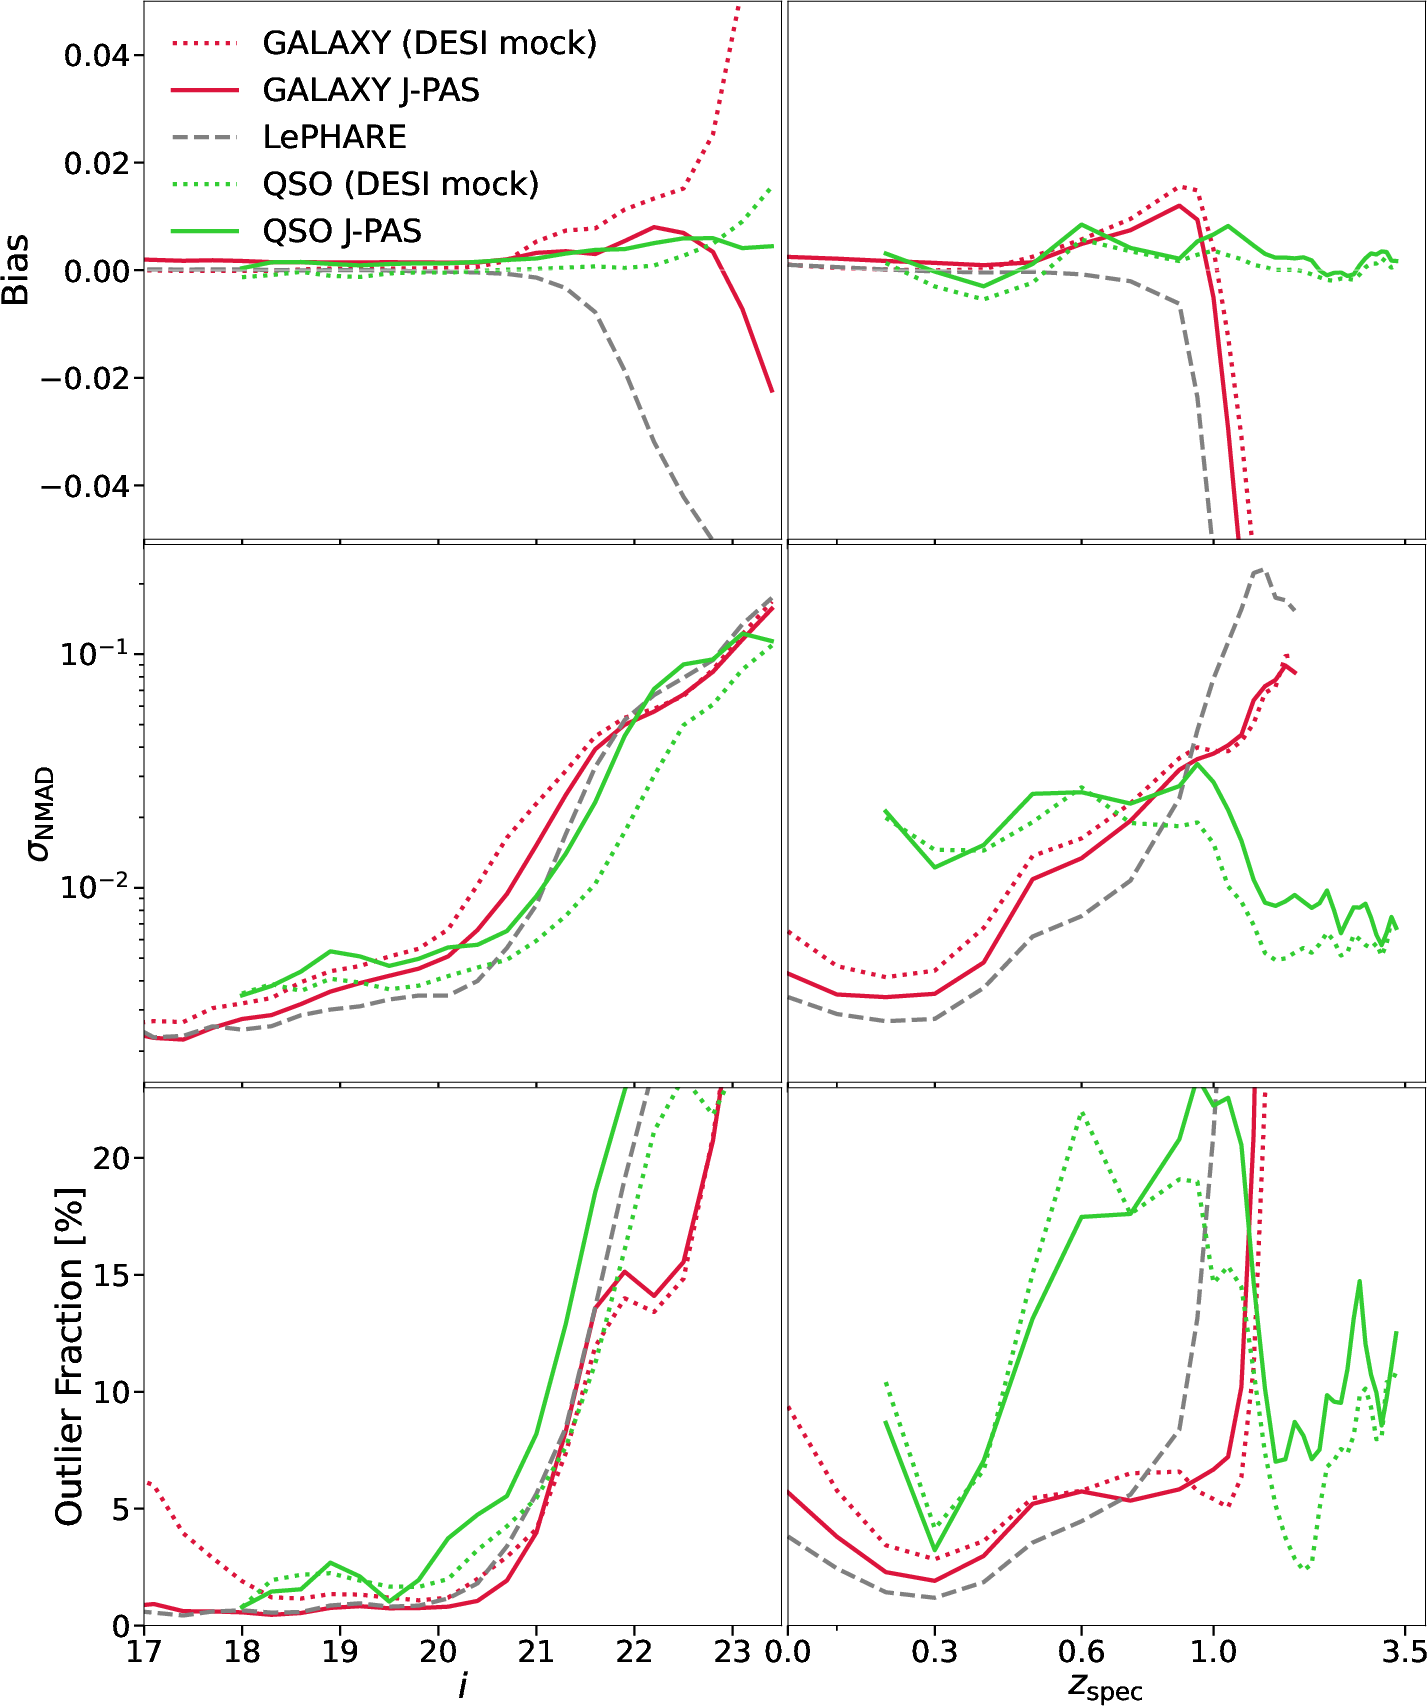
Figure 4: Photometric redshift accuracy (bias, g−r1, outlier fraction) for galaxies and QSOs as a function of magnitude and spectroscopic g−r2.
Physical Parameter Estimation
Stellar Parameters
OJALÁ’s inference of g−r3 for stars is precise (negligible bias, low scatter), reflecting the direct link between photospheric temperature and SED shape, even at the moderate resolution of J-PAS. Surface gravity g−r4 is biased for giants (g−r5) due to the lack of direct information on pressure-broadened, gravity-sensitive features in NB photometry. Metallicity [Fe/H] and [g−r6/Fe] are recovered robustly within g−r71 < [Fe/H] < 0, but the model saturates/overestimates metallicities for the most metal-poor stars, with increased scatter for [g−r8/Fe] in the high-enhancement regime.
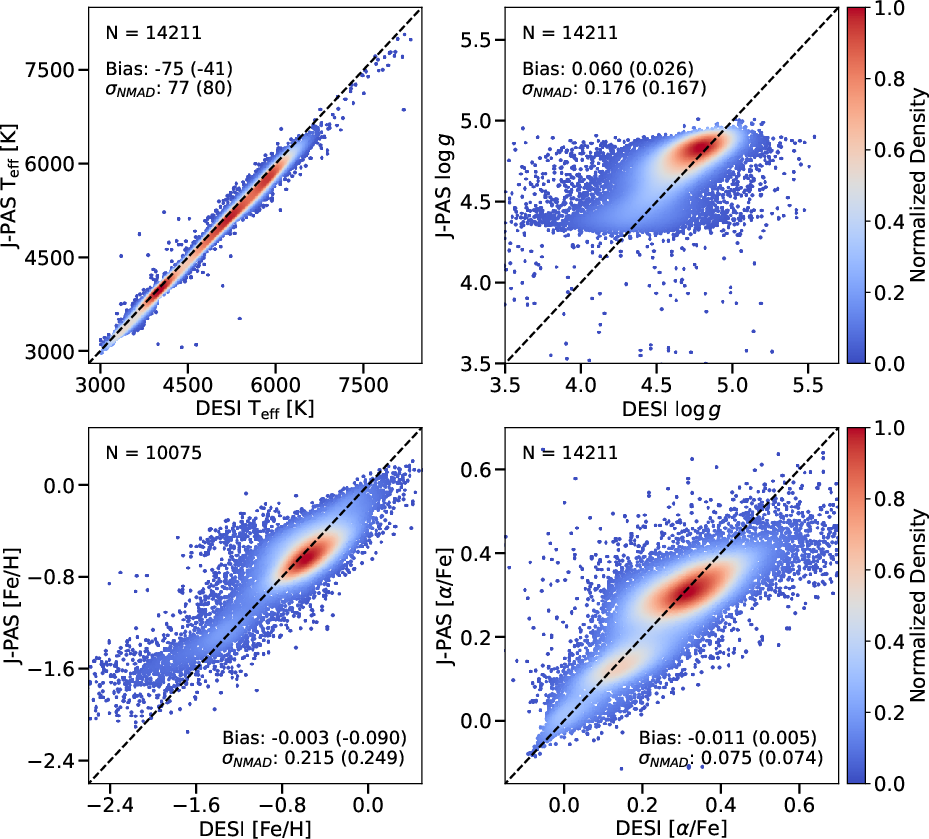
Figure 5: OJALÁ predictions versus DESI DR1 values for g−r9, i0, [Fe/H], [i1/Fe] for stars with i2.
Galaxy Emission Lines and Nebular Diagnostics
OJALÁ predicts emission line EWs (Hα, Hβ, [NII], [OIII]) with low bias and scatter for the bulk of the sample, enabling robust galaxy emission line classification. For instance, the Hα EW has bias 0.035 dex and i3 dex. The performance degrades for rare, extreme-EW objects due to long-tailed EW distributions and class imbalance. Line ratio diagnostics [NII]/Hα and [OIII]/Hβ can be reconstructed photometrically, enabling the accurate reproduction of BPT and WHAN diagrams.
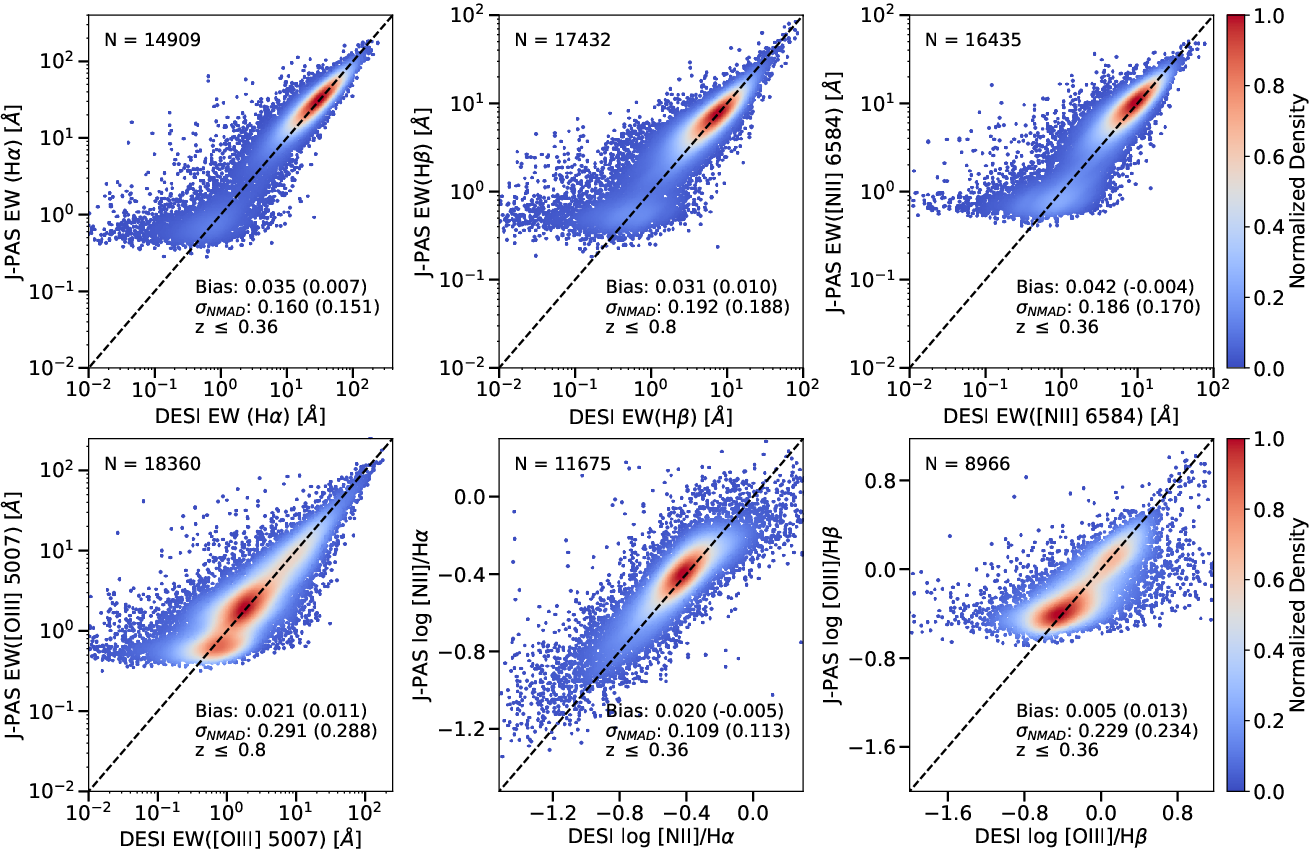
Figure 6: Density plots comparing OJALÁ-predicted versus DESI-measured EWs for key lines and diagnostic ratios in galaxies.
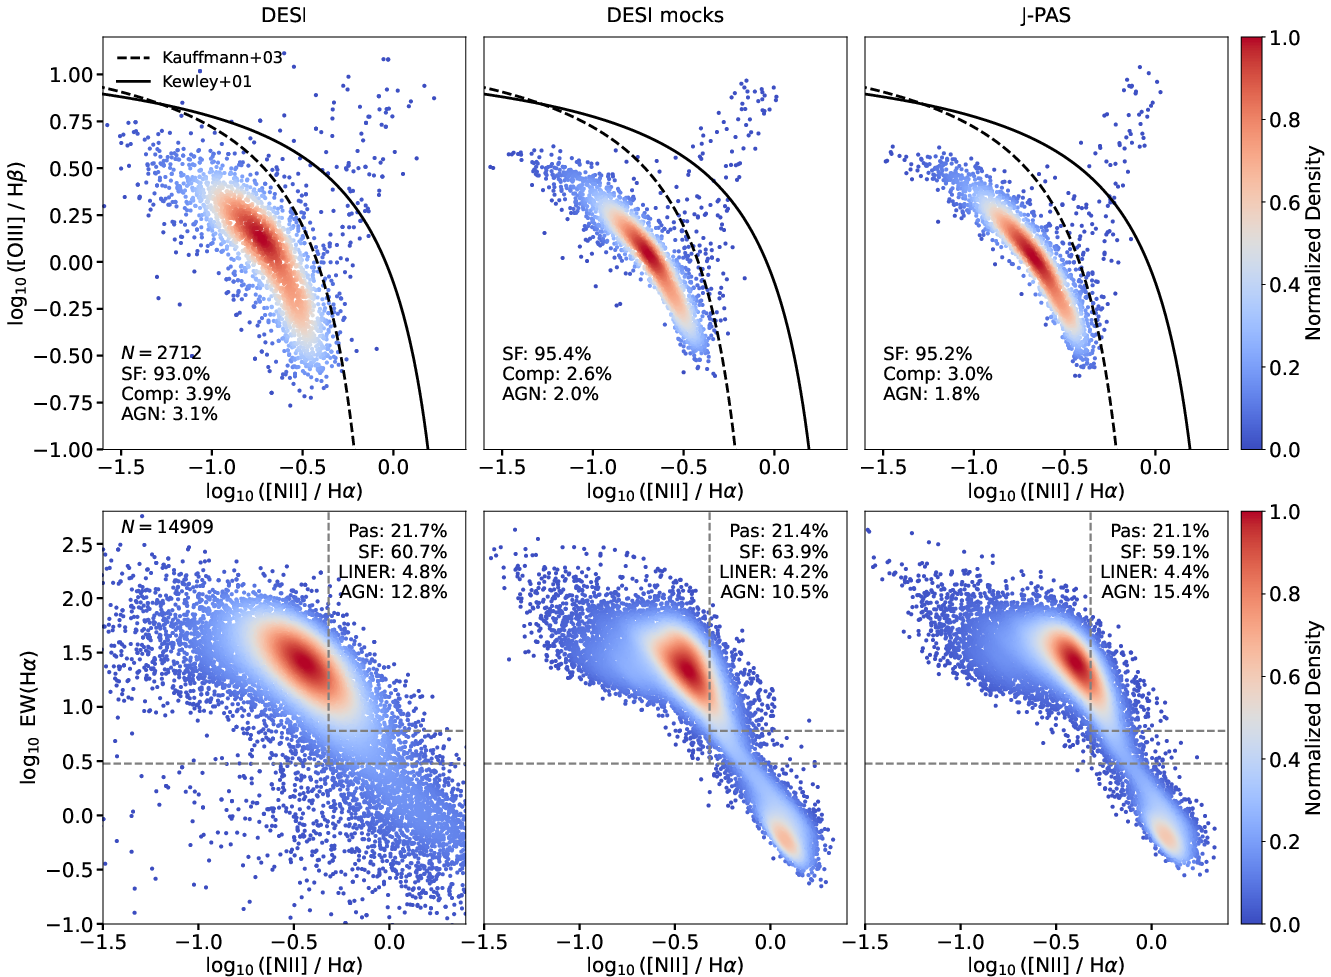
Figure 7: BPT and WHAN diagrams from DESI, OJALÁ on Test-Synth, and OJALÁ on real J-PAS.
OJALÁ achieves F1-scores up to 80% for pure star-forming galaxies, ~68% for AGN, and ~91% for passive galaxies when classes are evaluated in the appropriate diagnostic regime.
Derivation of dust-corrected Hα luminosity, integrating predicted EWs, SED continuum, and photometric redshift, yields scatter i4 dex relative to spectroscopic estimates, verifying model coherence across multiple output modalities.
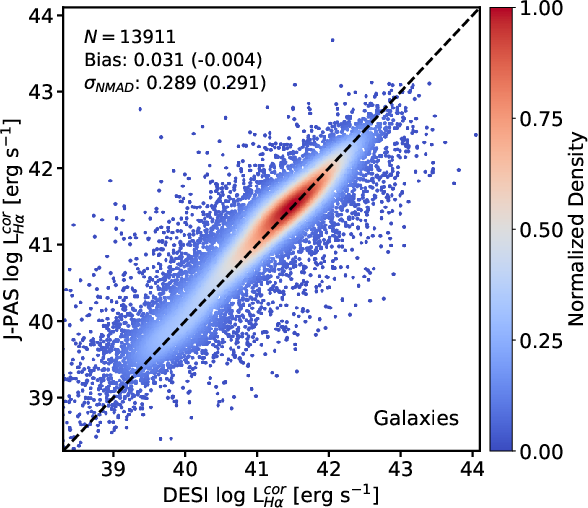
Figure 8: Comparison of extinction-corrected Hα luminosity from DESI spectroscopy and OJALÁ predictions.
OJALÁ retrieves stellar masses for galaxies with i5 dex and minimal bias. SFR is inferred with i6 dex for star-forming systems, limited by intrinsic degeneracies in optical SED SFR estimation and uncertainties in the reference CIGALE values. For QSOs, both mass and SFR inferences are unreliable due to AGN contamination of the host SED.
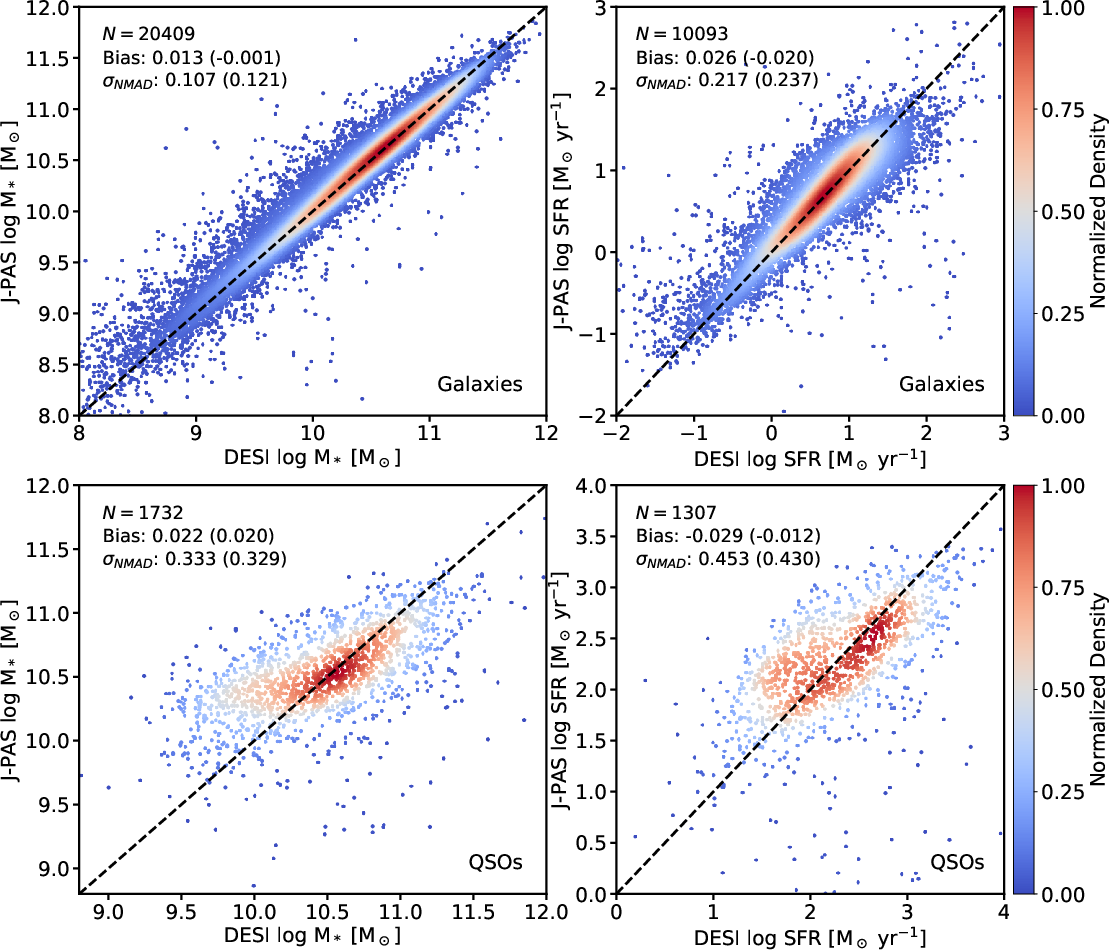
Figure 9: OJALÁ predictions vs. CIGALE-derived stellar mass and SFR for galaxies (top) and QSOs (bottom) with i7.
Black Hole Mass Regression
The autoregressive design enables seamless extension to new output variables: fine-tuning OJALÁ’s pre-trained embeddings for QSO black hole mass (i8) recovery achieves precision i9 dex—competitive with direct single-epoch virial mass estimation from spectra—for single-epoch MgII-based masses in z0 [2025ApJ...987...48P].
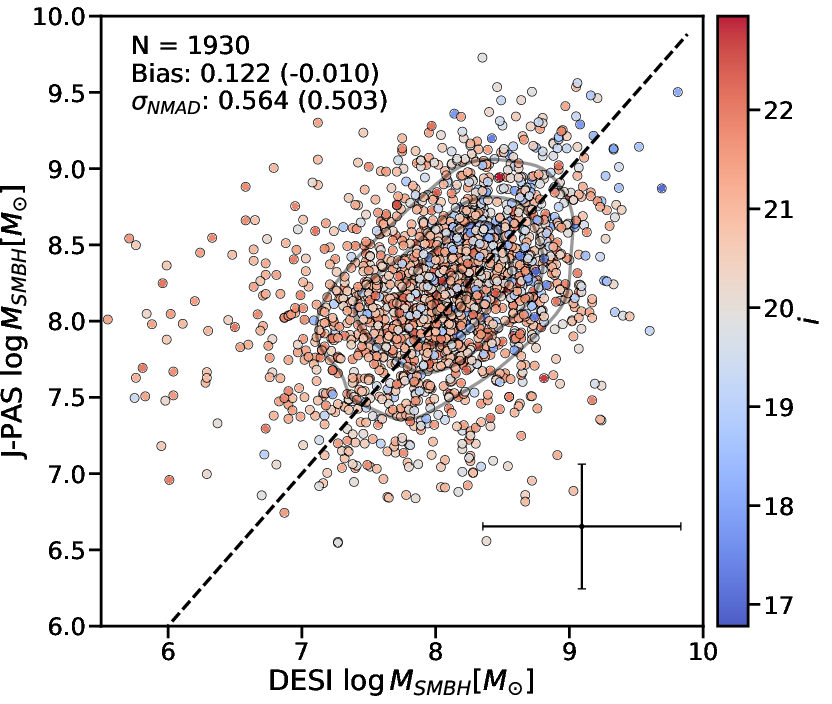
Figure 10: Comparison of spectroscopic and OJALÁ-predicted BH masses for DESI QSOs via fine-tuned embeddings.
Model Limitations and Theoretical Implications
OJALÁ is built as a compact (z14.6M parameter) foundation model, contrasting with the trend toward multi-hundred million parameter astronomical models. By leveraging a masked transformation of SED+physical property sequences with flexible attention, OJALÁ provides unified, efficient analysis at scale—processing 1M objects in under an hour on consumer hardware.
Model limitations are primarily:
- Unimodal Gaussian regression per continuous parameter, precluding full representation of non-Gaussian or multimodal posteriors,
- Performance drop-off for objects at domain boundaries or with rare/highly non-Gaussian properties,
- Intrinsic dependency on the physical reliability and selection biases of labeling catalogs (e.g., CIGALE SFRs, DESI spectroscopic types),
- Remaining sim-to-real gap for the rarest object types despite robust UDA.
Theoretical implications include the demonstration that a masked-token-based transformer foundation model can naturally absorb the heterogeneity of survey data, perform multi-task learning efficiently, and offer a foundation for higher-level downstream tasks, such as spatially resolved galaxy mapping, physics-aware segmentation, and multi-modal survey fusion. The modular architecture is inherently suited for expansion to richer data types (e.g., images, IFU cubes) and deeper physical parameter spaces.
Future Prospects
OJALÁ’s framework anticipates the needs of next-generation astronomical surveys and paves the way for:
- Scaling to IFU-enabled, spatially resolved SED analysis using embedding-based segmentation,
- Unified, multi-modal analysis incorporating photometry, low-res spectra, imaging, morphology, and time domain,
- Generative and probabilistic decoders for better calibration and uncertainty quantification,
- Deployment as a scientific foundation model that integrates incremental knowledge from new data releases and more sophisticated physical parameterizations.
Conclusion
OJALÁ establishes a new technical paradigm for large-scale survey SED analysis, delivering robust, multi-property inference from J-PAS data with demonstrated generalization to real observations and flexibility to extend to new tasks with minimal retraining. The model sets performance benchmarks for classification (z2), redshift estimation (z3 for galaxies), physical regression (e.g., stellar mass z4 dex, SFR z5 dex), and emission line analyses, and provides an effective foundation for scalable, physically informative survey science in the big-data regime (2604.00661).