- The paper presents a physically grounded analytical model that directly derives the electron back-scattering contribution to the PMT SPE response.
- It decomposes the overall response into contributions from the first dynode and subsequent dynodes, yielding closed-form expressions without relying on empirical fits.
- Experimental validation with two Hamamatsu PMT models confirms the model's accuracy and its potential to standardize detector calibration for precision applications.
Analytical Model for the Photomultiplier Single Photoelectron Response Incorporating Electron Back-scattering
Introduction
The paper "Analytical model for the photomultiplier single photoelectron response including the electron back-scattering contribution" (2604.02826) presents a comprehensive analytical framework for describing the single photoelectron (SPE) charge response of photomultiplier tubes (PMTs), with a particular focus on accurately modeling the intermediate-charge region dominated by partially amplified photoelectrons. Unlike empirical or ad hoc descriptions typically used for the region between the full-amplification SPE peak and electronics pedestal, this work derives the response directly from the underlying physics of secondary emission and back-scattering processes at the first dynode.
Physical Model of the SPE Response
Electron Multiplication Structure
The SPE response is decomposed into distinct contributions reflecting the electron dynamics at the first dynode and in the subsequent dynode chain. The first dynode is pivotal: the gain G1 is maximized, as its fluctuations dictate the overall spectral shape. Signals originating downstream, from the remaining N−1 dynodes, introduce additional Gaussian smearing and generate a low-charge background due to dark events and incomplete multiplication.
Back-scattering at the First Dynode
A key feature addressed is the significant fraction (η≳0.3) of primary photoelectrons that are inelastically back-scattered at the first dynode [Wright]. These electrons deposit only part of their kinetic energy, yielding a continuum of partially amplified events with reduced secondary electron emission compared to the fully amplified case.
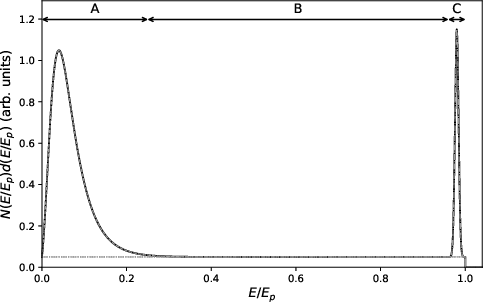
Figure 1: Kinetic energy distribution of secondary electrons emitted by a dynode after being hit by primary electrons of energy Ep. Three regions indicate fully and partially amplified emission as well as elastic back-scatter.
The probability for emitting n secondary electrons in fully amplified events follows a Poissonian distribution with mean G1, while for partially amplified (back-scattered) electrons, an analytic result is obtained by integrating over possible deposited energies. Both are combined to yield the total discrete first-dynode response.
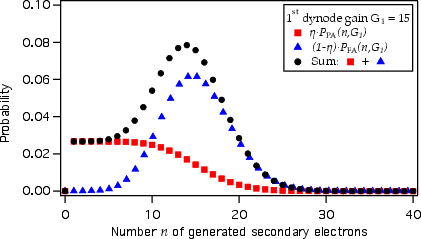
Figure 2: Discrete probability density of secondary electrons emitted at the first dynode, decomposed into fully amplified (blue), partially amplified (red), and total (black) components (e.g., η=0.3, G1=15).
The full continuous SPE response function is constructed by convolving the discrete response from the first dynode with the resolution function imposed by subsequent dynodes and electronics. The model results in closed-form, physically motivated expressions—eliminating the reliance on empirical components such as exponentially modified Gaussians for the intermediate region. Notably, the partially amplified charge distribution is approximated by an error-function-shaped "box" with parameters determined solely by intrinsic PMT properties: G1, gain f, resolution N−10, and electronics noise N−11.
Additional low-charge contributions, arising from pre-pulses (photons incident directly on the first dynode) and electrons with aberrant trajectories, are explicitly modeled and incorporated, where their relative magnitudes are determined by fit fractions in experimental SPE spectra.
Experimental Validation
The model was rigorously validated with data from two Hamamatsu PMT models (R5912-100 and 6233), each operated under varying high voltages, illumination positions, and wavelengths. The readout chain was optimized for low noise, as characterized in the measured noise power spectrum.
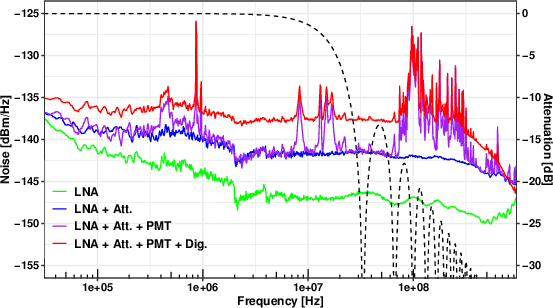
Figure 3: Noise spectra highlighting components of the PMT read-out chain. Notable are features around 2--3 MHz (instrumental) and pick-up at 100 MHz.
SPE spectra, both in light-on and dark conditions, were acquired using low-level pulsed laser illumination. Data processing included baseline correction, integration in optimized windows, and subtraction of the pedestal and dark-count contributions to obtain the true single electron response.
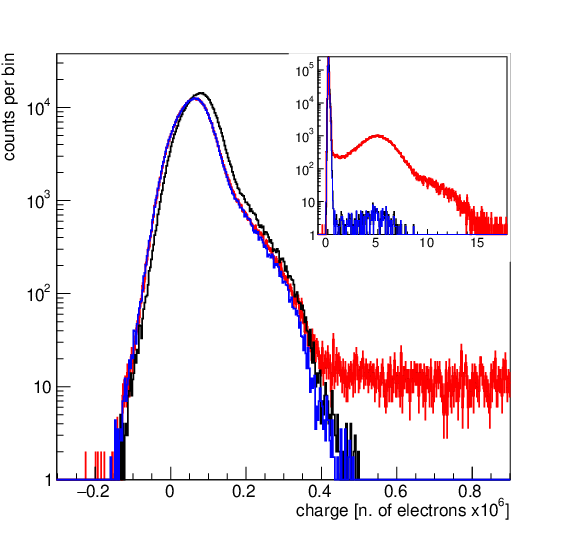

Figure 4: (Left) SPE spectrum of R5912-100 under 405 nm illumination, showing full and dark baseline. (Right) Pedestal-subtracted spectral response.
Time-resolved analysis enabled disentangling the contributions of delayed (back-scattered) and anticipated (pre-pulse) signals, further refining the model fit and allowing for precise parameter extraction.


Figure 5: Signal time versus spectral response for R5912-100 (left) and 6233 (right). The pedestal is visible as the vertical yellow band at zero charge.

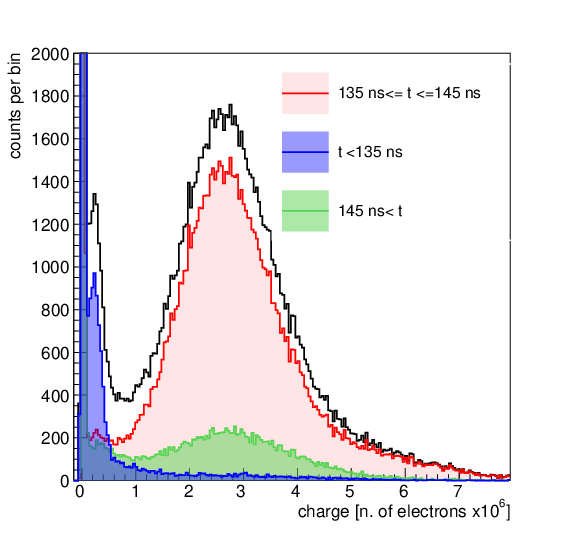
Figure 6: Time-resolved spectral response histograms in on-time, delayed, and anticipated regions for R5912-100 (left) and 6233 (right).
Fit Quality and Parameter Dependencies
The analytical model achieves excellent fit quality: normalized N−12ndf values cluster around unity across all tested operating conditions. For R5912-100, the fraction of events attributable to back-scattering consistently lies in the range N−13 for central illumination, rising to over 33% in lateral positions. Exponential low-charge tails (modeled via a dedicated exponential-Gaussian component) were quantitatively extracted as N−14–10%, with pre-pulse contributions being negligible for this model. In contrast, 6233 data necessitated significant inclusion of pre-pulse events (N−15) with reduced back-scattering.

Figure 7: Fit to the R5912-100 spectral response at HV=1200 V under 405 nm illumination, decomposed into single- and double-photoelectron contributions. Top: normalized pull distribution.
Fit parameter scans as a function of applied high voltage reveal the expected scaling of N−16 and N−17, while fractions N−18 and N−19 display robust independence from HV within experimental uncertainties, but may vary with illumination geometry.
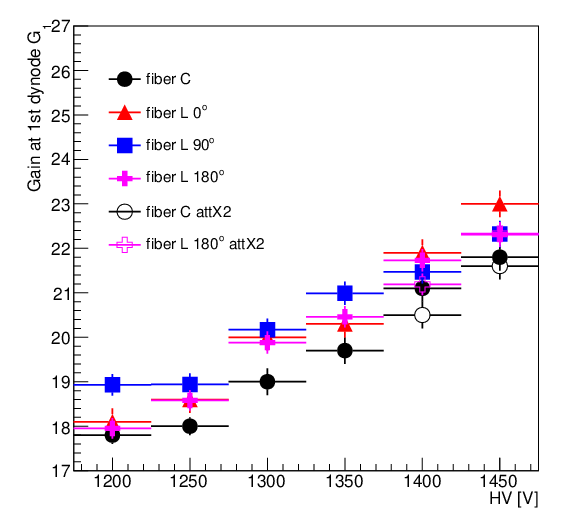
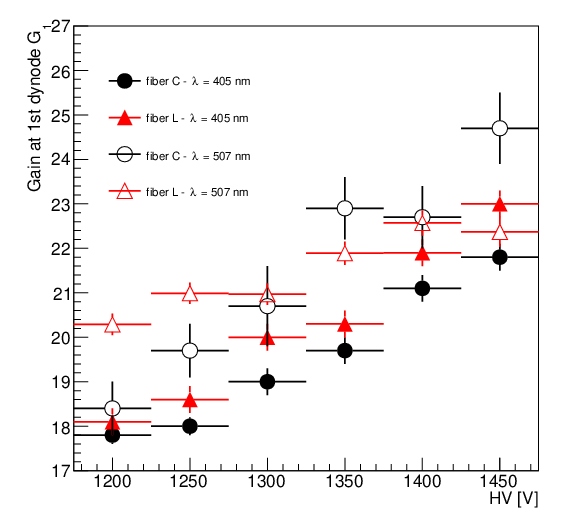
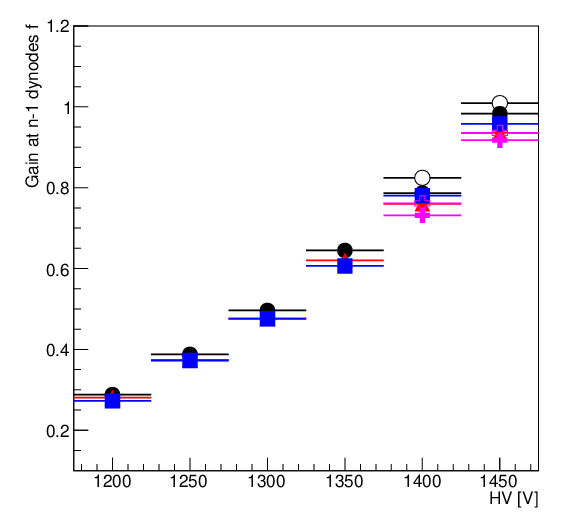
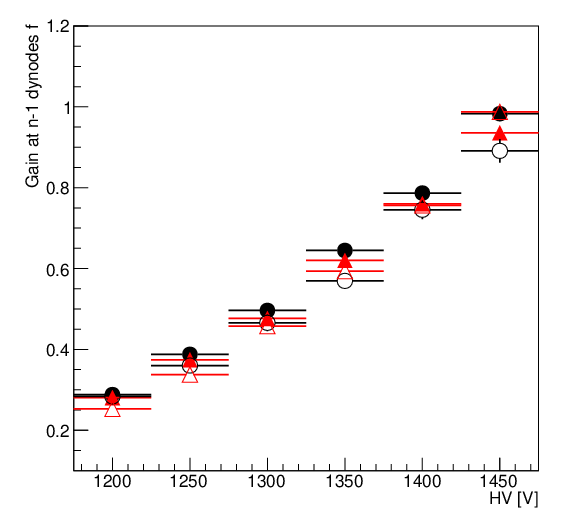
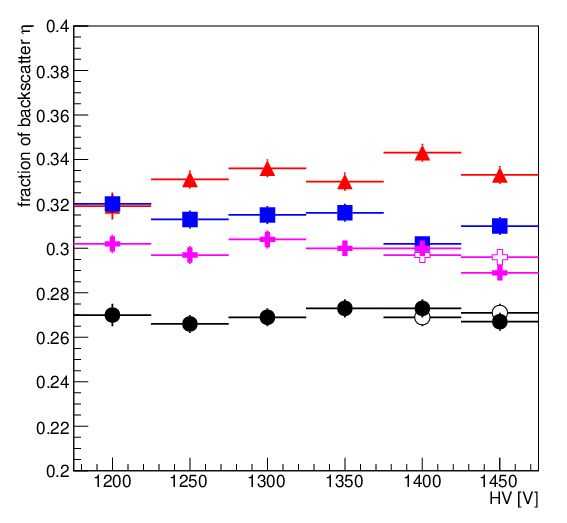
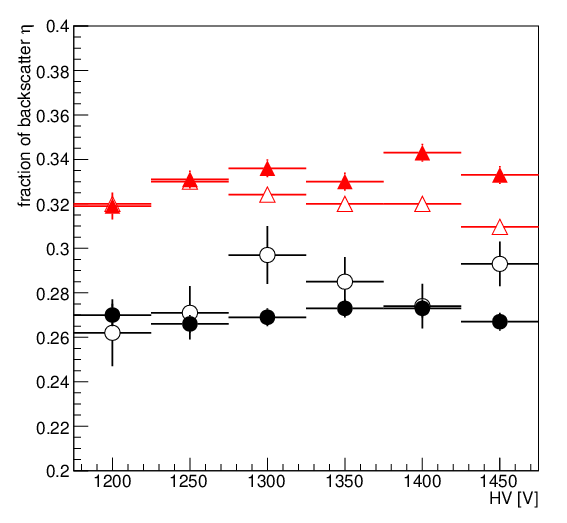
Figure 8: Fit parameter trends versus high voltage showing η≳0.30, η≳0.31, and η≳0.32.
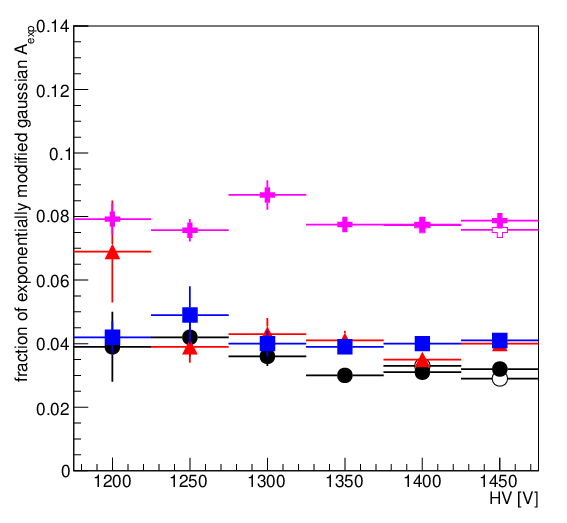
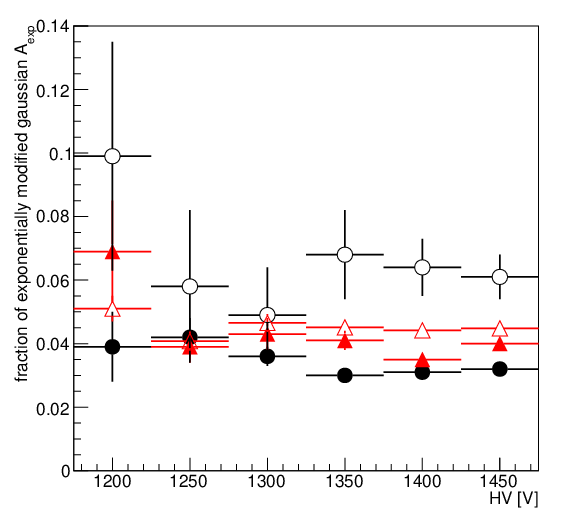
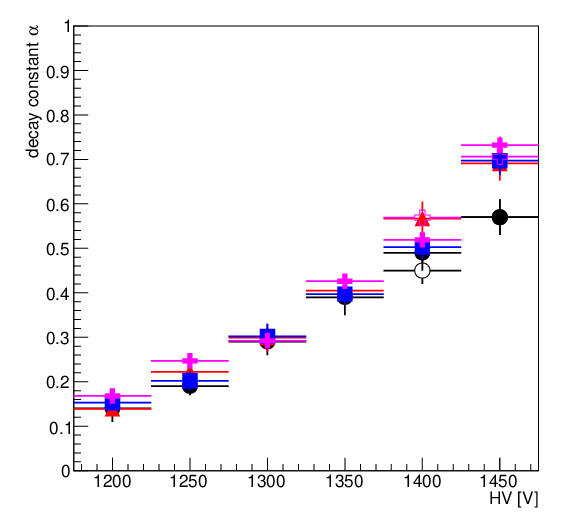
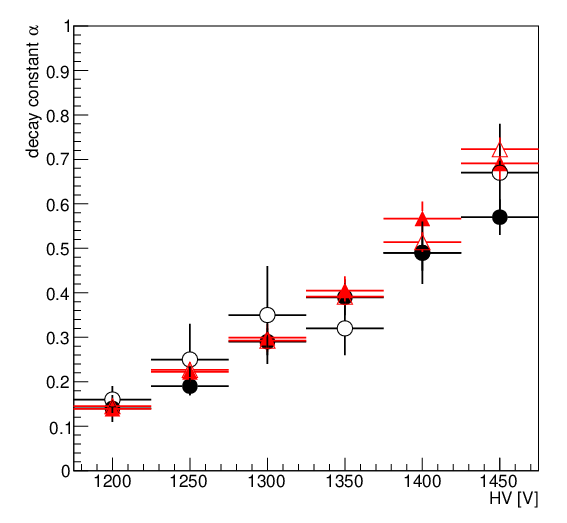
Figure 9: Trends with high voltage for η≳0.33 and decay constant η≳0.34.
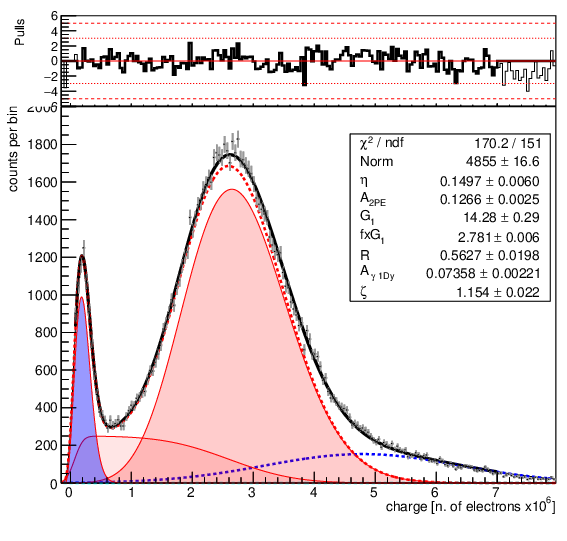
Figure 10: Representative fit and pull distribution for Hamamatsu 6233 at HV=1300 V and η≳0.35=405 nm.
Implications and Prospects
The presented model offers a fully analytical, physically grounded formalism that accurately describes the entire SPE spectrum—including the problematic intermediate region—using a minimal set of intrinsic PMT parameters. This eliminates reliance on ad hoc or empirical fit functions, thereby enhancing the fidelity and interpretability of PMT calibrations in precision low-background experiments, such as dark matter and neutrino observatories.
The explicit treatment of back-scattering and its quantitative isolation from low-charge and timing components enables deeper insights into underlying PMT physics and facilitates improved detector modeling, acceptance characterization, and simulation. Given its universality and physical motivation, adoption of this framework can standardize PMT analysis across a spectrum of experimental applications.
Conclusion
This work introduces a robust analytical model for the PMT single photoelectron response that comprehensively incorporates the effects of electron back-scattering, fully amplified signals, pre-pulses, and low-charge backgrounds within a unified formulation. Experimental validation with two distinct PMT models demonstrates excellent agreement over variations in operational and geometric parameters. The approach, relying on a limited set of fundamental parameters, is poised for widespread adoption in detector characterization, simulation, and calibration contexts where precise SPE response modeling is essential (2604.02826).