Blind-Spot Mass: A Good-Turing Framework for Quantifying Deployment Coverage Risk in Machine Learning Systems
Published 6 Apr 2026 in cs.LG and stat.ML | (2604.05057v1)
Abstract: Blind-spot mass is a Good-Turing framework for quantifying deployment coverage risk in machine learning. In modern ML systems, operational state distributions are often heavy-tailed, implying that a long tail of valid but rare states is structurally under-supported in finite training and evaluation data. This creates a form of 'coverage blindness': models can appear accurate on standard test sets yet remain unreliable across large regions of the deployment state space. We propose blind-spot mass B_n(tau), a deployment metric estimating the total probability mass assigned to states whose empirical support falls below a threshold tau. B_n(tau) is computed using Good-Turing unseen-species estimation and yields a principled estimate of how much of the operational distribution lies in reliability-critical, under-supported regimes. We further derive a coverage-imposed accuracy ceiling, decomposing overall performance into supported and blind components and separating capacity limits from data limits. We validate the framework in wearable human activity recognition (HAR) using wrist-worn inertial data. We then replicate the same analysis in the MIMIC-IV hospital database with 275 admissions, where the blind-spot mass curve converges to the same 95% at tau = 5 across clinical state abstractions. This replication across structurally independent domains - differing in modality, feature space, label space, and application - shows that blind-spot mass is a general ML methodology for quantifying combinatorial coverage risk, not an application-specific artifact. Blind-spot decomposition identifies which activities or clinical regimes dominate risk, providing actionable guidance for industrial practitioners on targeted data collection, normalization/renormalization, and physics- or domain-informed constraints for safer deployment.
The paper introduces blind-spot mass as a novel extension of the Good–Turing estimator to quantify deployment risk in ML by measuring under-supported operational states.
It employs empirical evaluations on wearable HAR and clinical datasets to show that increased abstraction leads to higher blind-spot mass and estimator variance.
The paper demonstrates that high test accuracy can hide significant blind regions, imposing an accuracy ceiling and highlighting the need for targeted data augmentation.
Quantifying Deployment Coverage Risk in ML Through Blind-Spot Mass
Introduction and Motivation
This paper presents blind-spot mass, a thresholded generalization of the Good–Turing unseen mass estimator, as a formal framework for quantifying deployment coverage risk in ML systems. Modern deployment environments, especially for edge AI scenarios such as wearable human activity recognition (HAR), exhibit heavy-tailed operational state distributions. This means that the vast majority of actual deployment conditions are only sparsely represented — or entirely absent — within training and evaluation datasets. While traditional test accuracy and common risk detection approaches (OOD detection, shift monitoring, conformal prediction) provide valuable insights, they do not directly quantify the probability mass associated with operational “blind spots” where the model has a priori insufficient support to ensure reliable predictions.
Theoretical Foundations: Blind-Spot Mass
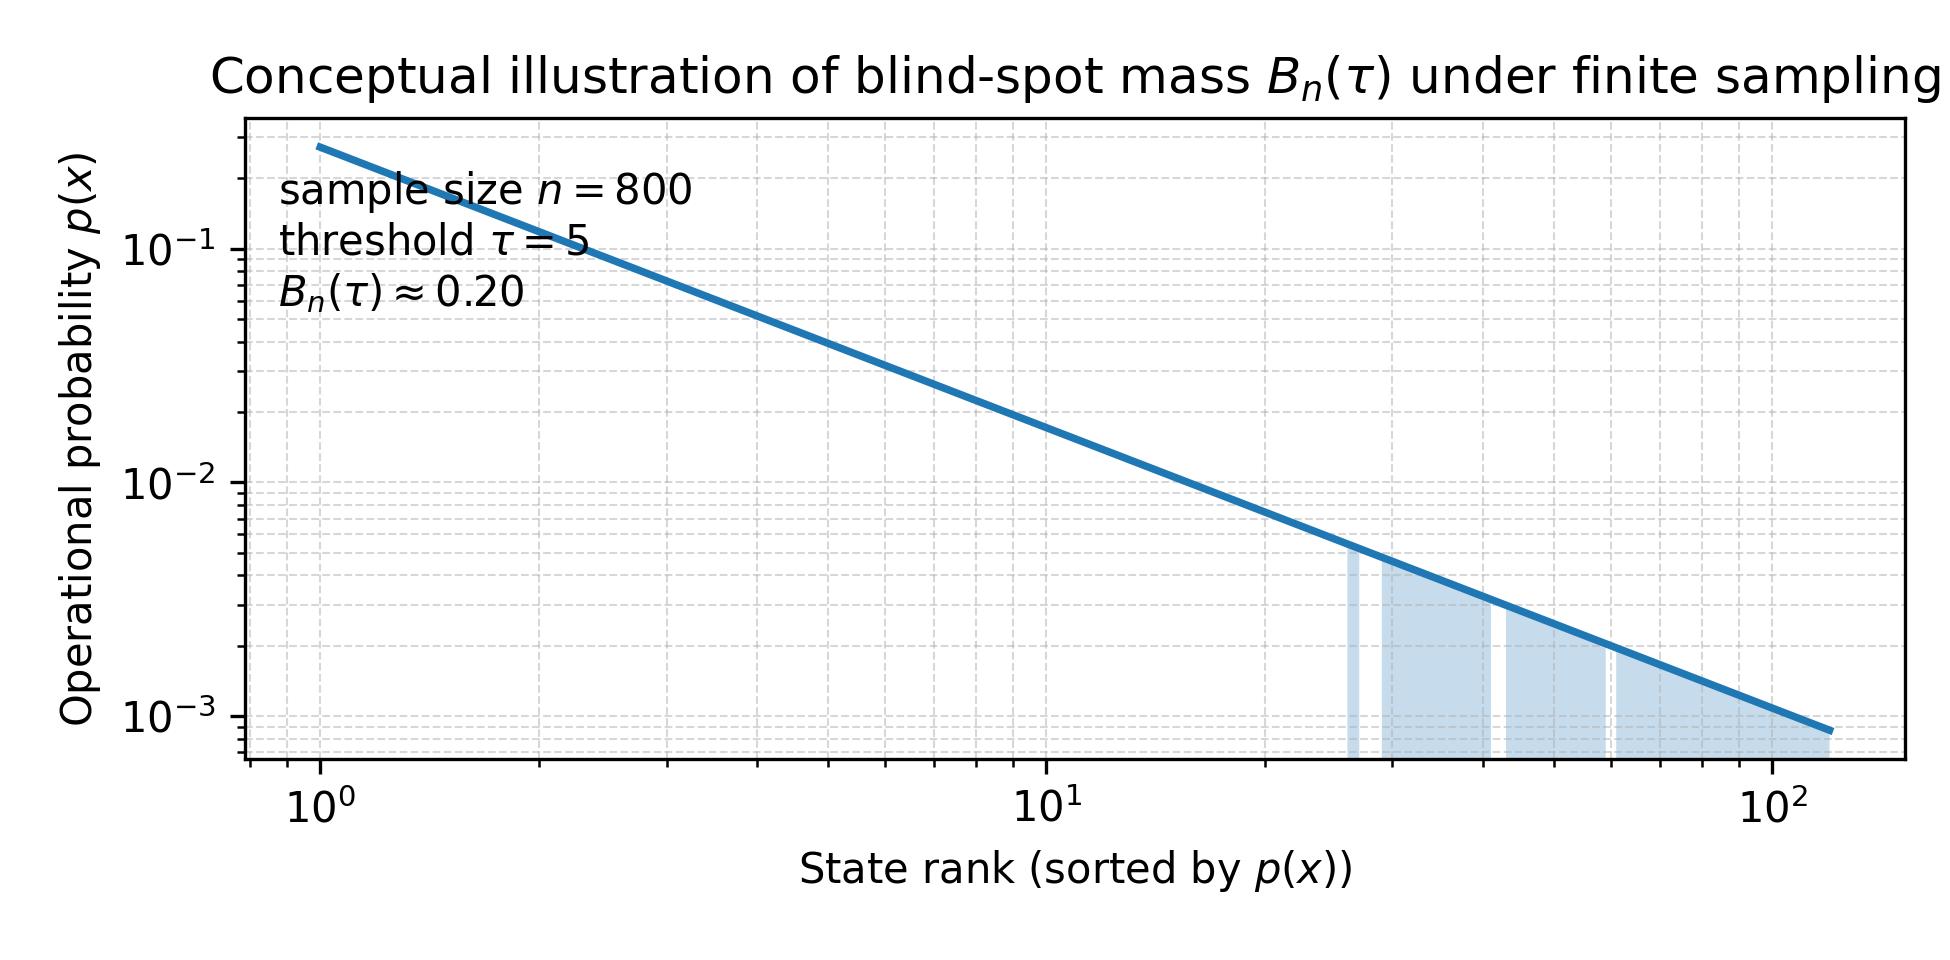
The core construct is the blind-spot mass Bn(τ), defined as the total deployment probability of all states x for which the empirical support Nn(x) in sample size n falls below a threshold τ. This threshold can be set to reflect the minimum number of examples required for a state to be deemed adequately supported (for instance, for a given marginal error guarantee or for model tuning/hyperparameter search sufficiency). For τ=1, Bn(1) collapses to the Good–Turing unseen mass.
Figure 1: Conceptual illustration of blind-spot mass under finite sampling, showing the fraction of operational state probability in under-supported regions.
By construction, as the operational abstraction becomes more refined (increasing the cardinality of the effective state space Keff), the observed empirical support per state shrinks, and the blind-spot mass increases for fixed n. This formalizes a key deployment risk: apparent generalization metrics may fail to reveal extensive reliability deficits across long-tailed, structurally under-sampled state manifolds.
Empirical Evaluation in Wearable HAR
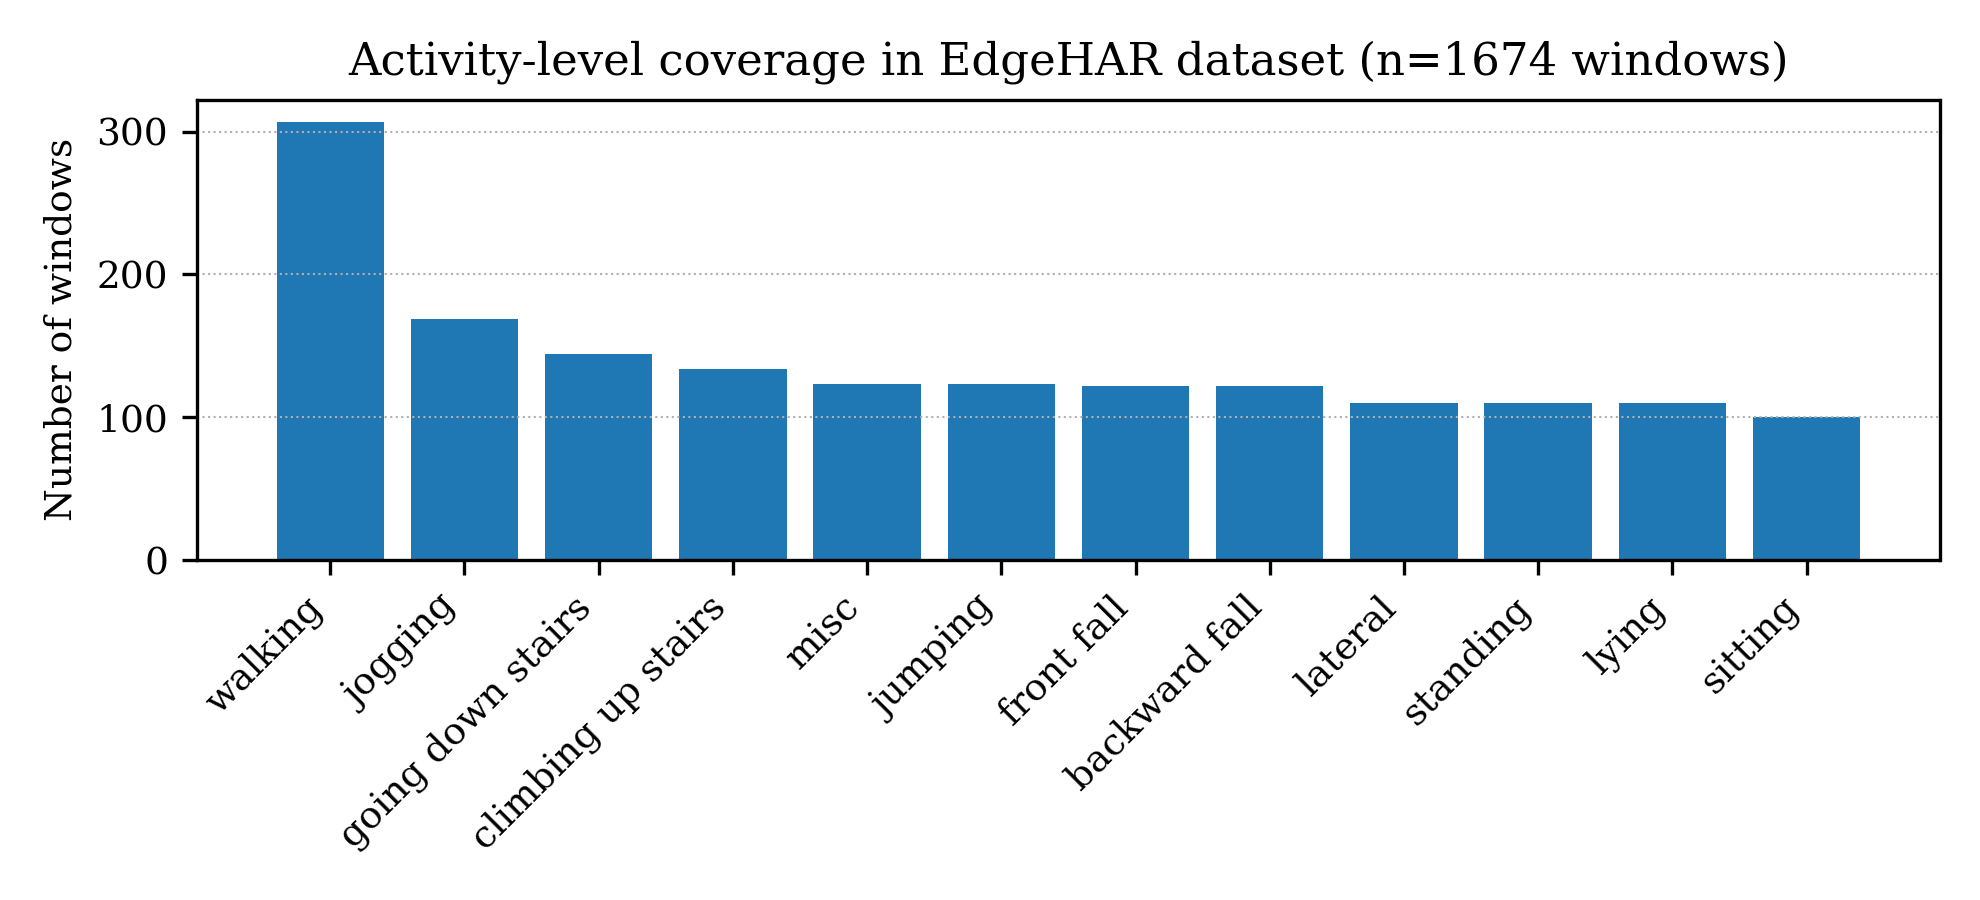
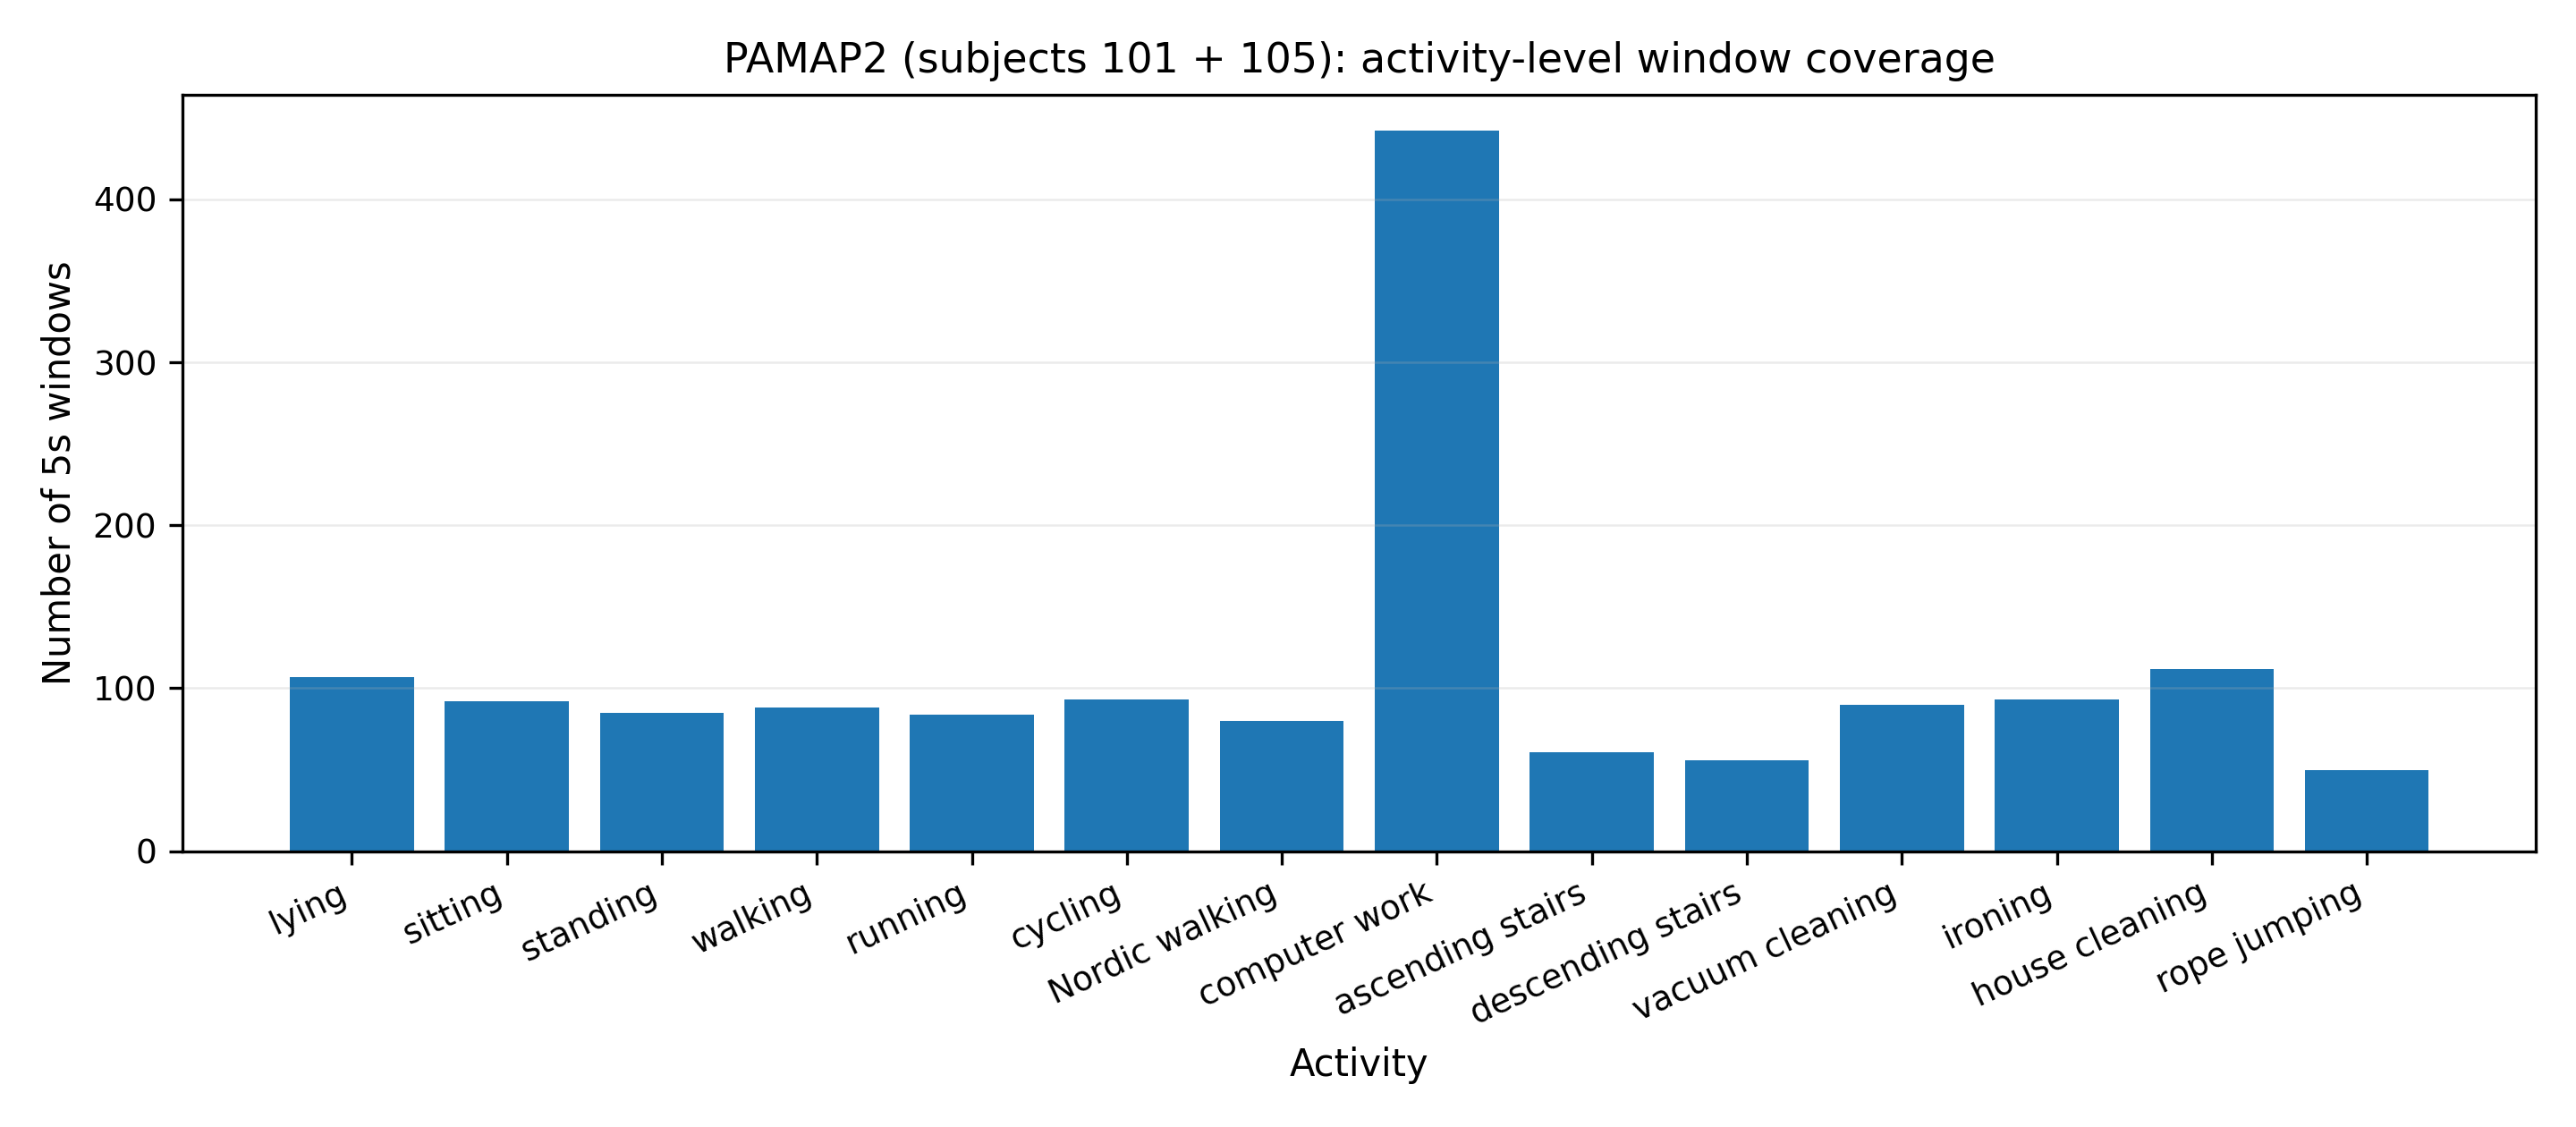
The framework is instantiated and validated in two representative wearable HAR settings: a proprietary, industry-collaborative in-house dataset and the open PAMAP2 benchmark, both featuring multi-class activity data with windowed IMU features. Analyses include explicit enumeration of activity-level support counts and demonstrate substantial heterogeneity in coverage.
Figure 2: Activity-level window counts demonstrate coverage imbalance across activity classes in both the in-house and PAMAP2 datasets.
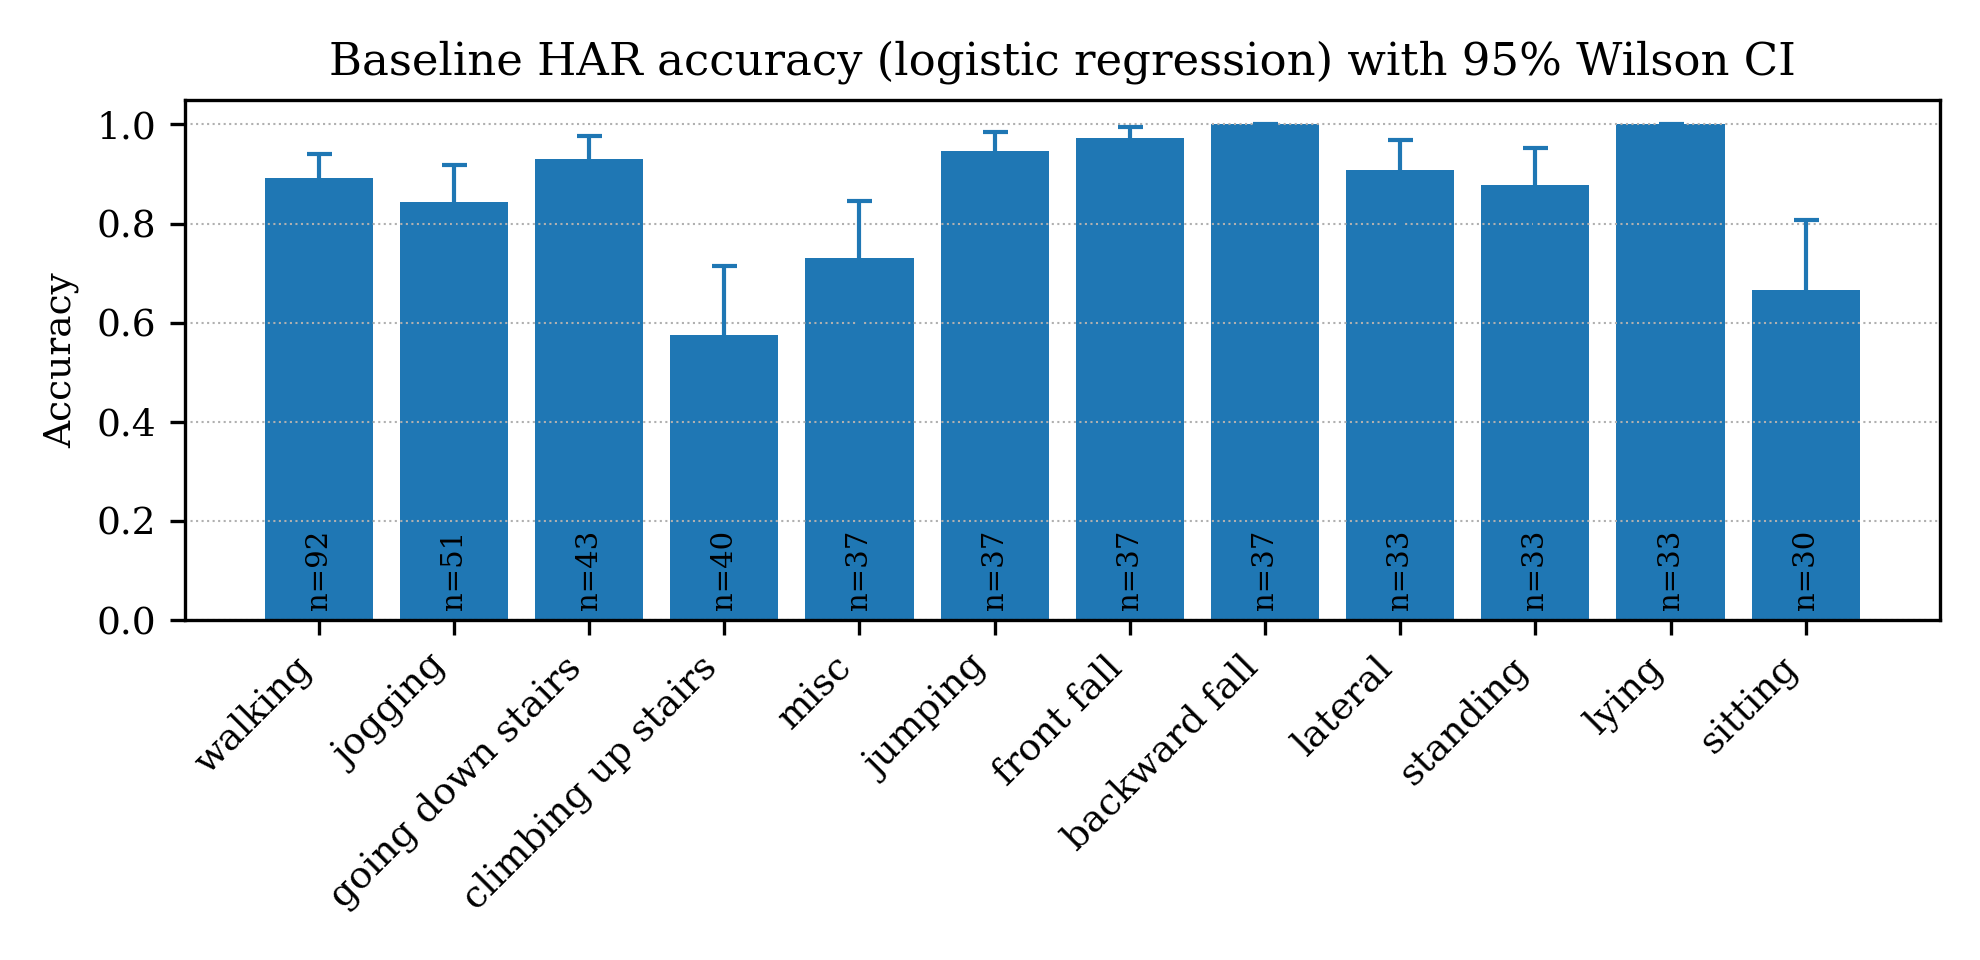
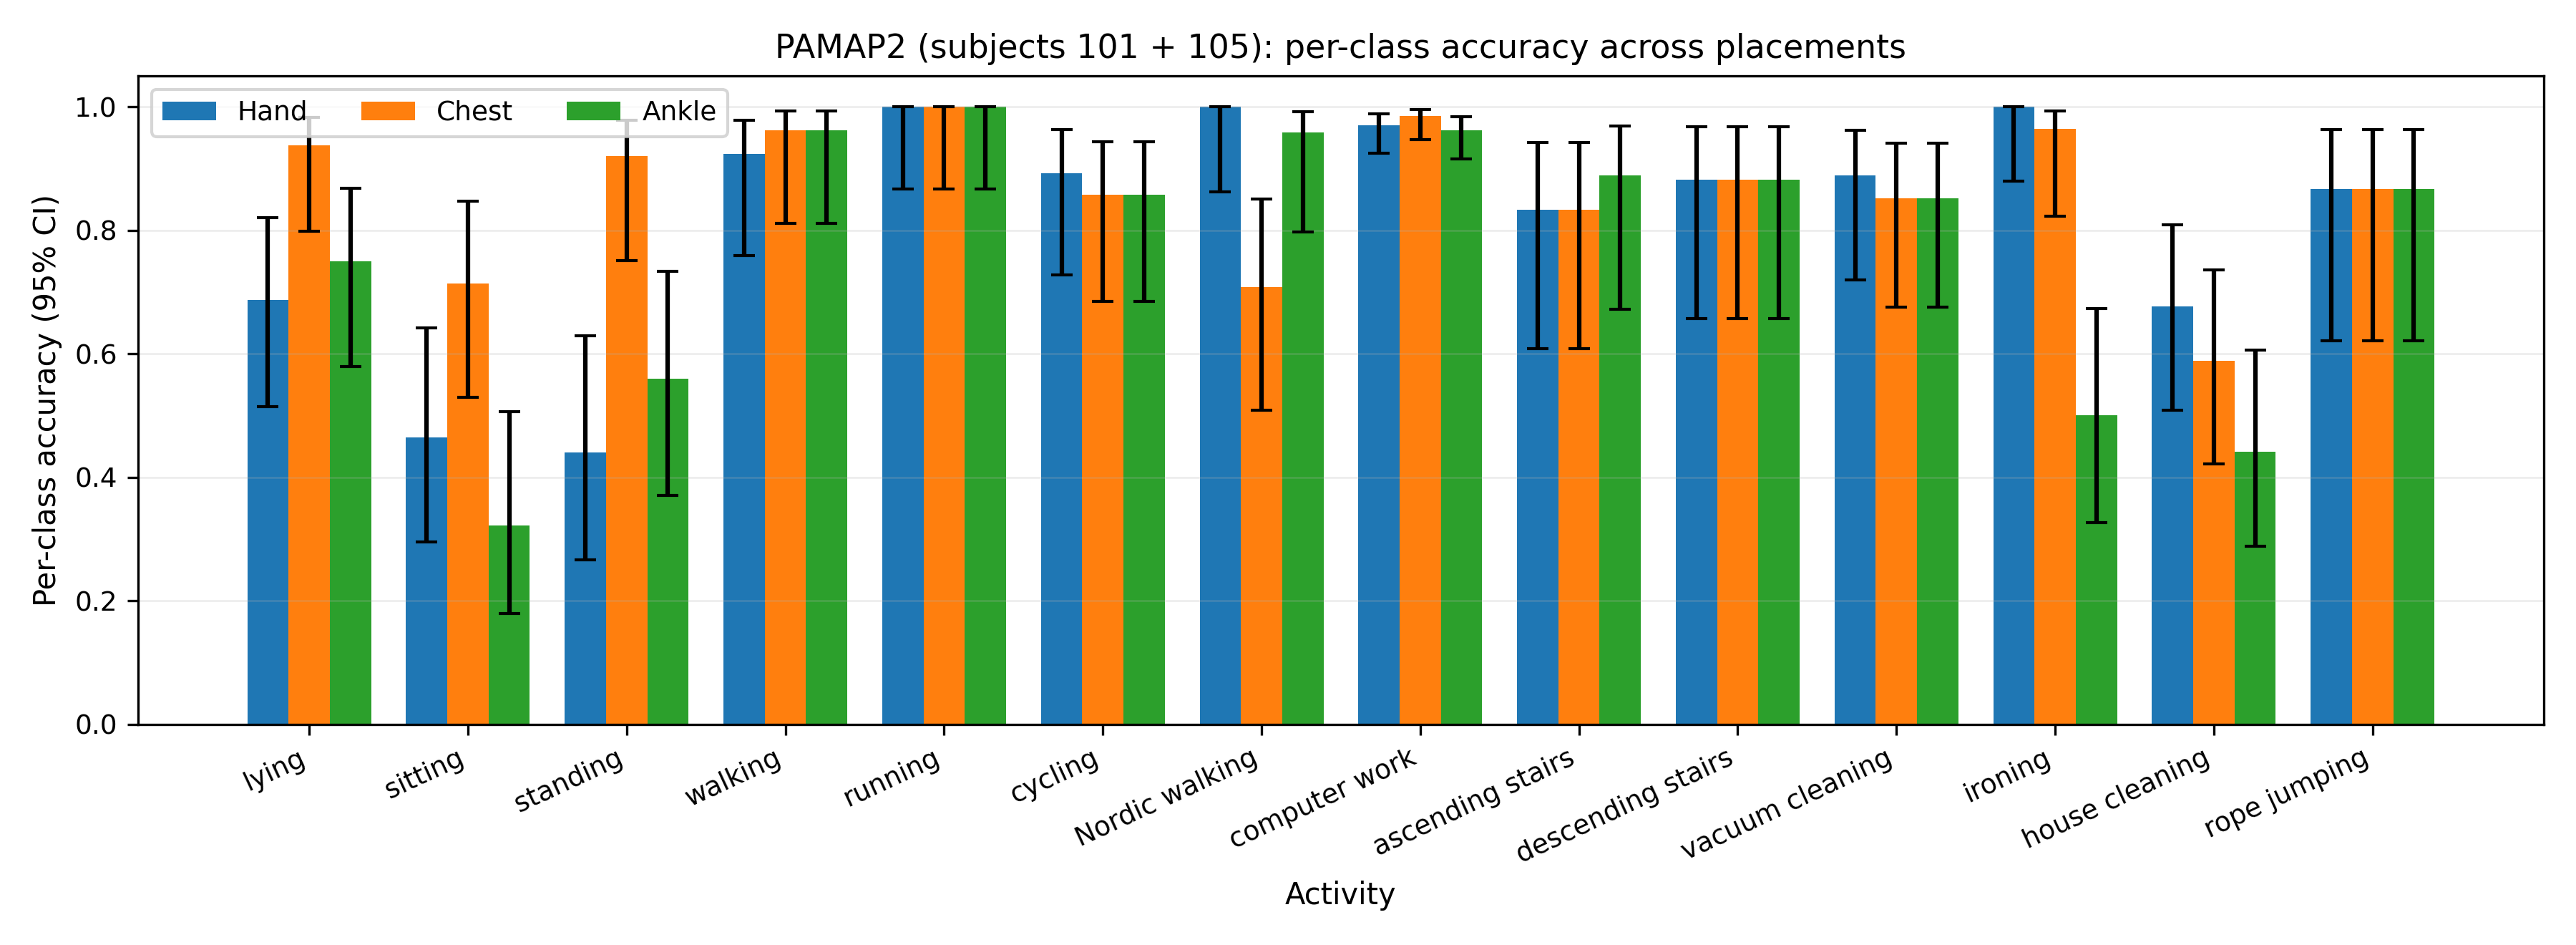
Further, per-class accuracies (along with Wilson 95% confidence intervals) highlight the frailty of test estimates under limited support, confirming that small test-set supports lead to pronounced estimator variance across activities and placements.
Figure 3: Per-class accuracy estimates with confidence intervals on in-house and PAMAP2 datasets reveal placement and support-based performance heterogeneity.
Blind-Spot Mass Behavior, State Refinement, and Cross-Domain Generality
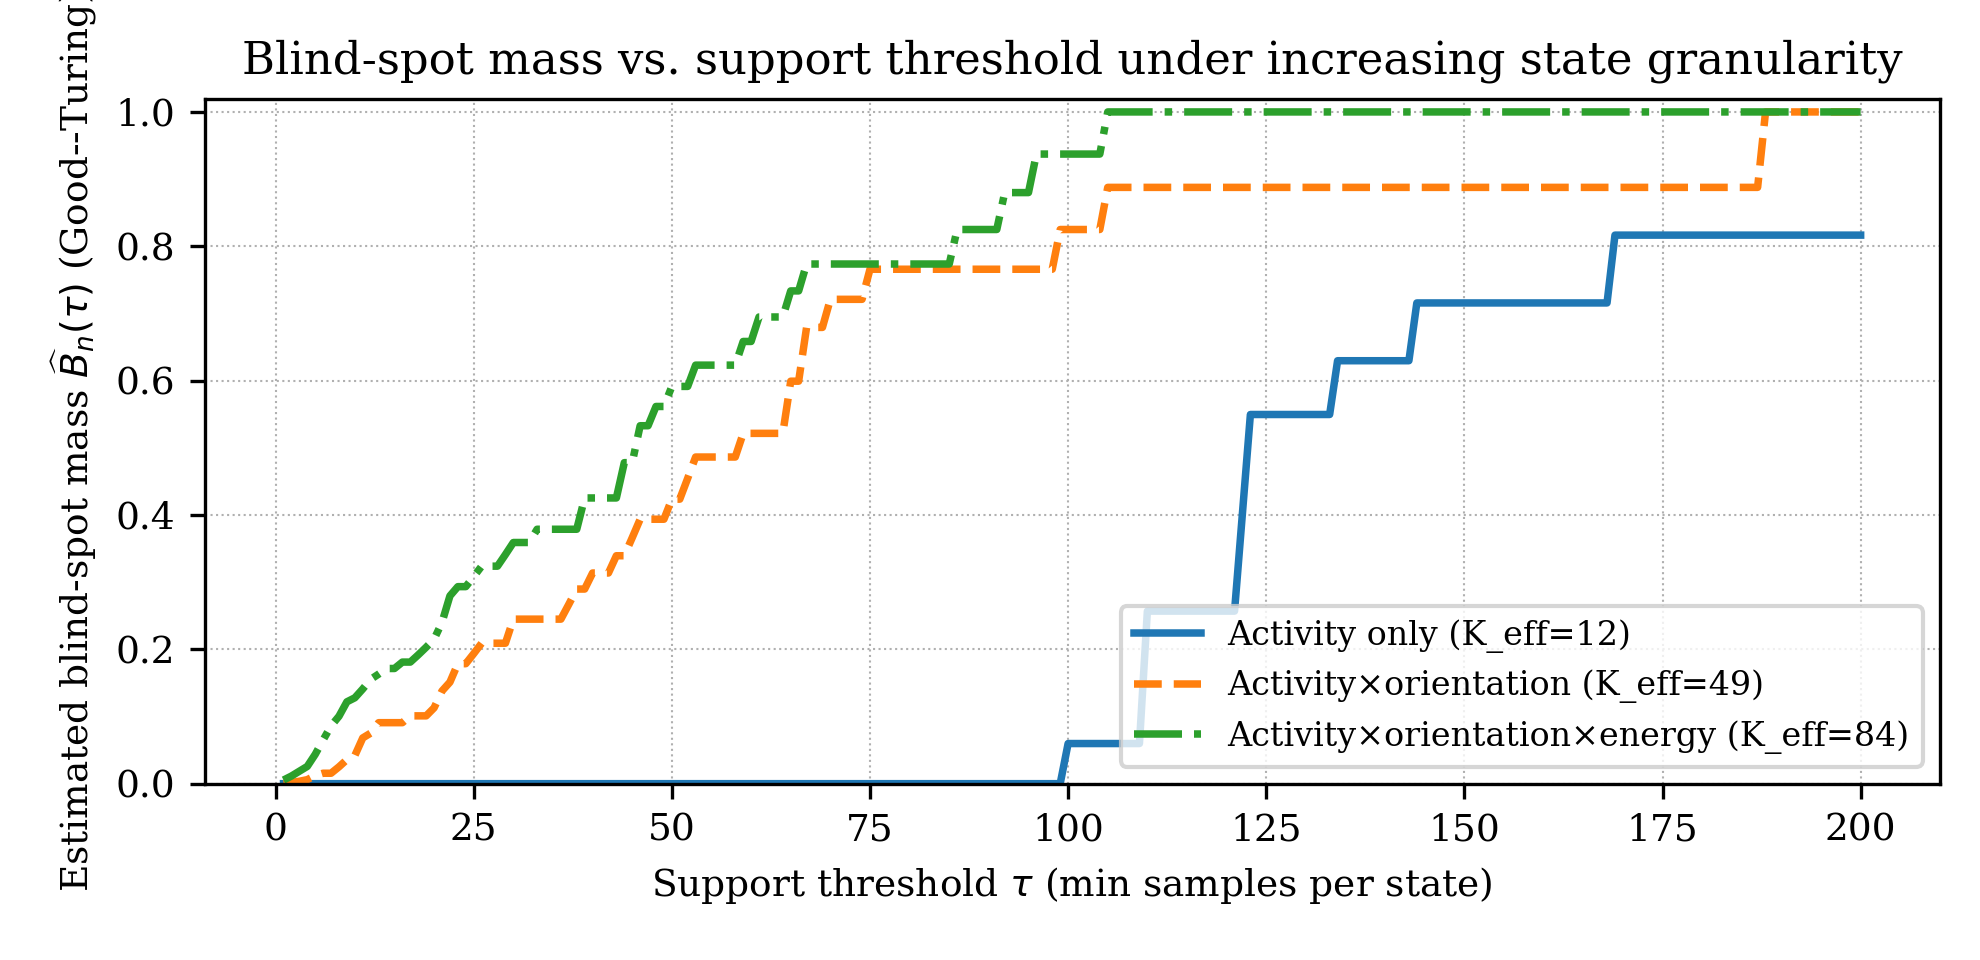
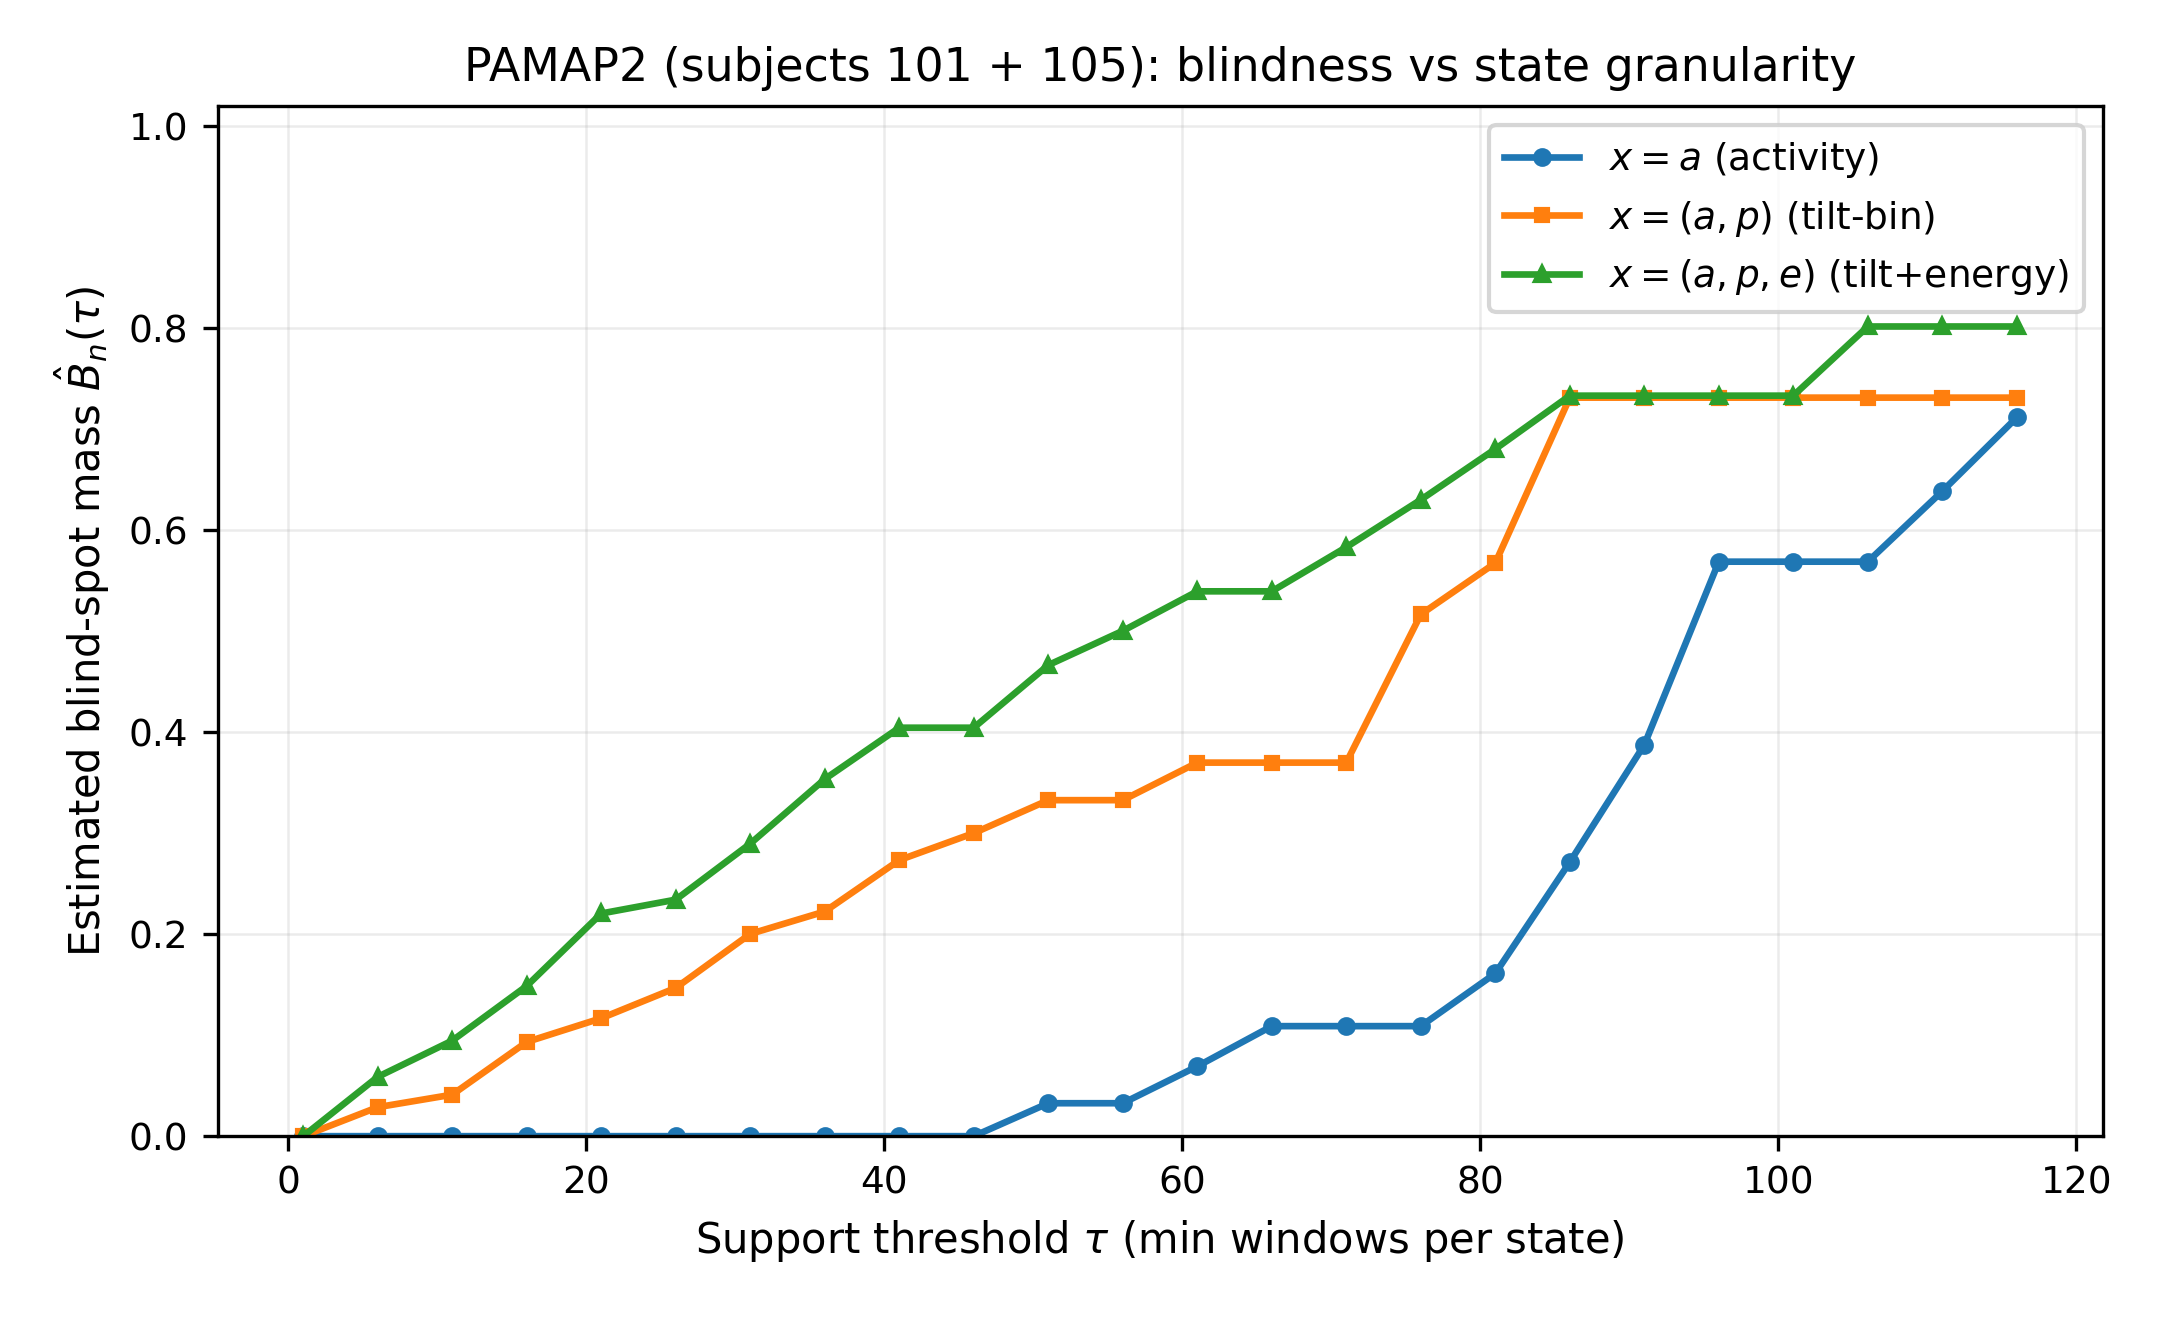
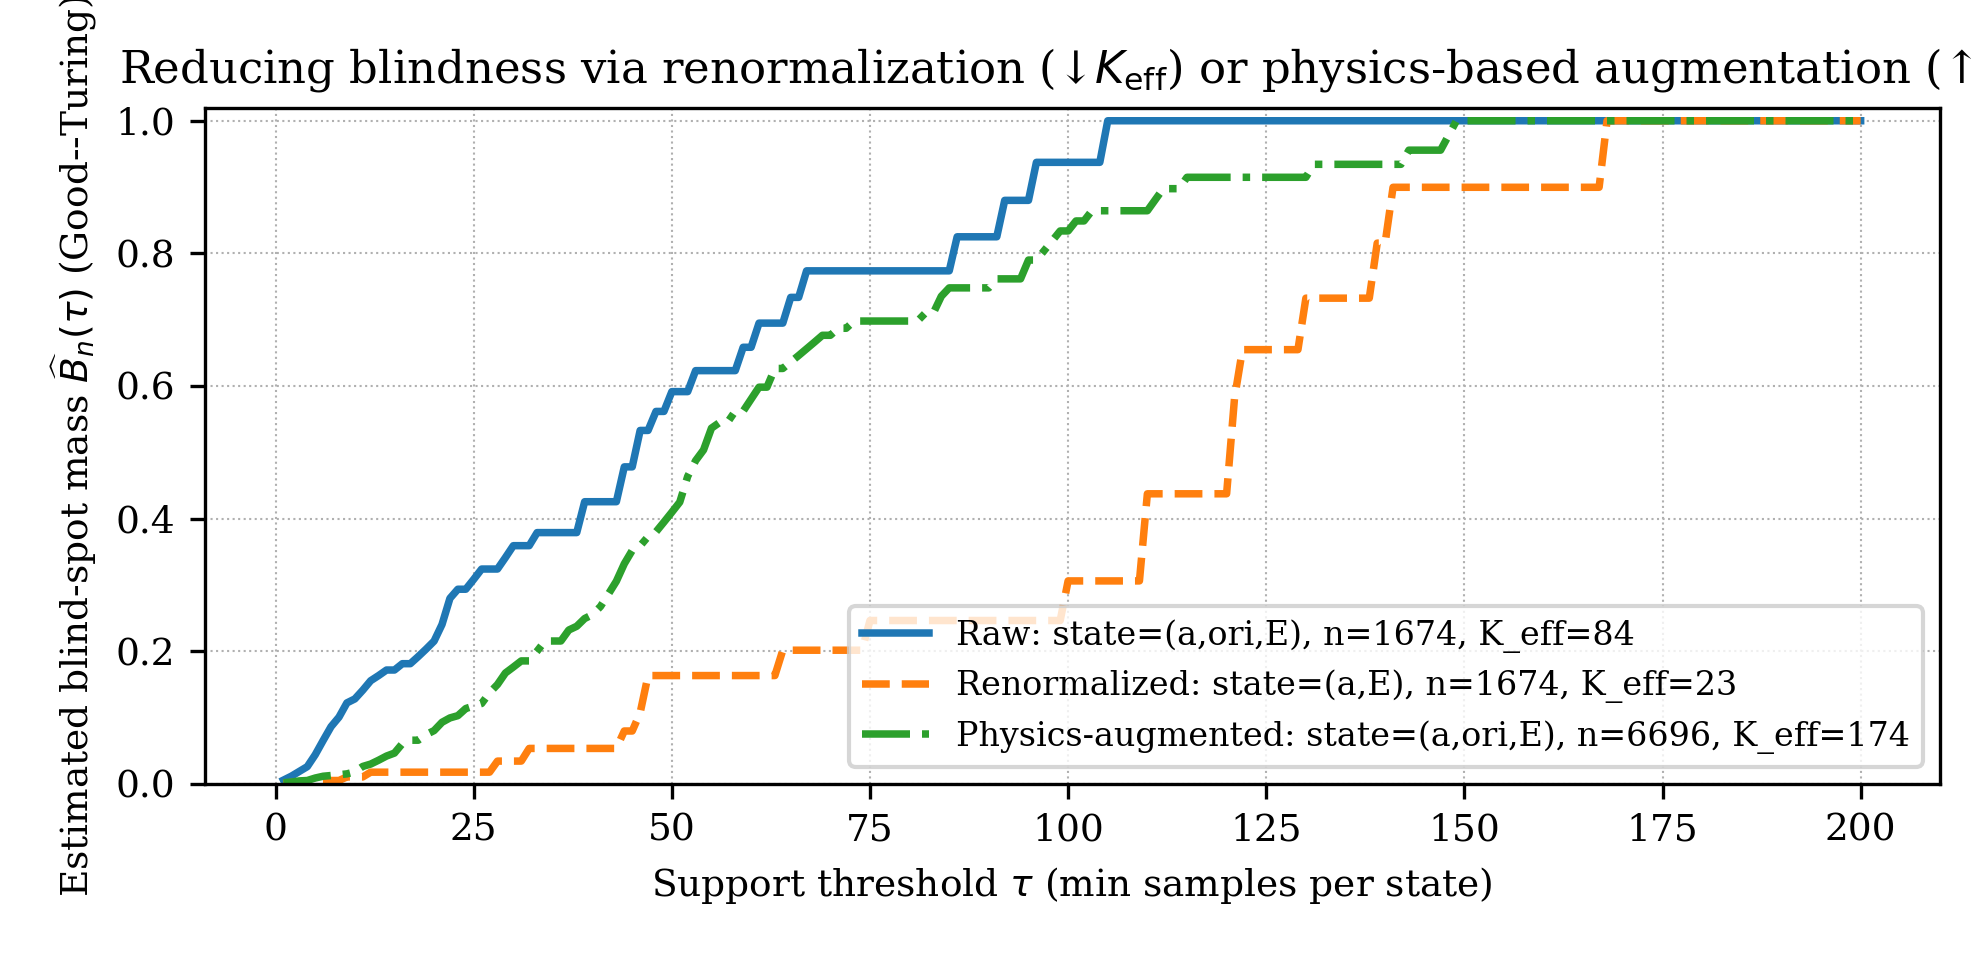
A central empirical finding is the sharp inflection of Bn(τ) as the support threshold x0 is increased or as the operational state abstraction is refined from coarse (activity-only) to composite (activity and quantized proxies for placement/orientation and motion energy).
Figure 4: Estimated blind-spot mass x1 increases rapidly with x2 and with refinement of the operational abstraction (activity-only to composite state features).
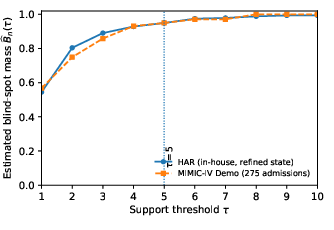
Replication of these results on the MIMIC-IV clinical admissions dataset (using ICD code prefixes as the operational state space) verifies that this combinatorial growth of blind-spot mass emerges in fundamentally distinct domains, confirming the generality of the phenomenon.
Figure 5: Cross-domain replication shows that blind-spot mass curves converge in both wearable and clinical state abstractions, indicating structural coverage blindness across applications.
Implications: Coverage-Imposed Accuracy Ceiling and Blindness Decomposition
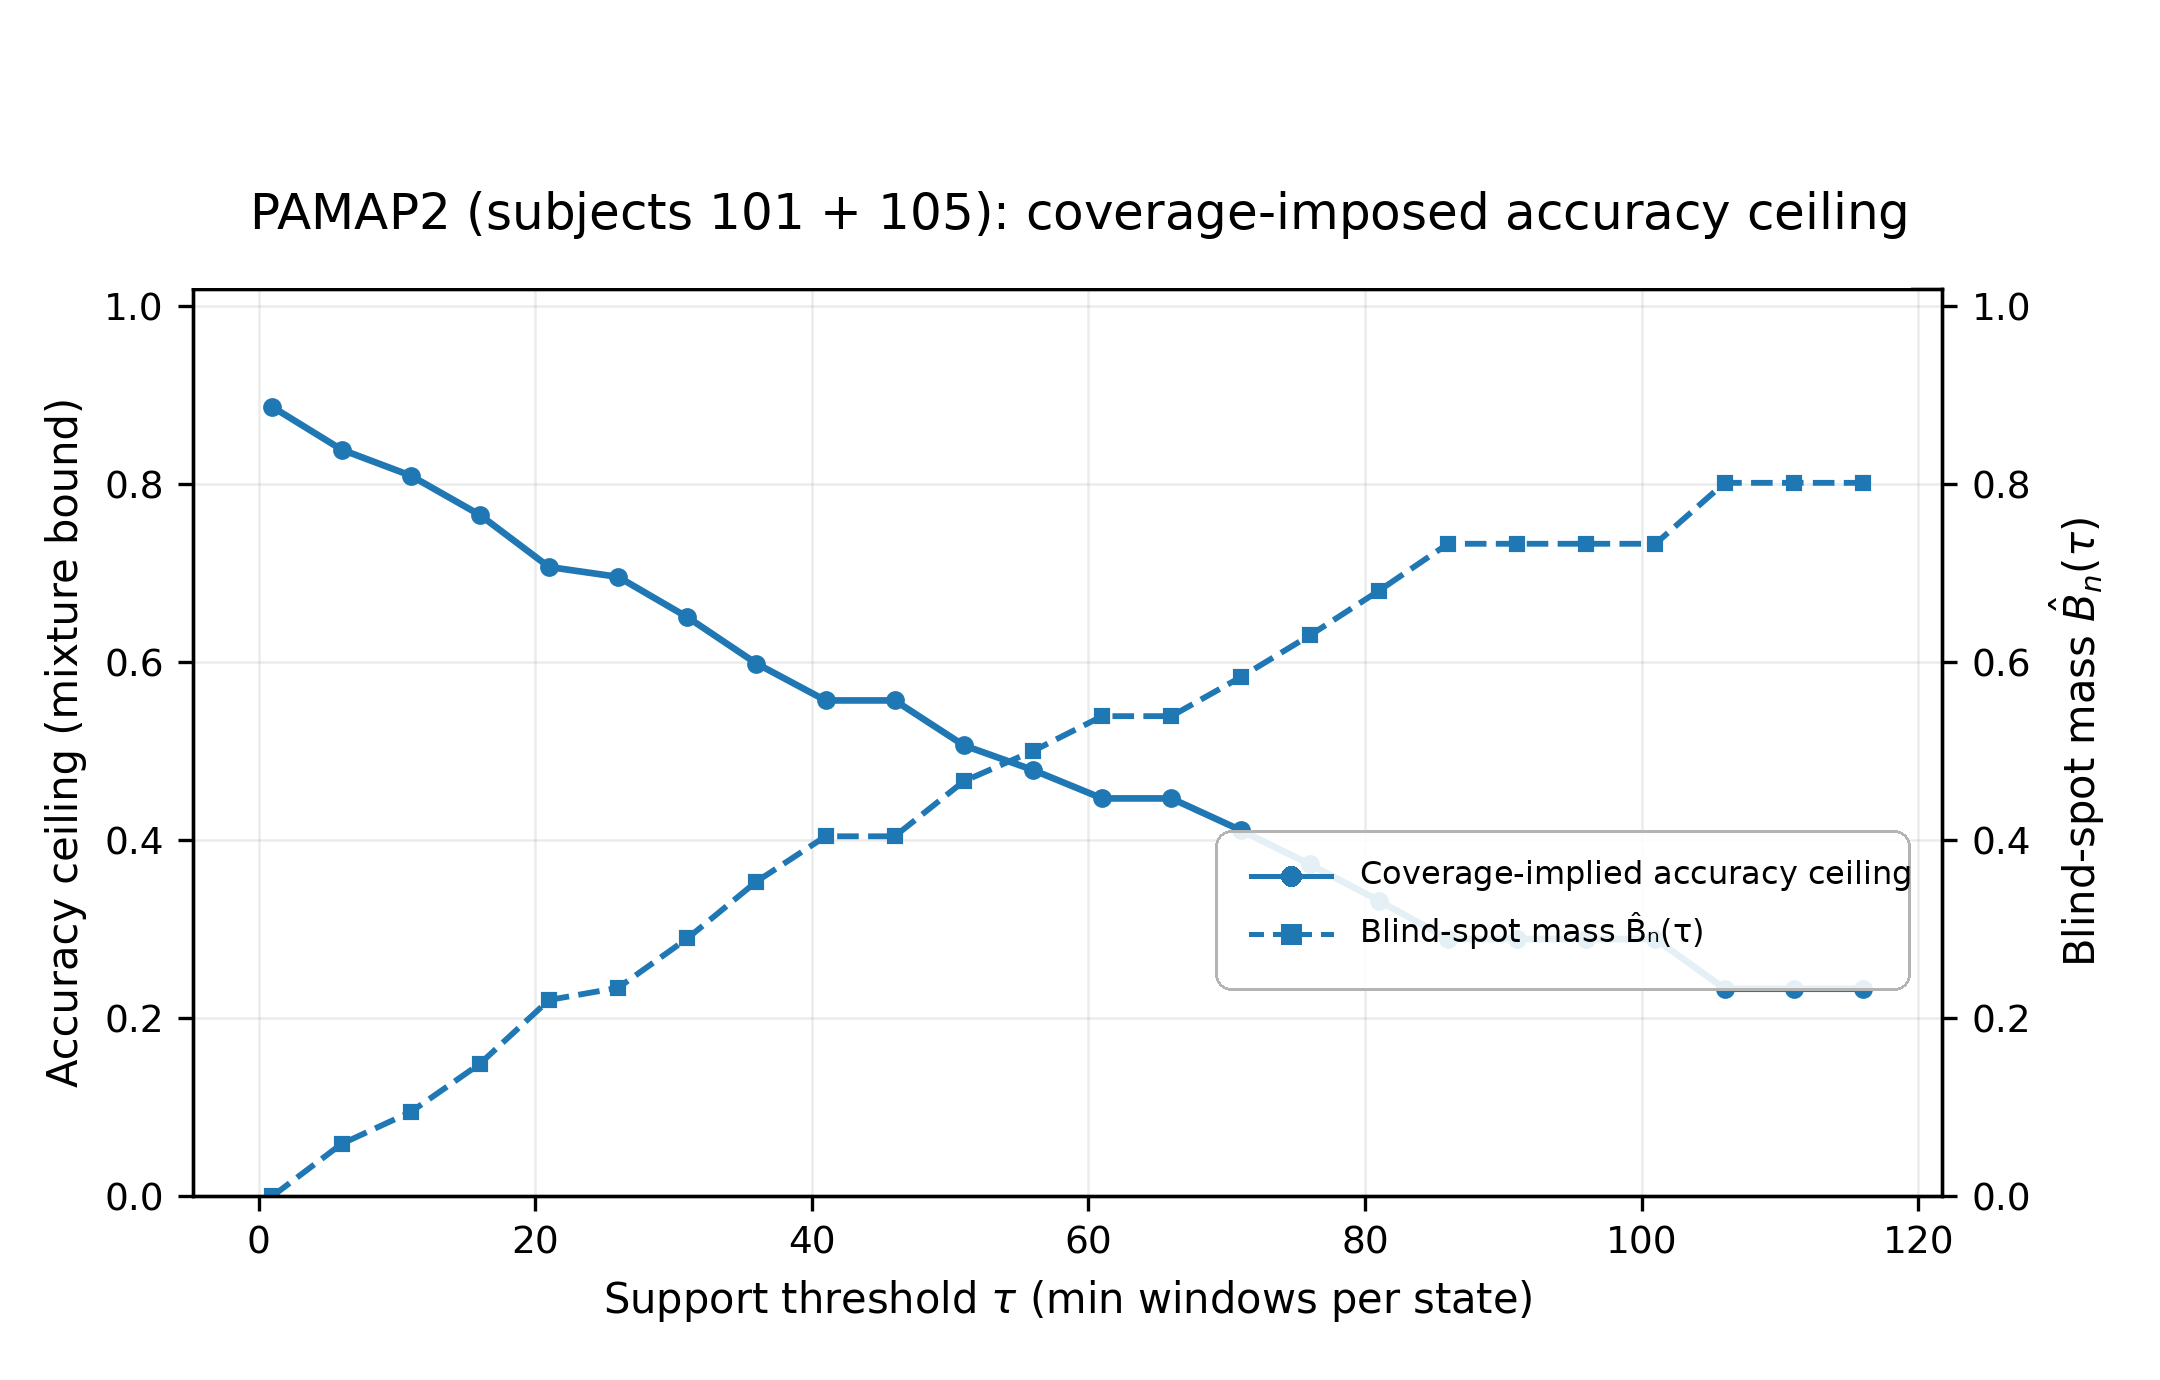
A theoretical consequence of blind-spot mass is the derivation of a coverage-imposed accuracy ceiling. Proposition 1 demonstrates that overall (expected) accuracy is bounded from above by the sum of accuracy in supported states and (unconstrained) accuracy in blind regions weighted by their probability mass. As x3 increases, the coverage-imposed ceiling drops steeply, even if the model is optimally performant in all supported regions.
Figure 6: Coverage-imposed accuracy ceiling falls rapidly with increasing x4 and follows the growth of x5, demonstrating that coverage—not only model capacity—limits achievable deployment accuracy.
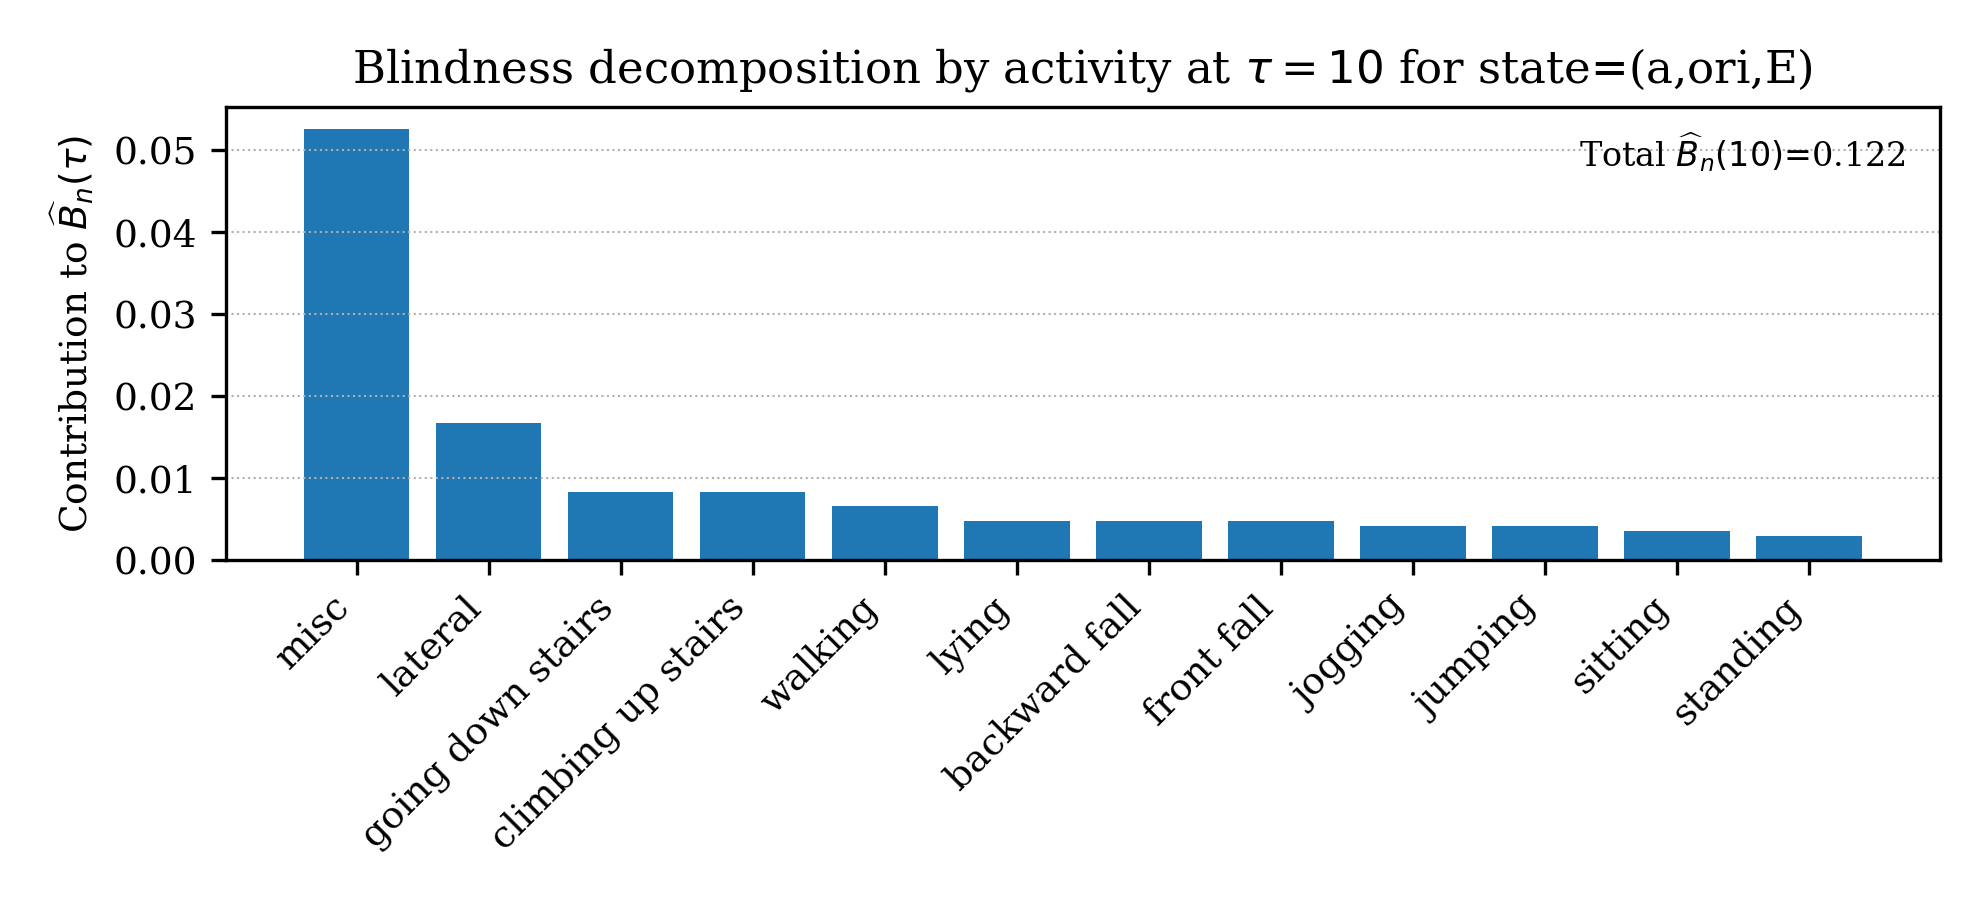
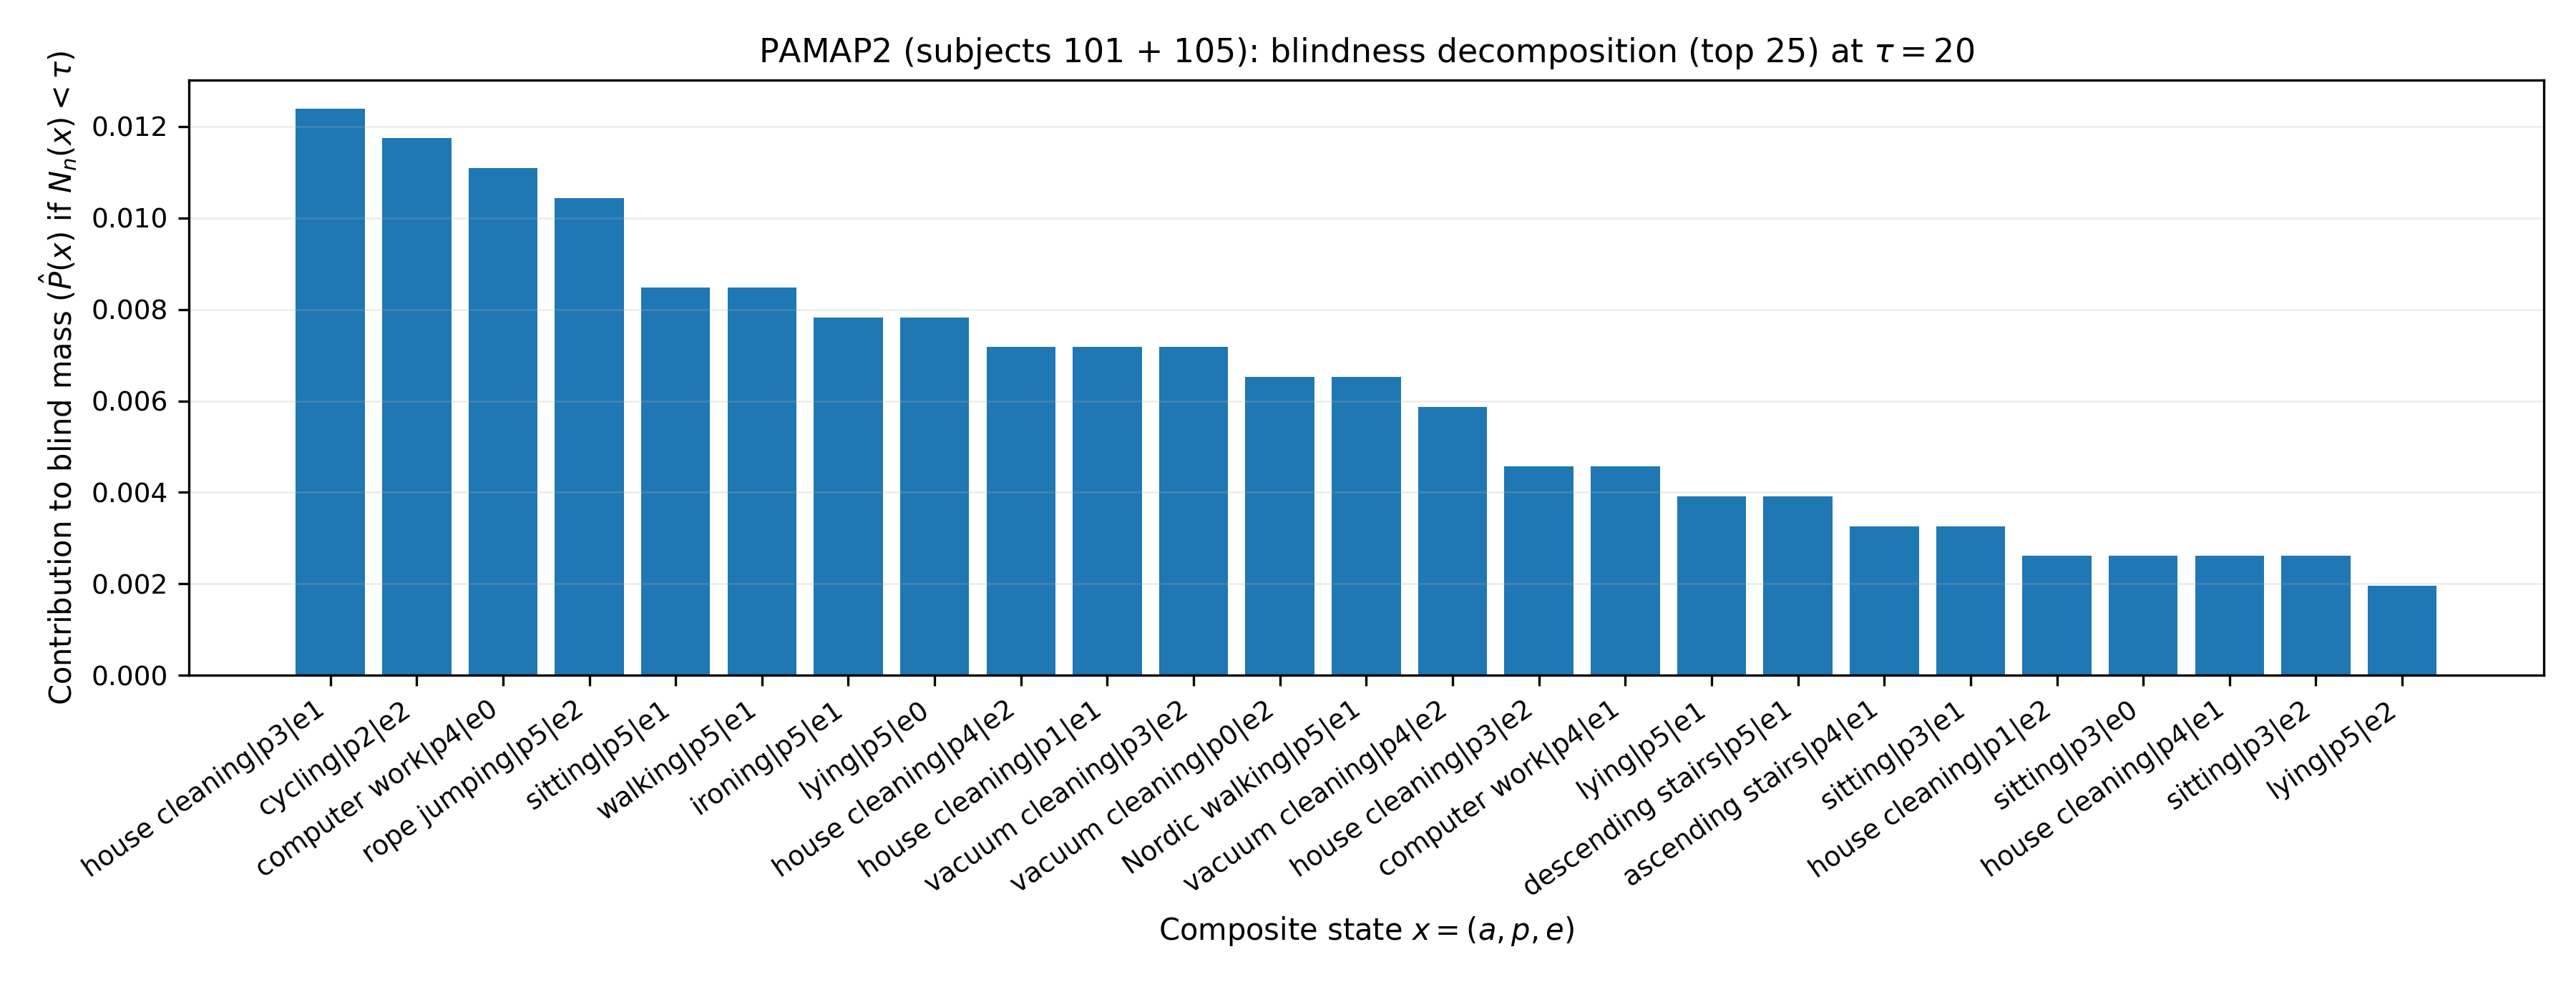
Blind-spot decomposition further enables practitioners to pinpoint which activities or composite operational regimes contribute most to overall blind mass, providing actionable guidance for targeted data collection and renormalization.
Figure 7: Decomposition of blind-spot mass at fixed x6 identifies states and regimes dominating reliability risk.
Practical and Theoretical Implications
The blind-spot mass framework provides a model-agnostic, distribution-level deployment risk metric not addressed by classical OOD detection, shift monitoring, or conformal prediction. It reveals that high test accuracy coexists with large unsampled or undersampled deployment regions, especially as the operational abstraction grows to reflect real-world heterogeneity.
From a practical perspective:
Coverage diagnostics: Before deployment, practitioners can compute x7 to quantify unseen risk and determine if targeted data collection or abstraction coarsening is essential.
Guided state-space reduction: Physics-informed normalization and modeling can reduce x8, shifting probability out of the blind regime, and is more scalable than uncontrolled data augmentation.
Domain generality: The empirical replication on disparate high-dimensional domains indicates that combinatorial coverage blindness is a generic deployment risk for ML, not an artifact of sensors or HAR per se.
Speculation on Future Directions
The formalization of blind-spot mass establishes new directions for both ML research and deployment engineering:
Automated adaptive abstraction selection that trades expressivity for coverage.
Integration into continual deployment monitoring for dynamic, risk-aware coverage guarantees.
Generalization to reinforcement learning and sequential models where support may be coupled across temporally extended trajectories.
Synthesis with active learning for cost-efficient expansion of critical under-supported regions.
Conclusion
Blind-spot mass provides a principled, deployment-facing toolset for quantifying and decomposing coverage risk in ML systems. The framework isolates data coverage limitations from model capacity and supplies actionable diagnostics via refinement and decomposition analyses. The heavy-tailed nature of operational state distributions ensures that, for fixed dataset sizes, structurally sizable fractions of the operational probability mass remain consistently under-supported in practice. This result has broad implications for trust and reliability of ML deployment, particularly in critical or safety-sensitive domains.