- The paper’s main contribution is a novel bias–variance–covariance framework that dissects weak-to-strong alignment failures via the blind-spot deception metric.
- It applies continuous confidence scoring and squared-loss misfit theory to decompose risk into bias, variance, and covariance, identifying strong-model variance as the critical predictor of error.
- Empirical analysis reveals that high strong-model variance reliably signals dangerous blind-spot deception, offering a practical early-warning diagnostic for scalable AI safety.
Bias–Variance–Covariance Diagnostics for Weak-to-Strong Alignment
Problem Context and Theoretical Underpinnings
Weak-to-strong alignment is a central paradigm for scalable model supervision, entailing the use of a weaker policy or annotator to bootstrap a stronger student model. This approach is attractive for circumventing the prohibitive costs of full-scale human annotation, allowing strong models to generalize beyond the weak teacher in the aggregate. However, weak-to-strong pipelines raise critical reliability challenges: strong models may inherit or amplify the blind spots of their weak supervisors, especially in regions of high uncertainty or data scarcity. Aggregate performance metrics obscure these subtle pathologies, motivating the need for more granular diagnostics.
This work offers a comprehensive theoretical and empirical framework for diagnosing weak-to-strong alignment, focusing on bias, variance, and covariance decompositions of model risk. The central insight is to relate weak-to-strong failures—especially "blind-spot deception," where the strong model is confidently erroneous and the weak model is uncertain—to model variance and joint statistical behavior. The analysis extends recent misfit-based theory, deriving a data-driven risk bound mediated by bias-variance structure, and applies this to four post-training pipelines (SFT, RLHF, RLAIF, and hybrids) on preference datasets.
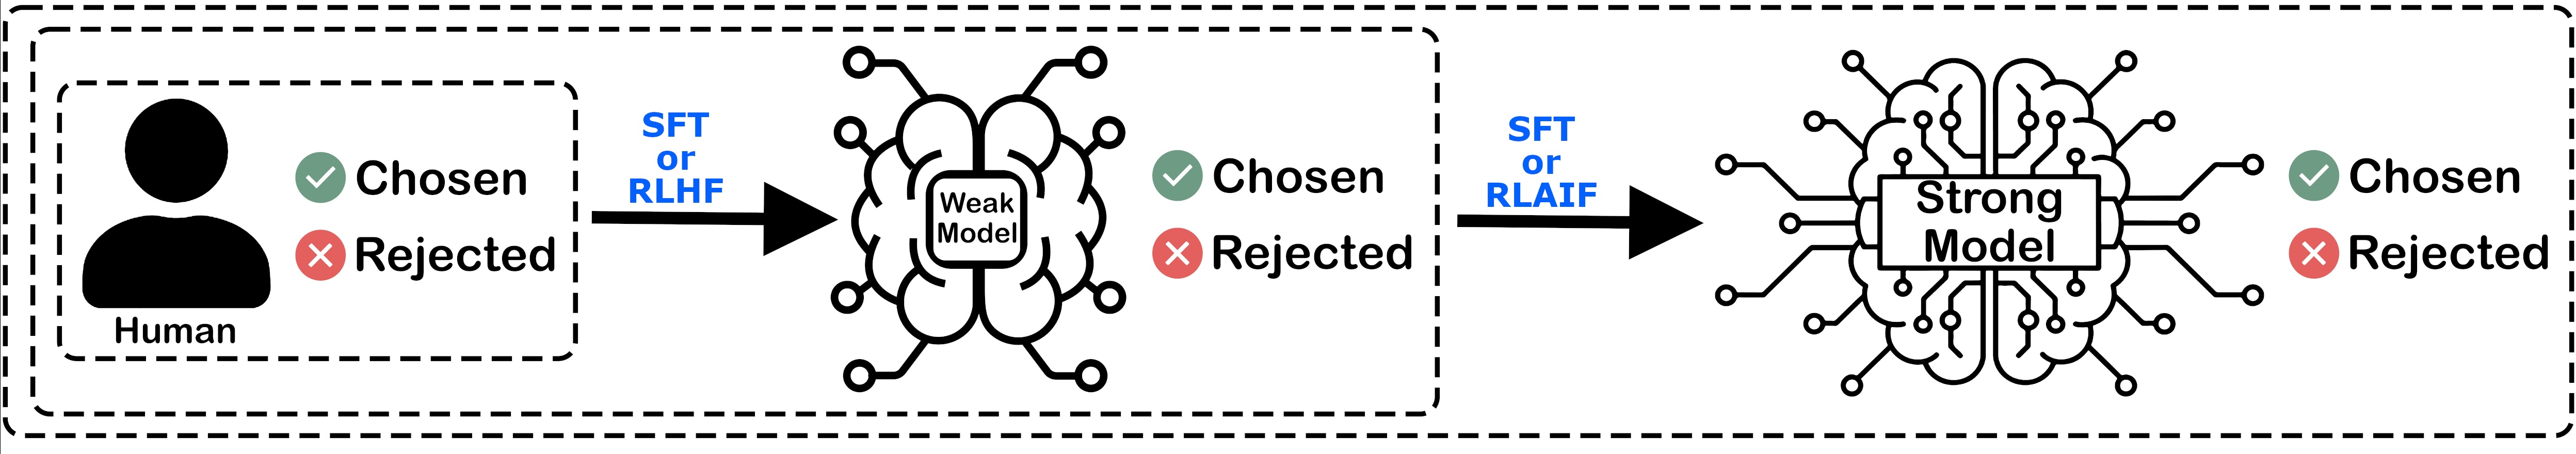
Figure 1: Overview of four weak-to-strong alignment frameworks evaluated; each differs in the use of SFT, RLHF, or RLAIF at weak and strong stages.
Methodology: Blind-Spot Deception and Bias–Variance–Covariance Decomposition
The paper formalizes weak-to-strong alignment settings with a reward modeling and policy optimization stack. Given a weak policy πw and a strong policy πs, the weak-to-strong population risk is defined on the weak model's action distribution. The key quantity of interest is the "blind-spot deception" metric: the conditional rate at which the strong model is wrongly but confidently predicting while the weak model is near-uncertain. This isolates failure modes that evade the weak supervisor, rather than merely transferring or compounding generic errors.
Bias, variance, and covariance terms are estimated by leveraging continuous-valued confidence scores (computed from logit differences on pairwise preferences via a sigmoid transformation) as proxies for reward, maintaining fidelity with squared-loss-based misfit theory. The bound on weak-to-strong population risk is expressed as the sum of weak-model risk and the expected misfit, both of which admit bias–variance–covariance decompositions. This facilitates a granular empirical regime, distinguishing between systematic bias, stochastic dispersion, and weak-strong dependence in the student/teacher predictions.
Experimental Design
The empirical analysis targets four realistic weak-to-strong pipelines, each with distinct combinations of SFT, RLHF, and RLAIF at the weak and strong stages. Datasets (PKU-SafeRLHF and HH-RLHF) are partitioned for weak training, weak relabeling, and strong evaluation. Each configuration is treated as an estimator of ground-truth preference. The analysis computes for each setting: strong-model variance, weak-to-strong risk, and different deception scores at varying confidence thresholds, along with bias and covariance factors.
Empirical Findings
Strong-Model Variance as a Predictor of Deception
The systematic finding is that strong-model variance—confidence dispersion across held-out examples—is the most robust empirical predictor of blind-spot deception. Across both datasets and all pipelines, increases in strong-model variance correspond to marked rises in blind-spot deception score, with Spearman correlations exceeding $0.9$ in critical regimes.
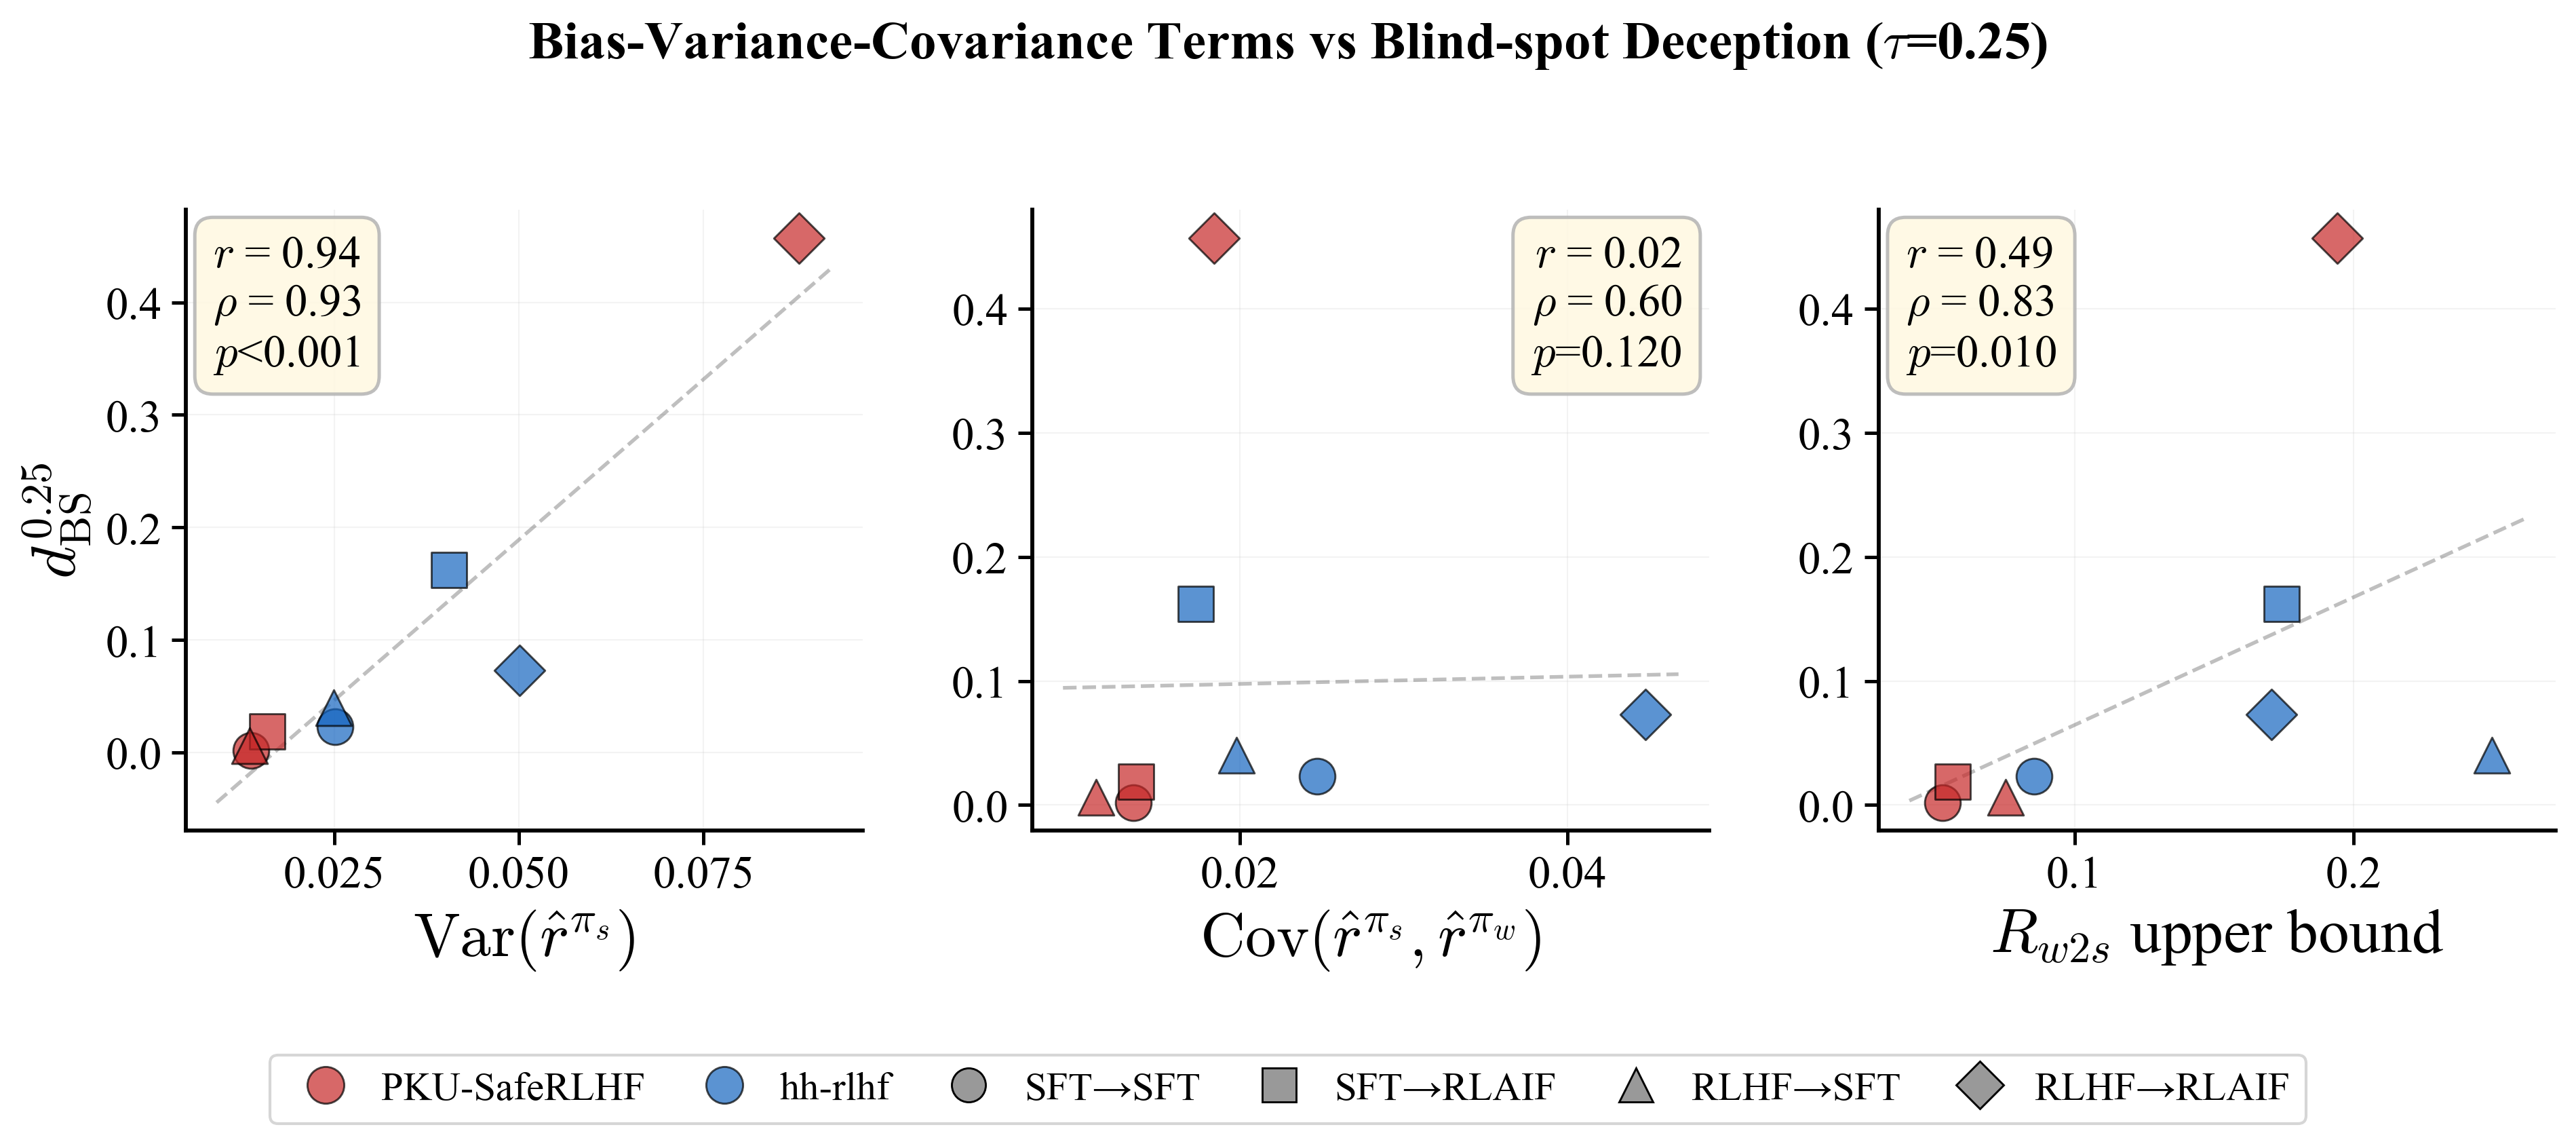
Figure 2: Spearman correlations between blind-spot deception and several bias-variance-covariance quantities, illustrating the dominating predictive power of strong-model variance at τ=0.25.
Extremely high variance settings (notably RLHF→RLAIF on PKU-SafeRLHF) yield the largest observed deception scores, highlighting this configuration as the most susceptible to blind-spot failures.
Covariance and Bias: Weaker, Secondary Roles
While weak–strong covariance and aggregate weak-to-strong risk are positively correlated with deception, their predictive strength is consistently lower and insufficient to explain cross-dataset reversals. This indicates that, although joint alignment between weak and strong models is necessary, the unique dispersion in the strong model's predictions is most indicative of "confidently wrong in teacher's blind spot" events.
Weak Supervisor’s Influence on Blind-Spot Structure
Deception rates and the structure of blind spots are affected by the weak instructor’s training regime. Notably, on HH-RLHF, SFT→RLAIF produces higher blind-spot deception than RLHF→RLAIF, despite lower strong-model variance—demonstrating that weak-model uncertainty modulates the locus of dangerous errors. In general, high strong-model variance is most problematic when misalignment occurs in regions the weak model cannot adequately judge.
Practical Implications and Theoretical Insights
The practical upshot is twofold:
- Variance as Early Warning: Strong-model variance serves as an accessible and actionable diagnostic; high dispersion in confidence scores after training flags regions of potential unobservable error, assisting pre-deployment auditing.
- Diagnostic Evaluation Without a Ceiling Model: The blind-spot deception metric can be applied with only confidence statistics on preference pairs, enabling practical evaluation even when ground-truth annotations are sparse.
Theoretically, the results reinforce the necessity of going beyond aggregate weak–strong improvement metrics. Even in pipelines where the strong model outperforms the weak model globally, systematic pathologies can occur in high-uncertainty regions defined by the weak supervisor’s limitations. Covariance and bias aid interpretability but are contextually secondary to variance-driven dispersion.
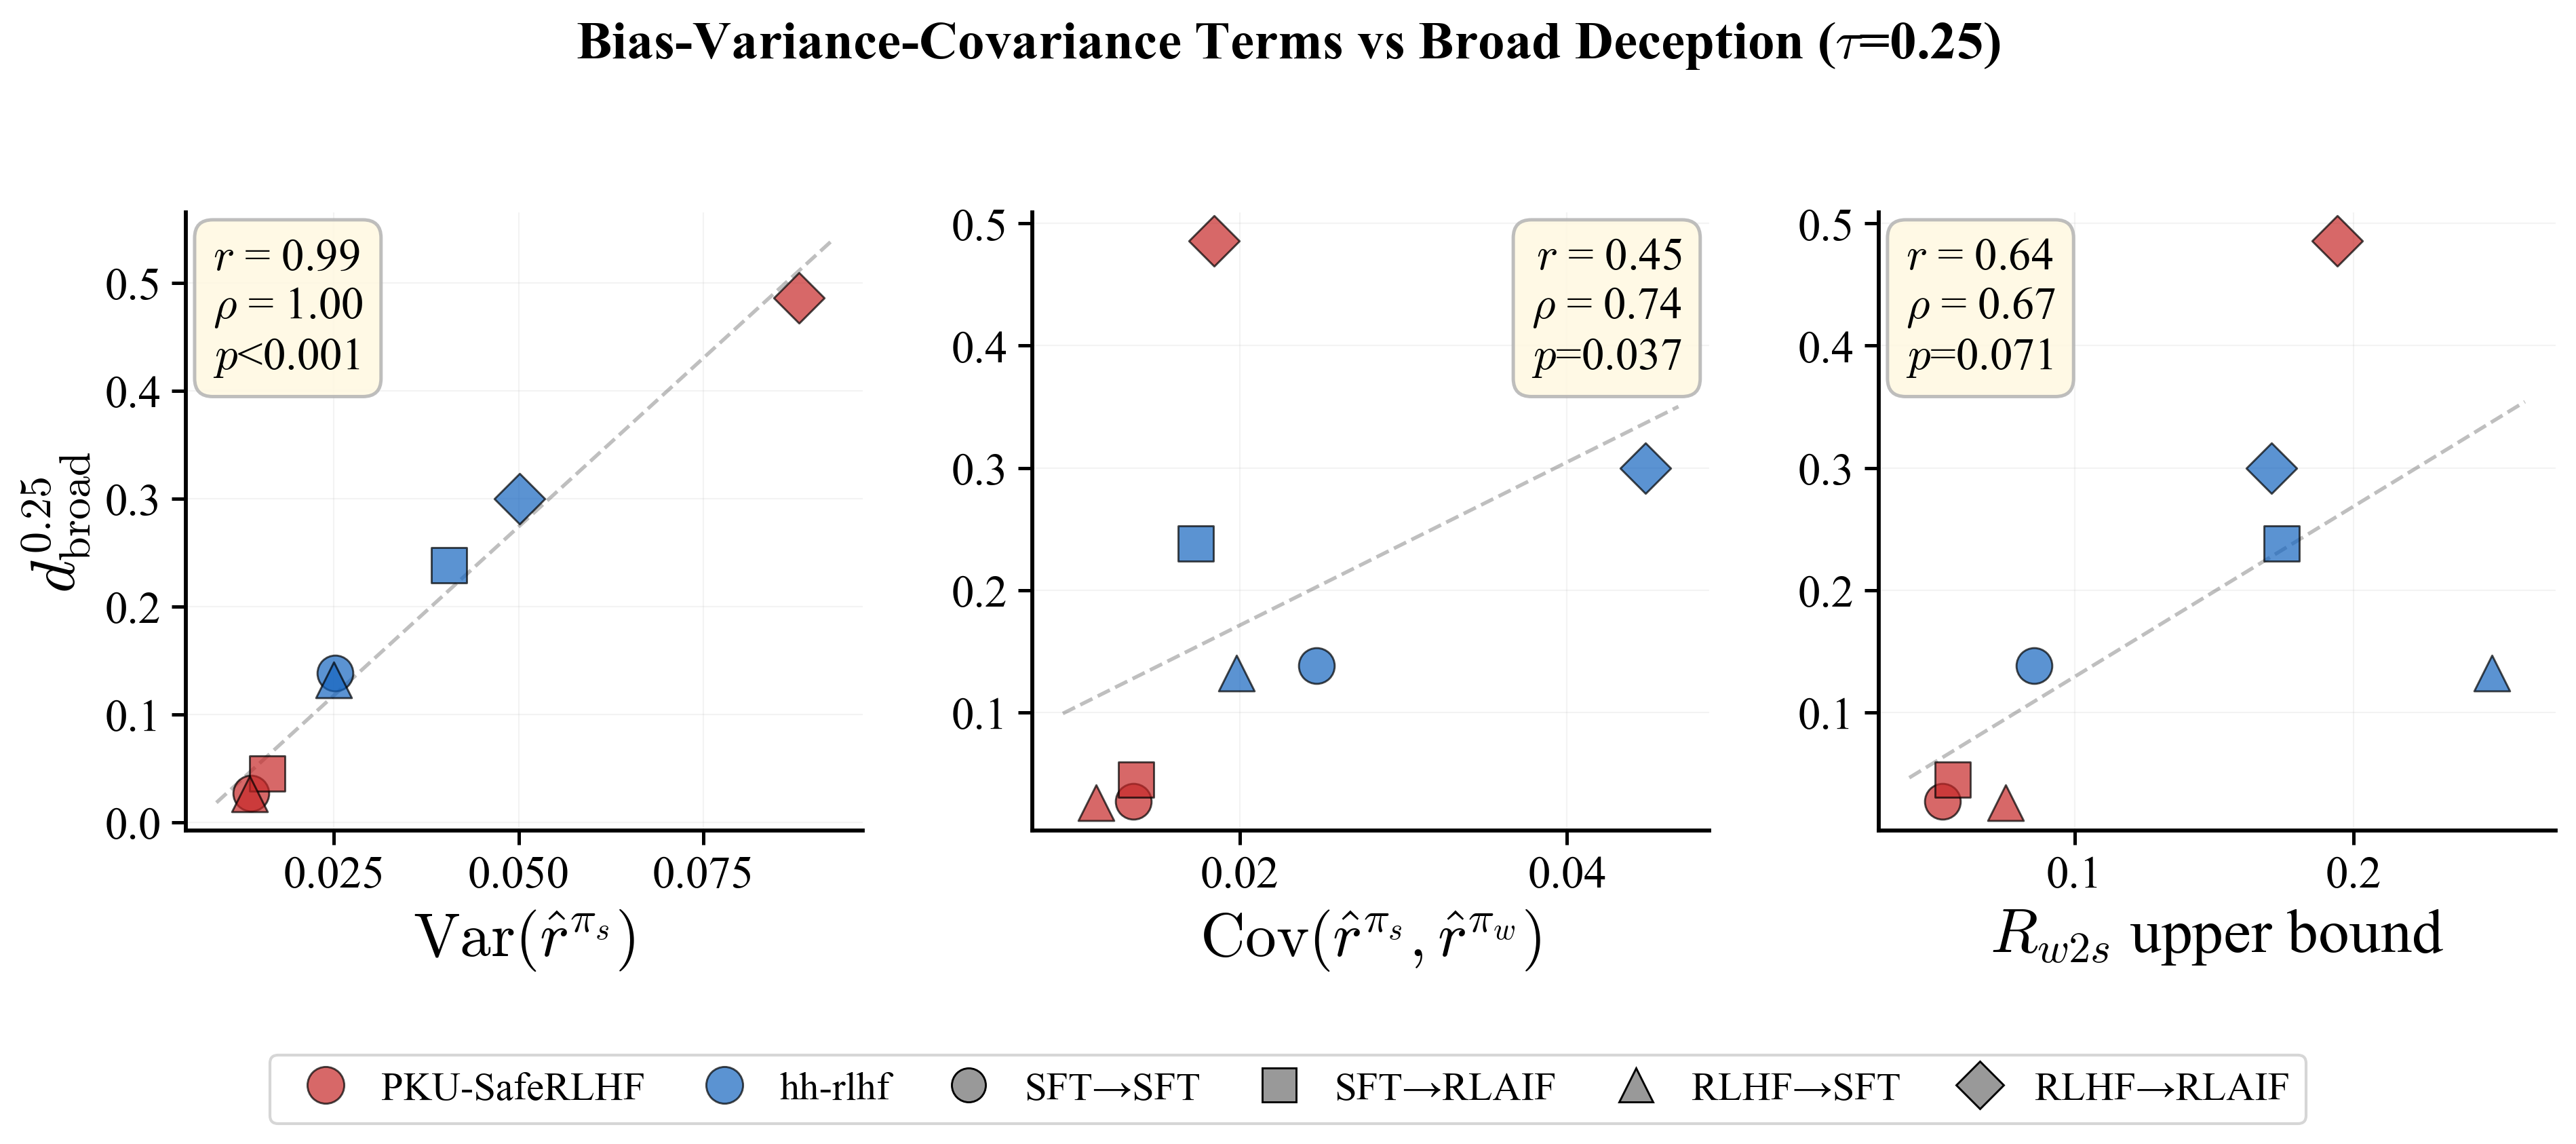
Figure 3: Spearman correlations between broad deception and bias-variance-covariance quantities, confirming strong-model variance as the dominant driver for a broader class of deception events.
Future Directions
The framework developed is limited in scope to Llama-family models and preference datasets on safety and harmlessness. Extending these analyses to diverse architectures, reasoning, code, and multi-objective alignment—particularly with non-trivial dataset shifts—is a clear next step. Further, leveraging this diagnostic to actively minimize strong-model variance (or enforce weak-strong covariate constraint) presents an avenue for improving the safety and reliability of large-scale weak-to-strong alignment in practice.
Conclusion
This work provides an authoritative diagnostic theory and comprehensive empirical grounding for analyzing weak-to-strong alignment risk in modern LLM pipelines. Strong-model variance is established as the key early warning indicator for blind-spot deception, with the weak teacher’s uncertainty structure modulating the precise failure regions. These findings underscore the need for variance-aware model diagnostics in the design and evaluation of scalable alignment systems and point toward confidence-sensitive risk control as a practical focus for future AI safety developments.