- The paper presents robust multivariate and functional archetypal analysis methods using Tukey's bisquare M-estimators, improving outlier resistance.
- It adapts classical and functional frameworks with basis expansions to provide computational efficiency and interpretability for large financial datasets.
- Applied to S&P 500 data, the approach generates interpretable archetypoid clusters that reveal sector-specific risk profiles and diversification insights.
Robust Multivariate and Functional Archetypal Analysis: Methodological Advances and Financial Time Series Applications
Overview and Motivation
The paper "Robust multivariate and functional archetypal analysis with application to financial time series analysis" (1810.00919) introduces robust methodologies for archetypal analysis (AA) and archetypoid analysis (ADA) in both classical multivariate and functional data contexts. Archetypal analysis aims to approximate a dataset via mixtures of extremal profiles (archetypes), which are convex combinations of cases lying on the convex hull boundary, and archetypoid analysis constrains these profiles to real observed cases. The authors address AA's notable sensitivity to outliers—archetypes being anchored to extremal points—by proposing robust variants utilizing M-estimators, particularly the Tukey bisquare loss function. The practical focus centers on robustifying functional analysis for financial time series, offering interpretability and resistance to the contamination effects prevalent in real-world economic data.
Methodological Foundations
Classical and Functional Archetypal Analysis
In AA, each observation xi is expressed as a convex mixture of k archetypes zj, themselves convex combinations of data points. ADA restricts archetypoids to actual cases, yielding a mixed-integer optimization. Archetypes typically inhabit the convex hull boundary; archetypoids may not. The estimation in AA uses alternating minimization, while ADA is solved via a PAM-inspired build-swap algorithm with variable initialization strategies (candns, candα, candβ).
The functional generalization replaces vectors with functions xi(t), using Hilbert space structure and L2 norm-based residuals. Basis expansion (e.g., B-splines, Fourier) is employed for efficient computation, smoothing, and compatibility with irregularly sampled data.
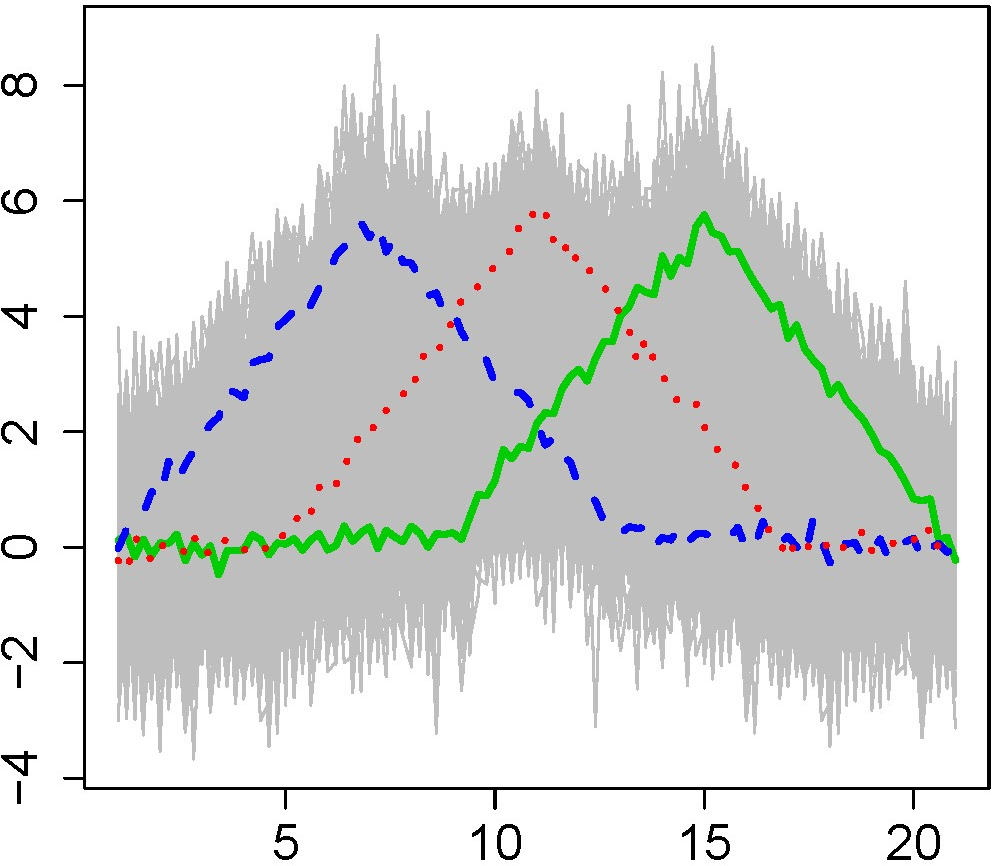
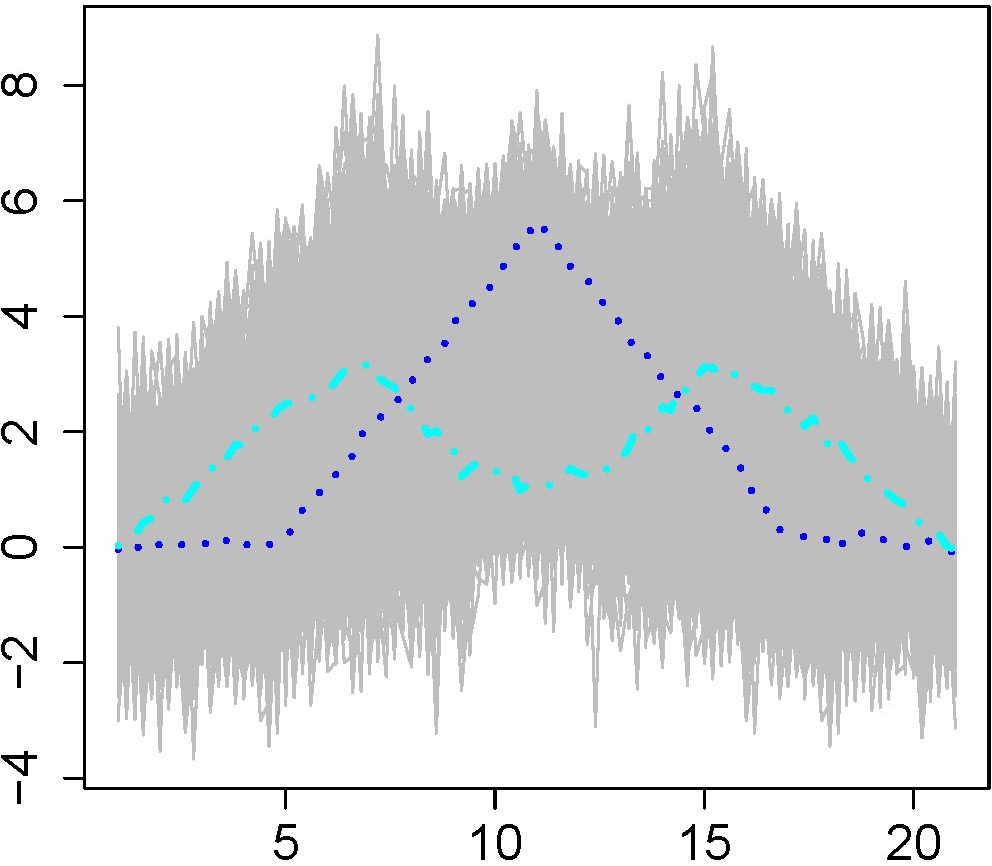
Figure 1: Functional archetypal analysis on waveform data, highlighting archetypes, cluster centers, and principal components.
Robustification Using M-Estimators
To counteract outliers, the authors adapt the loss function to an M-estimator, specifically Tukey's bisquare, parameterized by c (median-based or percentile-based tuning). The objective function replaces the usual RSS with ∑i=1nρc(∥ri∥), where ∥ri∥ denotes residual norm. The procedure maintains algorithmic compatibility—only modifying the norm calculation in AA/ADA routines.
Benchmarking against prior robust AA (Eugster & Leisch, 2011), this approach explicitly meets functional M-estimator conditions (Sinova et al., 2018), demonstrating superior resilience to contamination in simulation studies, both multivariate and functional.
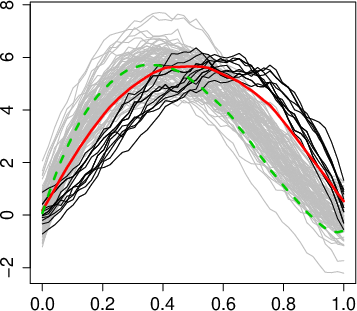
Figure 2: Robust functional archetypoid analysis resists outlier contamination; archetypoids selected via robust ADA avoid outlier inclusion.
The robustness of the proposed methodology is assessed via standard datasets (ozone multivariate, functional outlier models). Strong numerical results are provided:
- Frobenius norm difference from gold-standard archetypes is minimized by the robust method (RAA-ME: 64.5 vs AAC: 206.3 vs RAA-EL: 221.3).
- Robust ADA avoids outlier selection, with inclusion rates dramatically reduced compared to non-robust solutions (e.g., cr=0.15, robust: 32% vs original: 78%).
Sensitivity analysis with alternative c settings validates robustness across tuning choices, although optimality varies with contamination structure. Outlier detection efficacy is assessed algorithmically (robpca, ISFE, RADAB), where the robust ADA-based approach attains maximal Matthews correlation coefficients, balancing high true positive rates with low false positive rates.
Application to Financial Time Series: S&P 500 Analysis
The robust functional archetypoid analysis is applied to a curated S&P 500 dataset (daily OHLCV from 2000-2013), characterizing each company by functional returns and volatility (time-varying β), represented in a B-spline basis with standardization. Robust bivariate FADA extracted archetypoid companies, with sectorial representation growing with k. Key archetypoids for k=4 (ALTR, LNC, NUE, GIS) encapsulate extremal archetypal behaviors in returns and volatility.
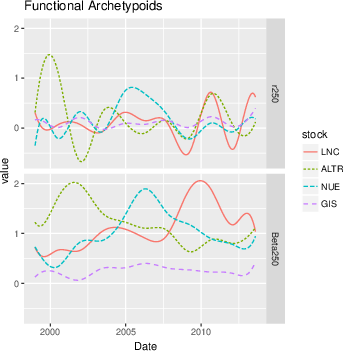
Figure 3: Functional return (r250) and volatility (β250) curves for four archetypoids reveal sector-specific extremal characteristics.
Clusters are constructed based on the αij mixtures, grouping companies according to archetypoid influence. The methodology generates interpretable structures: pure clusters dominated by a single archetypoid, mixed clusters reflecting multiple archetypoid contributions.
Sectoral analysis shows that dominant archetypoids explain substantial fractions of sectoral compositions (e.g., GIS: nearly 80% of Consumer Staples, LNC: >45% of Financials), with similarity patterns and interdependencies elucidated through archetypoid mixture weights.
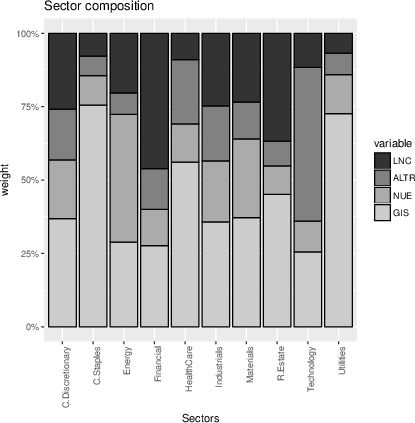
Figure 4: Normalized archetypoid weights by sector, indicating sector-specific dominance and inter-sector relationships.
Practical and Theoretical Implications
The robust functional archetypal methodology affords several advantages:
- Outlier resilience in both multivariate and functional data, critical for economic and financial applications susceptible to contamination.
- Interpretability of extremal behaviors, supporting explainable unsupervised analysis and accessible summary even for non-experts.
- Sector and cluster taxonomy derived directly from data-driven archetypoid mixtures, offering insights into diversification, risk profiles, and investment decision-making.
- Computational efficiency via functional basis representation, essential for large-scale, long-horizon time series.
Theoretically, the adoption of functional M-estimators with rigorous norm conditioning solidifies robustness claims and enables extension to generalized (multivariate) functional spaces. Alternatives (e.g., Huber loss) are discussed, but bisquare proves optimal for extreme outliers.
Future Directions
Several open problems and promising lines are highlighted:
- Automated, theoretically justified tuning parameter selection for robust loss functions in both real and functional settings.
- Expansion of robust AA/ADA to mixed data types (functional and vector), necessitating novel norm and inner product definitions.
- Application to high-frequency, multivariate, and multi-frequency financial data.
- Potential leverage of archetypoid-based clusters in constructing small, diversified portfolios with controlled risk.
- Generalization to broader econometric, biomedical, and engineering time series domains.
Conclusion
The robustification of archetypal analysis in both classical and functional contexts addresses long-standing vulnerabilities to outlier contamination, enhancing interpretability and applicability, notably in financial time series analysis. Empirical results substantiate robustness claims, and the methodology opens new vistas for unsupervised dynamic profiling and interpretable clustering. The implications are substantial for both theoretical statistical learning and practical analytics in economics, finance, and beyond.