- The paper proposes the Whitened Unbiased RDM Cosine Similarity (WUC) method to improve model selection by correcting for measurement noise bias.
- It incorporates a whitening process to address covariance in pairwise dissimilarity estimates, enhancing reliability in neural representation comparisons.
- Experimental simulations demonstrate that WUC outperforms traditional RDM correlations and cosine similarity under various noise and bias conditions.
Comparing Representational Geometries Using Whitened Unbiased-Distance-Matrix Similarity
Introduction to Representational Similarity Analysis (RSA)
The paper "Comparing representational geometries using whitened unbiased-distance-matrix similarity" (2007.02789) addresses the evaluation of models for brain computations through Representational Similarity Analysis (RSA). RSA is a methodological framework employed to test models of brain computations by comparing neural activity patterns against experimental conditions. This process involves quantifying representational geometries through estimated representational dissimilarity matrices (RDMs), which capture the nuances of how different neural activity patterns relate under varying conditions.
RSA unfolds in three phases: initially, it involves the construction of RDMs from estimated activity patterns; next, it juxtaposes these data-driven RDM vectors against model predictions; and finally, employs statistical methods to inferentially compare models based on their correspondences. The selection of an appropriate dissimilarity measure is critical, with options such as Pearson correlations, cosine similarities, and rank correlations being used depending on whether the models predict quantitative or ordinal relationships.
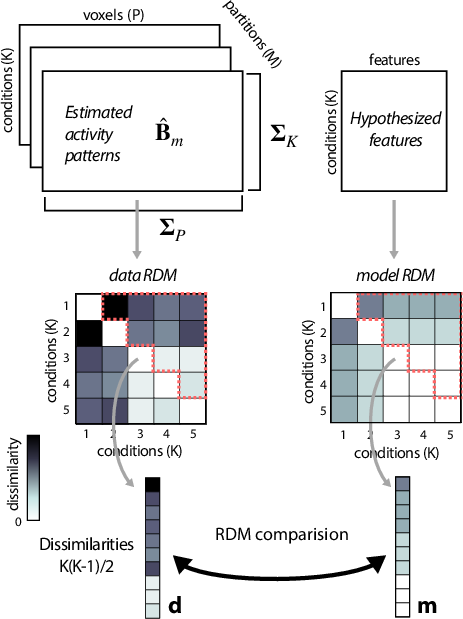
Figure 1: Analysis pipeline for RSA. The data consists of M independent estimates of the activity patterns B. A model is defined with a set of features that relate to the chosen experimental conditions and that are hypothesized to be encoded in the activity patterns. To compare data and model, the patterns are transformed into a Representational Dissimilarity Matrix (RDM). All unique pairwise dissimilarities are then stretched to a vector (d) and compared to the vector of model dissimilarities (m).
Challenges in Model Selection: Bias and Covariance
The paper highlights two significant challenges in RSA: measurement noise-induced bias in distance measures and statistical dependence in pairwise dissimilarity estimates. Standard estimators like Euclidean and Mahalanobis distances are susceptible to bias from noise, which can distort inference. Crossvalidating estimators can mitigate this bias but lead to increased variance.
Additionally, ignoring covariance among pairwise estimates can yield suboptimal model selection. The authors provide analytical expressions for the bias-variance trade-off, furnishing methods to whiten RDM estimation errors. This culminates in adopting Whitened Unbiased RDM Cosine Similarity (WUC), which improves model selection accuracy and is robust against correlated measurement noise.
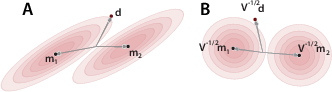
Figure 2: Influence of the covariance of the dissimilarity estimates on model selection. The data RDM d and two model RDMs m1 and m2 are visualized as vectors in the space spanned by the dissimilarities (one dimension for each pair of conditions). The red contours indicate the distribution of RDM estimators for different samples generated by the model. The orientation of the ellipse indicates the covariance between distance estimates. (a) The data RDM is closer to m2 in terms of the cosine similarity (angle between vectors). However, the data RDM is more likely under m1. (b) After the covariance of the distance estimates (V) is taken into account, the data is closer to m1, also in terms of the angle.
Experimental Validation and Model Comparison Techniques
Diedrichsen et al. employ simulations to scrutinize various inference methods including RDM correlations, RDM cosine similarity, and WUC under diverse experimental conditions. The results demonstrate that both RDM correlation and cosine similarity underperform when compared to PCM, a model-comparison technique utilizing the likelihood-ratio test. However, by accounting for covariance through WUC, inference approaches the theoretical optimum established by PCM, highlighting the robustness of the whitening approach.
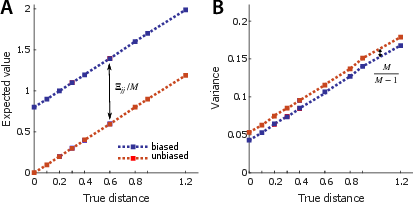
Figure 3: Bias-variance trade-off of biased and unbiased distance estimates. (A) The mean of biased (blue) and unbiased (red) estimates of the squared Euclidean distance, plotted against the true value of the distances. (B) Variance of the distance estimates increases linearly with the true distance. The unbiased distance shows an increased variance by a factor depending on the number of partitions (M).
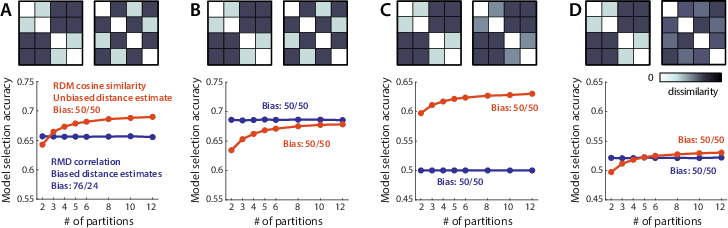
Figure 4: Model selection accuracy for RDM correlation and RDM cosine similarity. Each of the four columns illustrates a different simulated scenario. The upper row shows the two model RDMs being compared. The lower row shows the model-selection accuracy, as a function of the number of independent crossvalidation partitions, using RDM correlation with biased distance estimators (blue) or using RDM cosine similarity using unbiased distance estimators (red). Bias: percentage of pure noise simulations for which Model1/Model2 is chosen using each criterion. (A) Two models with a different categorical structure for 4 conditions are compared. If the measurement noise is correlated across neighbouring conditions, model decisions using RDM correlations are biased, and perform worse than RDM cosine similarities. (B) The same simulation as in A, but with independent measurement noise. No bias in model decisions occurs, and RDM correlations perform better, with the advantage becoming smaller as the number of partitions increases. (C) When the model RDMs only differ in the ratio of the two levels of dissimilarity, RDM correlations perform at chance, because they remove the zero point which is necessary to distinguish the two models. (D) When the zero-point is not essential, but helps for model comparisons, using the RDM cosine similarities can be more accurate than RDM correlations even if measurement noise is i.i.d.
This paper's methodologies are captured in a Python toolbox released by the authors. The toolkit streamlines RSA processes, incorporating WUC for optimal model assessment in representational similarity tasks. The authors advocate employing WUC consistently for RSA model comparisons due to its robustness against noise assumptions and avoidance of bias stemming from covariance structures.
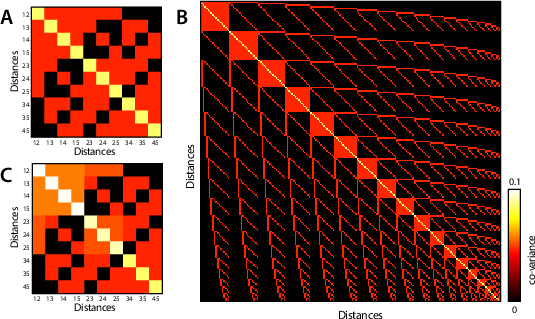
Figure 5: Covariance between elements of the RDM across independent data sets. (A) Covariance matrix for the 10 distance estimates between 5 conditions, assuming that all true distances are 0 and activity patterns are measured independently and with the same variance. (B) Covariance matrix of the 153 distances between 18 conditions, where all the true distances are 0. (C) Covariance matrix for the 10 distance estimates between 5 conditions, assuming true distances as depicted in the model of Figure 1.
Conclusion
The study introduces an innovative approach to RSA model comparison, offering theoretical insights and practical guidelines for employing WUC in analyzing neural representational geometries. WUC emerges as a method of choice in various applications by countering bias and leveraging statistical whitening to aid model selection in complex data scenarios.
This research exemplifies an integration of theoretical rigor with empirical evaluation, promising advancements in computational neuroscience methodologies. In future work, extending WUC to other domains may yield further insights, fostering development in model comparison techniques across diverse scientific disciplines.