- The paper introduces VisCoder, a fine-tuned LLM that leverages the VisCode-200K dataset and multi-turn debugging to enhance Python visualization code generation.
- The methodology employs runtime-validated code and an iterative self-debug protocol to significantly boost execution pass rates, particularly for Matplotlib and Seaborn.
- The approach demonstrates the impact of grounded instruction tuning combined with developer-style feedback, setting a new benchmark for open-source visualization models.
Fine-Tuning LLMs for Executable Python Visualization Code Generation: VisCoder and VisCode-200K
Motivation and Challenges
LLM-driven code generation for data visualization remains a nontrivial challenge due to the multimodal semantics inherent in plotting tasks. Generating code that runs without exceptions is necessary but insufficient: the output plot must adhere closely to both data structure and the instructional semantics provided by the user. Existing instruction-tuning corpora inadequately address the gap between code execution and meaningful visual output, and seldom, if ever, deliver multi-turn correction supervision for iterative code improvement. This deficit results in brittle generations, frequent silent failures, and low reliability for practical visualization scenarios.
Dataset Construction: VisCode-200K
The VisCode-200K dataset directly targets the deficiencies of prior resources. It is constructed from two sources:
- Executable visualization code blocks: Mining open-source repositories, the authors extract 155K+ verified plotting scripts in Python spanning realistic usages of matplotlib, seaborn, plotly, and other libraries. All blocks are runtime-validated and accompanied by their ground-truth rendered plots.
- Multi-turn code correction dialogues (45K): Drawn from Code-Feedback, these traces exemplify iterative debugging and code repair based on runtime feedback, simulating developer workflows where models are prompted to correct failed outputs.
Instructions for code generation are automatically constructed with LLM assistance, encompassing data description, structural and stylistic plot specifications, data previews, and language/library setup details, ensuring tightly aligned semantic grounding between code, data, and visual output.
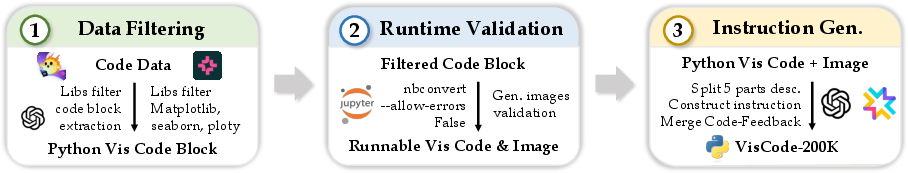
Figure 1: Data construction pipeline for VisCode-200K, illustrating extraction, filtering, runtime validation, and multi-turn feedback integration.
Methodology: Model Tuning and Self-Debug Protocol
VisCode-200K is used to fine-tune Qwen2.5-Coder-Instruct at 3B and 7B parameter scales, producing VisCoder. Training involves full-parameter instruction tuning, with explicit inclusion of multi-turn interactions to endow models with debugging and recovery capabilities. Evaluation is conducted on PandasPlotBench—a benchmark comprising 175 natural-language visualization tasks covering matplotlib, seaborn, and plotly.
In addition to traditional single-shot assessment, the authors introduce a self-debug evaluation protocol: If a model’s code fails to produce a valid plot, it is prompted to repair its output using execution feedback, iteratively, for up to three rounds. This protocol systematically tests the model’s ability to perform developer-style remediation and increases task realism.
Results
VisCoder significantly surpasses prior open-source models across all metrics:
- Average execution pass rate increases: At 3B scale, VisCoder achieves +19.6 points over Qwen2.5-Coder; at 7B, +14.5 points.
- Self-debugging efficacy: VisCoder-7B reaches >90% execution pass rate in Matplotlib and Seaborn after iterative correction, and up to 81.7% in Plotly, approaching GPT-4o’s proprietary performance.
- Plotly remains the hardest: Open-source models lag behind proprietary ones more sharply on Plotly, reflecting its verbose and idiosyncratic API design.
- Error types: VisCoder models reduce structural errors (e.g., AttributeError, TypeError) more aggressively via self-debug rounds. Semantic errors such as ValueError, often reflecting deeper misunderstandings of data semantics, prove harder to repair.

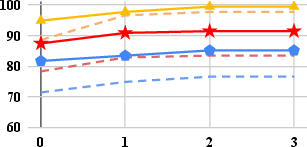
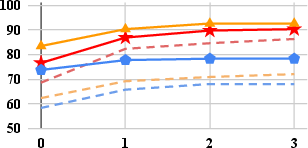
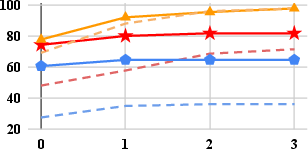
Figure 2: Example of successful generation in Matplotlib; code executes and plot matches instruction semantics.
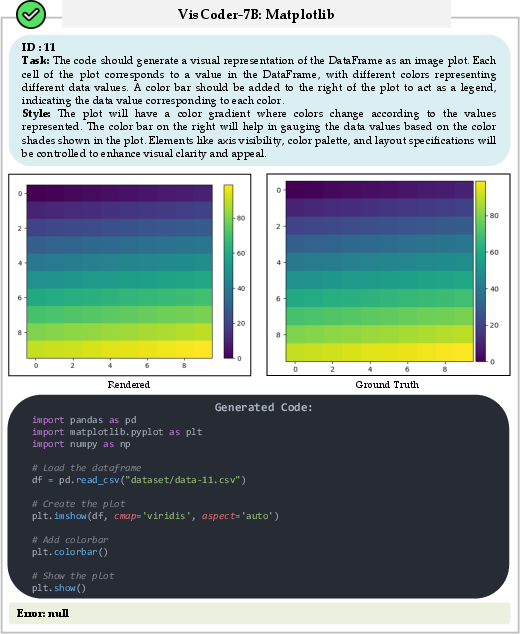
Figure 3: Failed Matplotlib generation raising an AttributeError, corrected via self-debug to yield a valid plot.
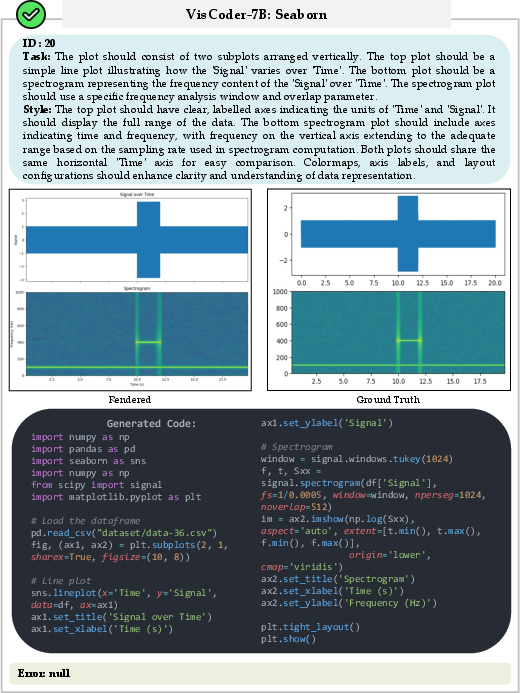
Figure 4: Seaborn successful generation, with code and output plot reflecting ground-truth intent and styling.
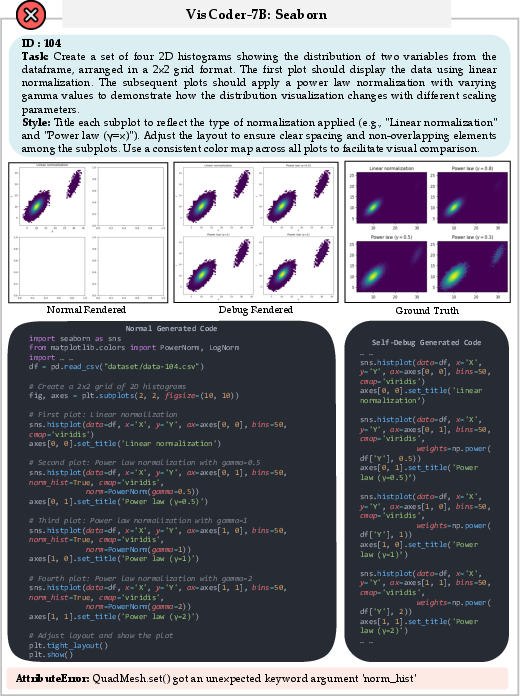
Figure 5: Seaborn code with initial AttributeError, multiple self-debug rounds culminate in semantic recovery.
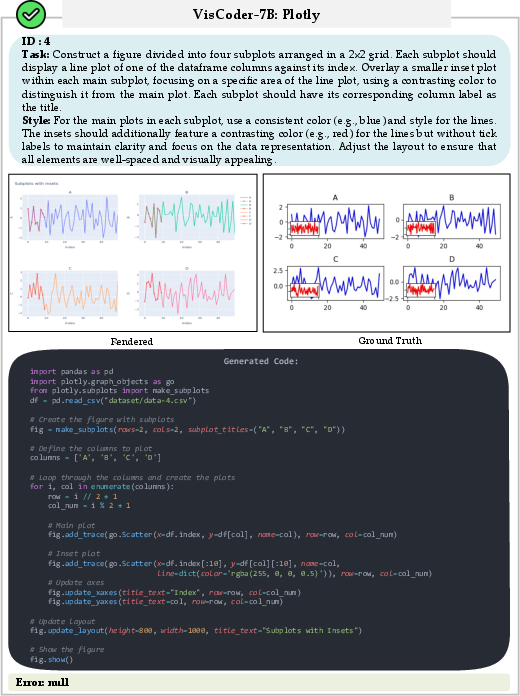
Figure 6: Successful Plotly code run, output plot consistent with user specification.
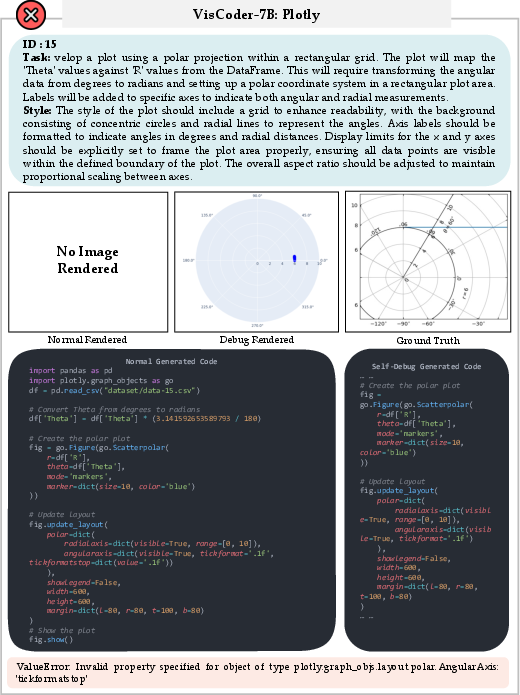
Figure 7: Plotly generation with initial ValueError, rectified in the second self-debug iteration.
Self-debug benefits all models, but VisCoder yields both superior initial generations and more stable corrective behavior across rounds.
Data Ablation and Backbone Generalization
Ablation reveals complementary contributions from all data sources in VisCode-200K:
- Stack-Edu code: Offers moderate coverage but lacks the specificity for robust semantic alignment.
- CoSyn-400K: Synthetic data fails to generalize; execution pass rates remain near zero.
- Code-Feedback: Improves reliability for simple corrections but lacks visualization-specific depth.
- Full dataset: Combining executable code and multi-turn feedback yields robust generalization and substantial gains.
- Backbone flexibility: VisCode-200K delivers consistent performance uplift when tuning alternative code-generation models, including DeepSeek-Coder, CodeLLaMA, and StarCoder.
Implications and Future Directions
VisCoder demonstrates that properly grounded instruction tuning, coupled with supervision for debugging workflows, substantially enhances the reliability of LLM-based visualization code generation. The approach enables models to not only produce more executable code but also to iteratively refine errors in a manner analogous to human developers, broadening their utility for practical analytic tasks.
Coverage still favors Python, and challenges remain for libraries like Plotly, whose semantics are less consistently represented and more prone to subtle errors not remediable by symbolic feedback alone. Extensions of this paradigm could encompass additional languages (e.g., R, JavaScript), further diversification of visualization libraries, and richer multimodal semantic alignments—including direct use of chart images for specification and correction. More sophisticated runtime feedback, possibly integrating direct visual analysis or reinforcement learning via execution traces, could further close the reliability gap with proprietary closed models.
Conclusion
The VisCoder system, trained on VisCode-200K, sets a new standard for open-source LLMs in executable Python visualization code generation (2506.03930). By leveraging structurally diverse, runtime-validated code samples and multi-turn correction dialogues, it demonstrates pronounced improvements in both functional code correctness and semantic plot fidelity, closing much of the gap to proprietary models. Iterative self-debugging protocols emerge as key to further performance gains, especially for error-prone, high-complexity visualization tasks. These advances constitute a robust foundation for future visualization-capable LLMs and feedback-driven code generation research.