- The paper presents a novel framework, InReAcTable, integrating interaction, acting, and reasoning to construct coherent visual data stories.
- It employs subspace graphs and retrieval-augmented generation to filter insights and convert them into natural language, enhancing interpretability.
- Experimental evaluations demonstrate improved logicality, coherence, diversity, and relevance of data stories compared to baseline systems.
InReAcTable: LLM-Powered Interactive Visual Data Story Construction from Tabular Data
The paper presents InReAcTable, a framework for constructing interactive visual data stories using LLMs to manage tabular data. This framework aids users in aligning their analytical intentions with coherent visual narratives by leveraging structural and semantic analysis of data insights.
Framework Overview
InReAcTable integrates three primary modules: Interaction, Acting, and Reasoning. The Interaction module initiates the process by extracting and visualizing insights from a user-selected data subspace. These insights are categorized into point, shape, and compound insights, making them intuitively interpretable.
The Acting module employs a subspace graph for structural filtering. This method limits the search space by exploring related subspaces with sibling or parent-child relationships, allowing for efficient navigation through discrete insights (Figure 1).
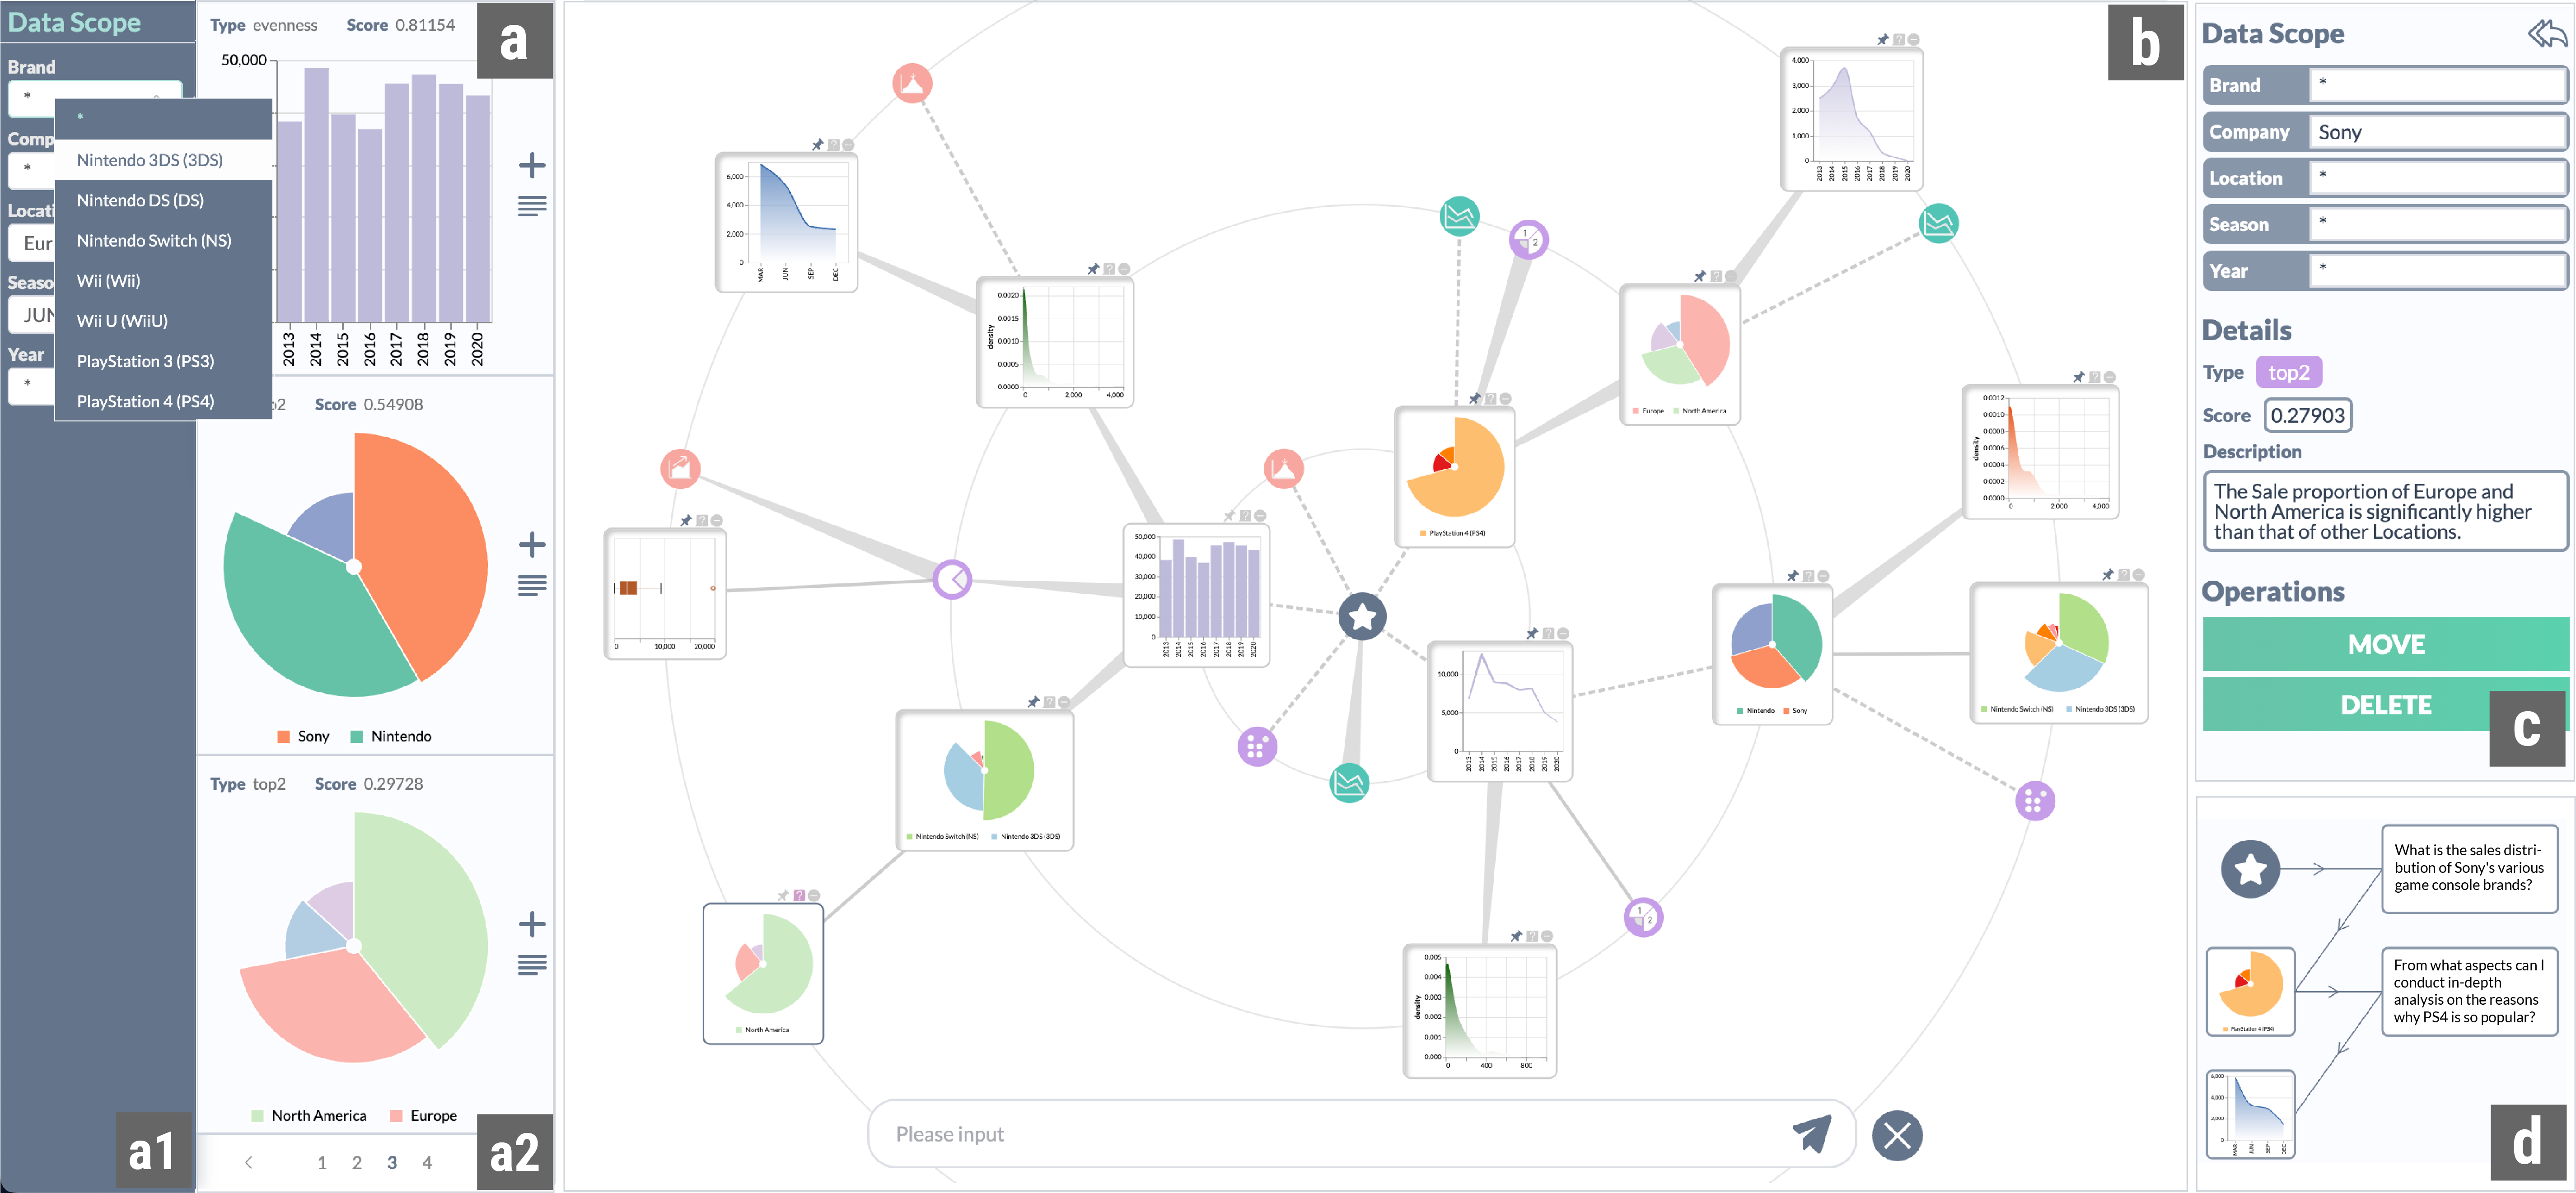
Figure 1: The user interface of the InReAcTable prototype system. In (a) data subspace selection panel, users can determine a specific data subspace by filtering attribute values in (a1), and all insights in this subspace will be displayed in the (a2) candidate insights panel. The (b) iterative exploration panel uses a circular force-directed layout diagram to map nodes and edges in the exploration path tree. Users interactively explore data through this interface. The insight information panel consists of the (c) insight detail view, presenting detailed information about the focused data insights and supporting users in modifying the exploration path, as well as the (d) exploration history view, enabling users to retrace their steps.
The Reasoning module uses retrieval-augmented generation (RAG) to prioritize insights that align with user queries and current focus. It converts insights to natural language descriptions, facilitating semantic reasoning through LLMs.
Implementation Details
Insight Extraction and Visualization
The system extracts high-scoring insights from the tabular data and visualizes them using appropriate mapping rules. Insights are visualized in a radial tree layout for efficient space utilization and clarity, allowing users to understand the exploration progression visually (Figure 2).
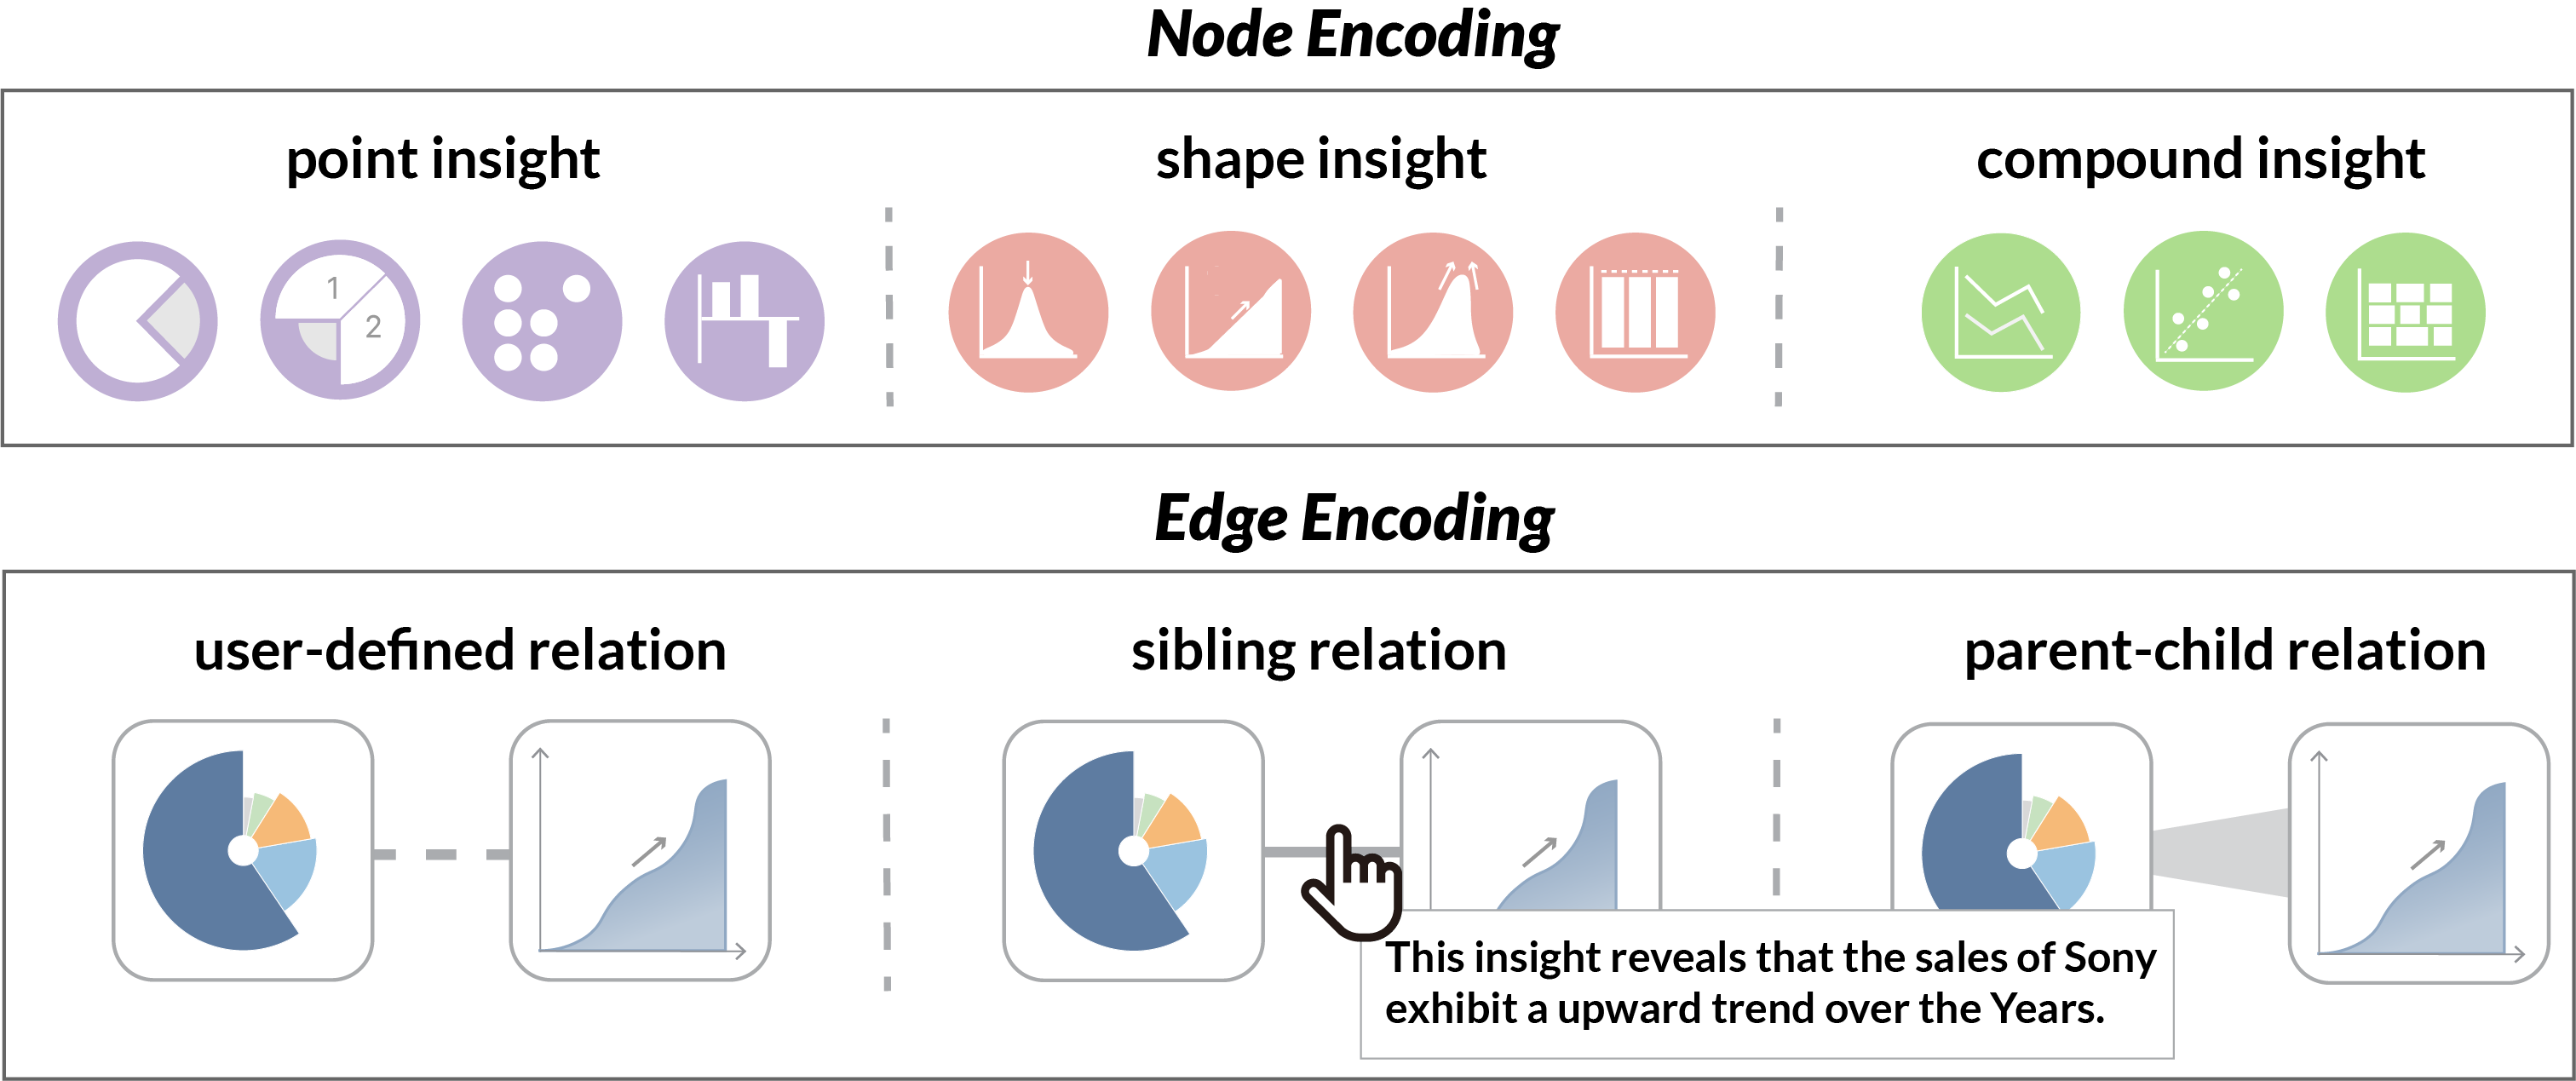
Figure 2: Visual mappings of the radial insight graph in the InReAcTable system. For node visual mapping, the color encodes the category, and the icons within the nodes indicate the specific types of insights. For edge visual mapping, we use different patterns and thicknesses to map the three types of relations. Semantic connections are displayed by hovering over the edge.
Subspace Graph Construction and Structural Filtering
Subspace graphs capture sibling and parent-child relationships between data subspaces, enabling intelligent insight filtering and exploration path optimization.
Description Generation and LLM-based Reasoning
The Reasoning module converts data insights into natural language, utilizing @@@@2@@@@ for embedding and FAISS for efficient retrieval, allowing the system to balance user queries with contextual relevance dynamically.
Use Case and Evaluation
A use case demonstrated the framework's utility, guiding a data analyst through constructing a coherent data story by iteratively exploring different insights. A comparative user study with two baseline systems (vizGPT and QuickSight) confirmed the framework’s superior quality in terms of logicality, coherence, diversity, and relevance of generated data stories (Figure 3, Figure 4).
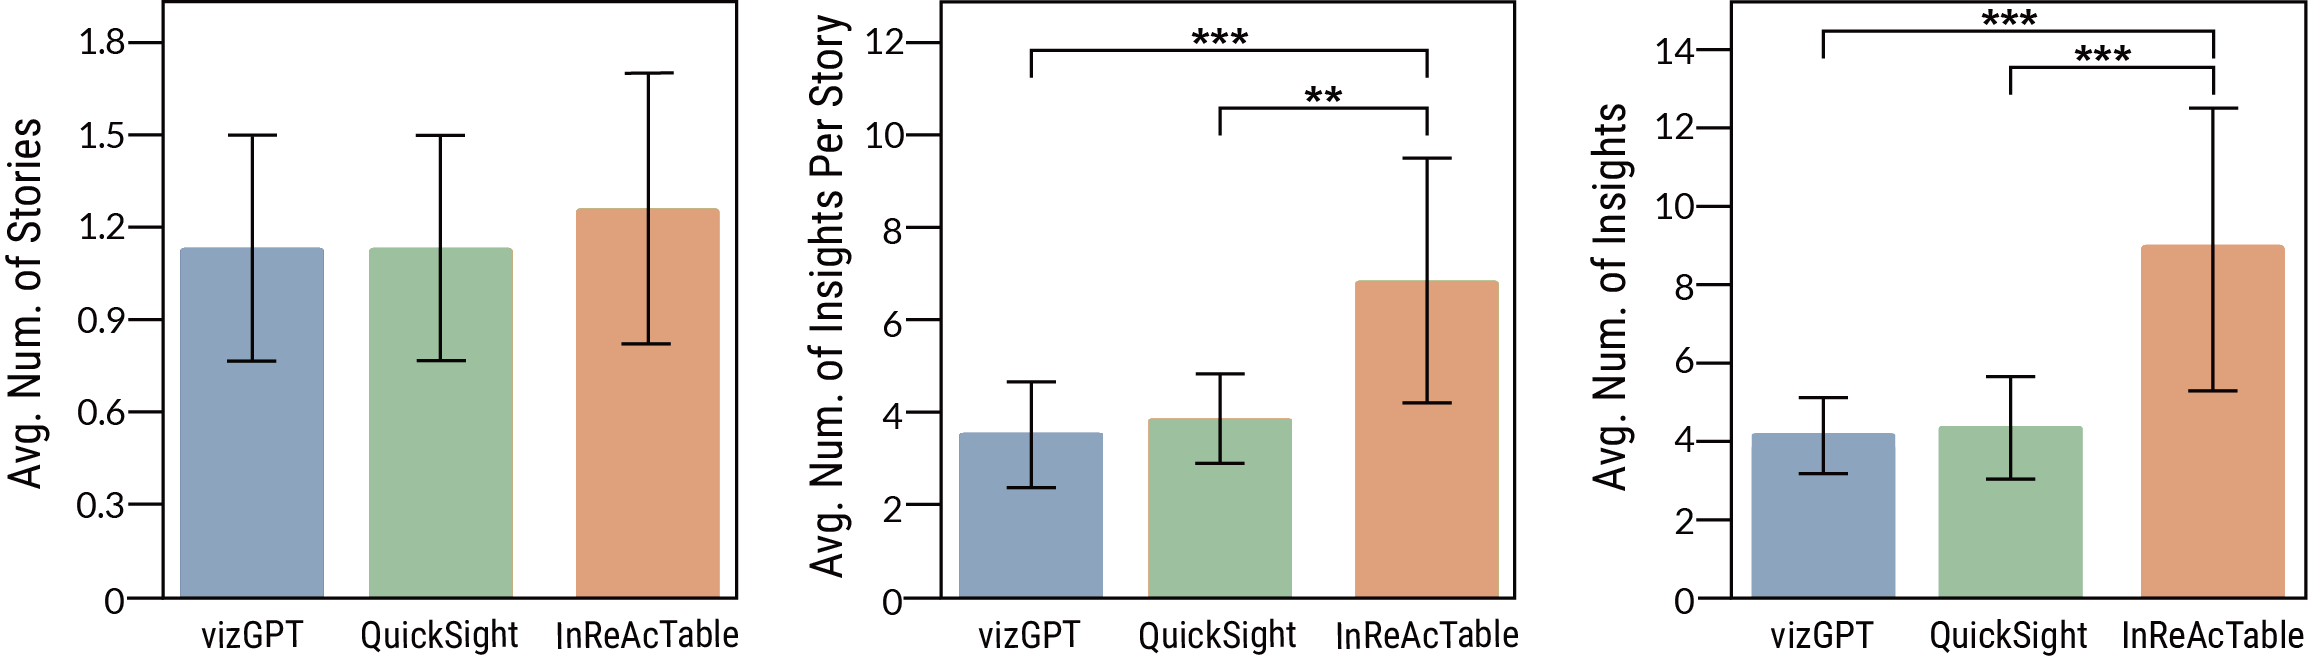
Figure 3: Quantitative evaluation results of user experiments. Comparison of the number of data stories (left), the number of insights per story (middle), and the total number of insights (right) generated by participants using InReAcTable and baseline systems in Task 1. (
* p < 0.01, *** p < 0.001)*
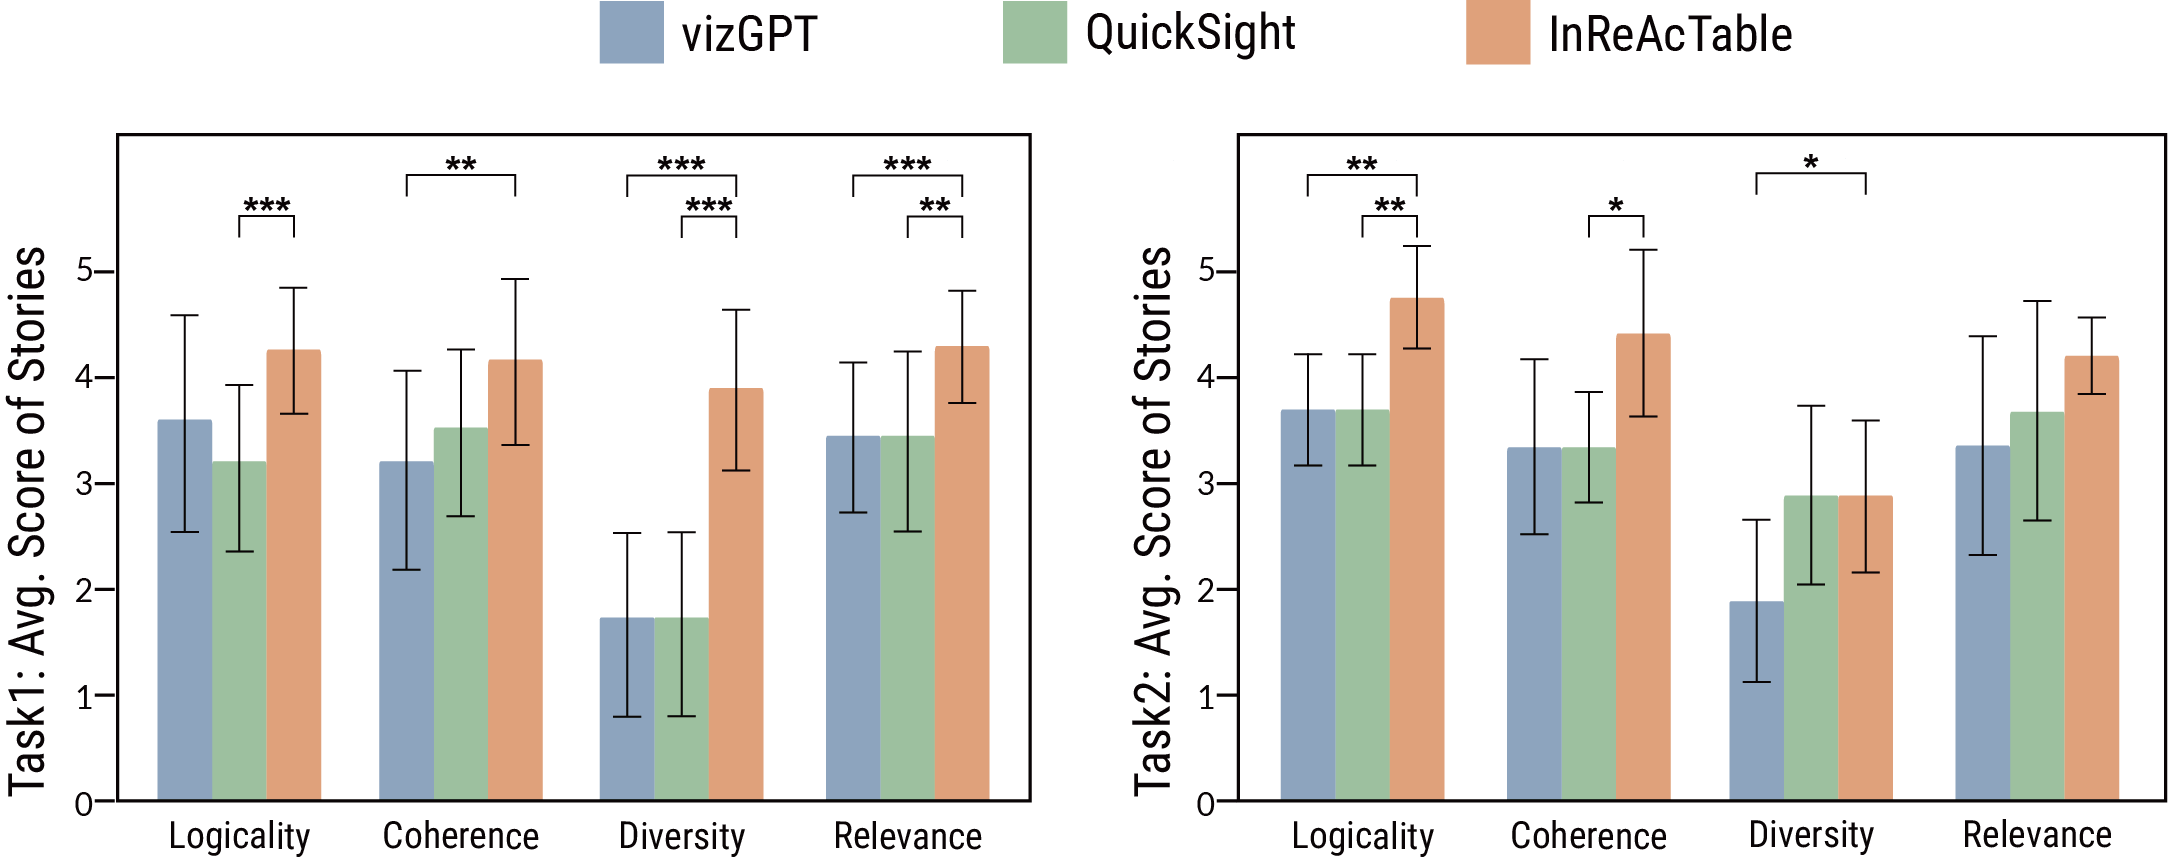
Figure 4: Qualitative evaluation results of data stories constructed using InReAcTable and other baseline systems. Comparison of the expert ratings on logicality, coherence, diversity, and relevance in Task 1 (left) and Task 2 (right). (
p < 0.05, ** p < 0.01, *** p < 0.001)*
Conclusion
InReAcTable represents a significant advancement in interactive visual data story construction, allowing dynamic exploration guided by structural and semantic insights adapted to user intent. This framework supports efficient and coherent narrative construction from complex tabular datasets, demonstrating potential for broader applications in data storytelling and analysis. Future improvements may focus on expanding insight types, enhancing scalability, and reducing computational latency.