Large Causal Models from Large Language Models
Abstract: We introduce a new paradigm for building large causal models (LCMs) that exploits the enormous potential latent in today's LLMs. We describe our ongoing experiments with an implemented system called DEMOCRITUS (Decentralized Extraction of Manifold Ontologies of Causal Relations Integrating Topos Universal Slices) aimed at building, organizing, and visualizing LCMs that span disparate domains extracted from carefully targeted textual queries to LLMs. DEMOCRITUS is methodologically distinct from traditional narrow domain and hypothesis centered causal inference that builds causal models from experiments that produce numerical data. A high-quality LLM is used to propose topics, generate causal questions, and extract plausible causal statements from a diverse range of domains. The technical challenge is then to take these isolated, fragmented, potentially ambiguous and possibly conflicting causal claims, and weave them into a coherent whole, converting them into relational causal triples and embedding them into a LCM. Addressing this technical challenge required inventing new categorical machine learning methods, which we can only briefly summarize in this paper, as it is focused more on the systems side of building DEMOCRITUS. We describe the implementation pipeline for DEMOCRITUS comprising of six modules, examine its computational cost profile to determine where the current bottlenecks in scaling the system to larger models. We describe the results of using DEMOCRITUS over a wide range of domains, spanning archaeology, biology, climate change, economics, medicine and technology. We discuss the limitations of the current DEMOCRITUS system, and outline directions for extending its capabilities.

Paper Prompts
Sign up for free to create and run prompts on this paper using GPT-5.
Top Community Prompts
Explain it Like I'm 14
Overview
This paper introduces a new way to build huge “cause-and-effect” maps using modern AI LLMs. The system is called DEMOCRITUS. Instead of running lab experiments with numbers, DEMOCRITUS asks a powerful AI (a LLM, or LLM) for many small cause-and-effect statements across many subjects (like climate, economics, medicine, archaeology). It then organizes these pieces into a single, structured map called a Large Causal Model (LCM) that people can search, visualize, and explore.
The big idea: turn the AI’s scattered knowledge into a clear, navigable map of how different things might influence each other.
Objectives
The paper aims to:
- Show how to use an LLM to collect millions of short, plausible cause-and-effect statements across many topics.
- Convert those statements into a structured graph (a network) where each arrow says “X affects Y.”
- Use special tools to clean and organize that graph so it becomes a meaningful map rather than a messy tangle.
- Demonstrate the system on real-world examples, like the possible causes of the Indus Valley Civilization’s decline.
- Explain what the system can and cannot do today, and how it might be improved.
Methods and Approach
Think of DEMOCRITUS as a careful map-maker. It builds the map in six steps:
- First, it asks the LLM to suggest subtopics under a big subject (like “Macroeconomics” or “Indus Valley Civilization”).
- Next, it asks the LLM to write short cause-and-effect questions and answers for each subtopic (like “What causes droughts?”).
- Then, it extracts “triples” from the sentences: this just means turning “Reduced rainfall leads to lower river flow” into a tidy format like (reduced rainfall, leads to, lower river flow).
- It builds a big network from these triples: nodes are the things (like “rainfall” or “river flow”) and arrows are the relations (“causes,” “reduces,” “leads to,” etc.).
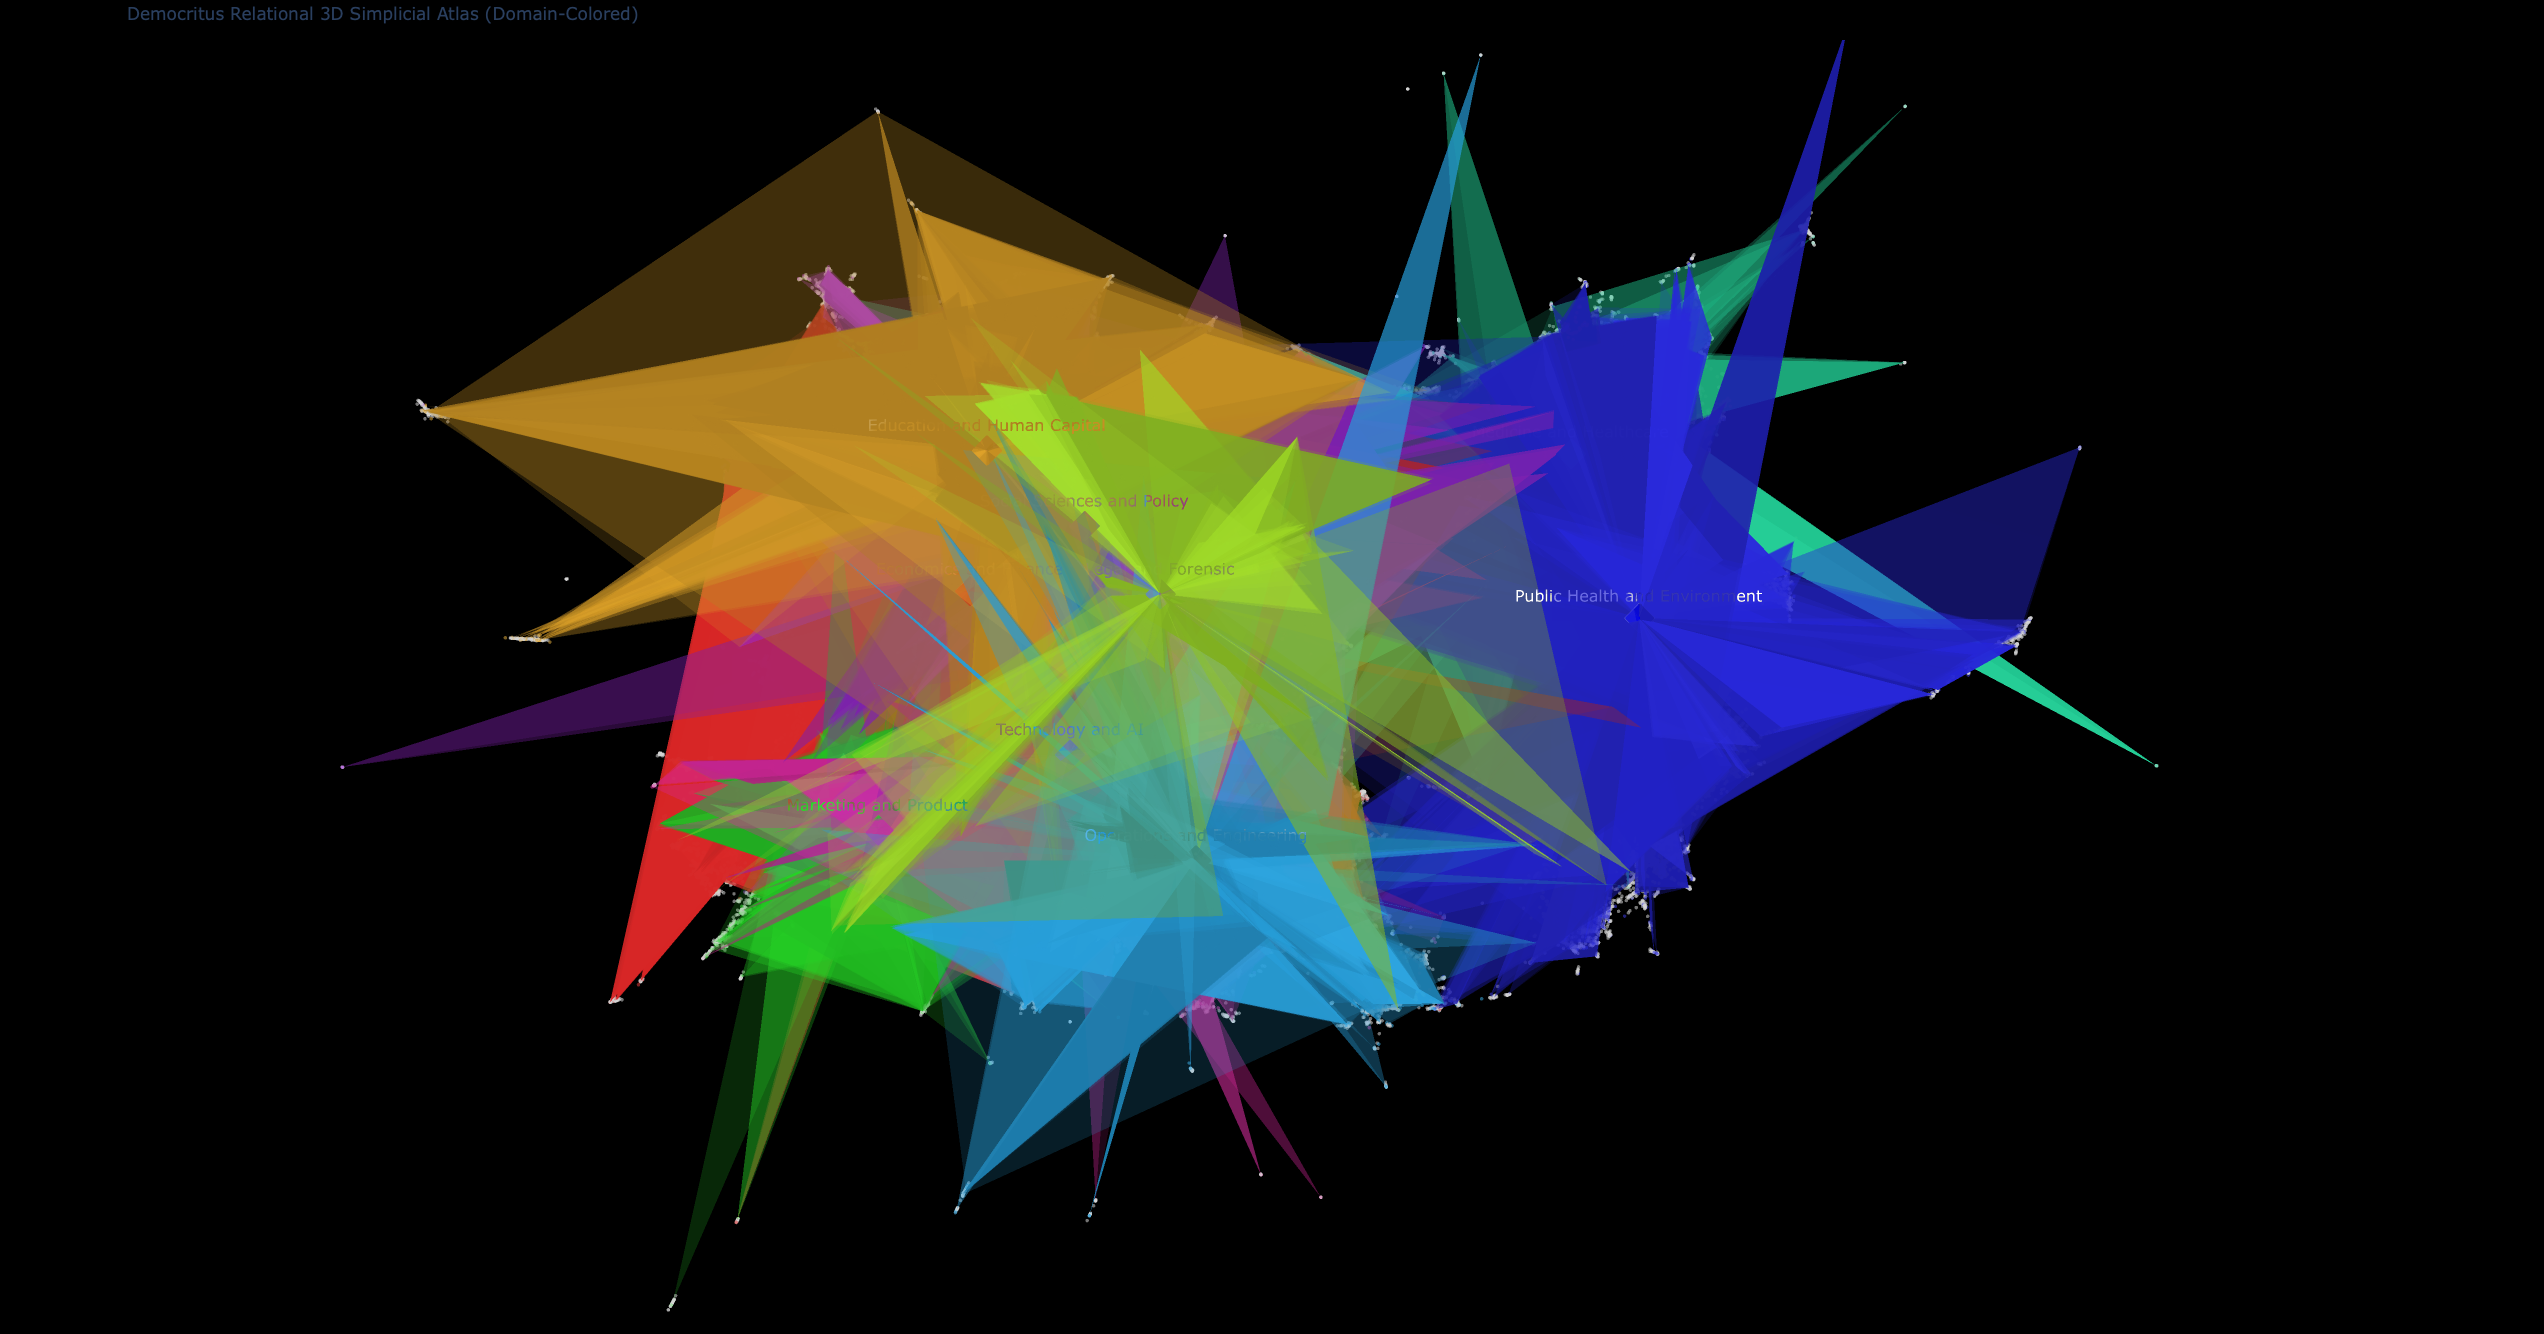
- To organize the network, it uses a Geometric Transformer. You can think of this like a very smart organizer that looks not just at direct links, but at small patterns (triangles and chains) and pulls related ideas closer together.
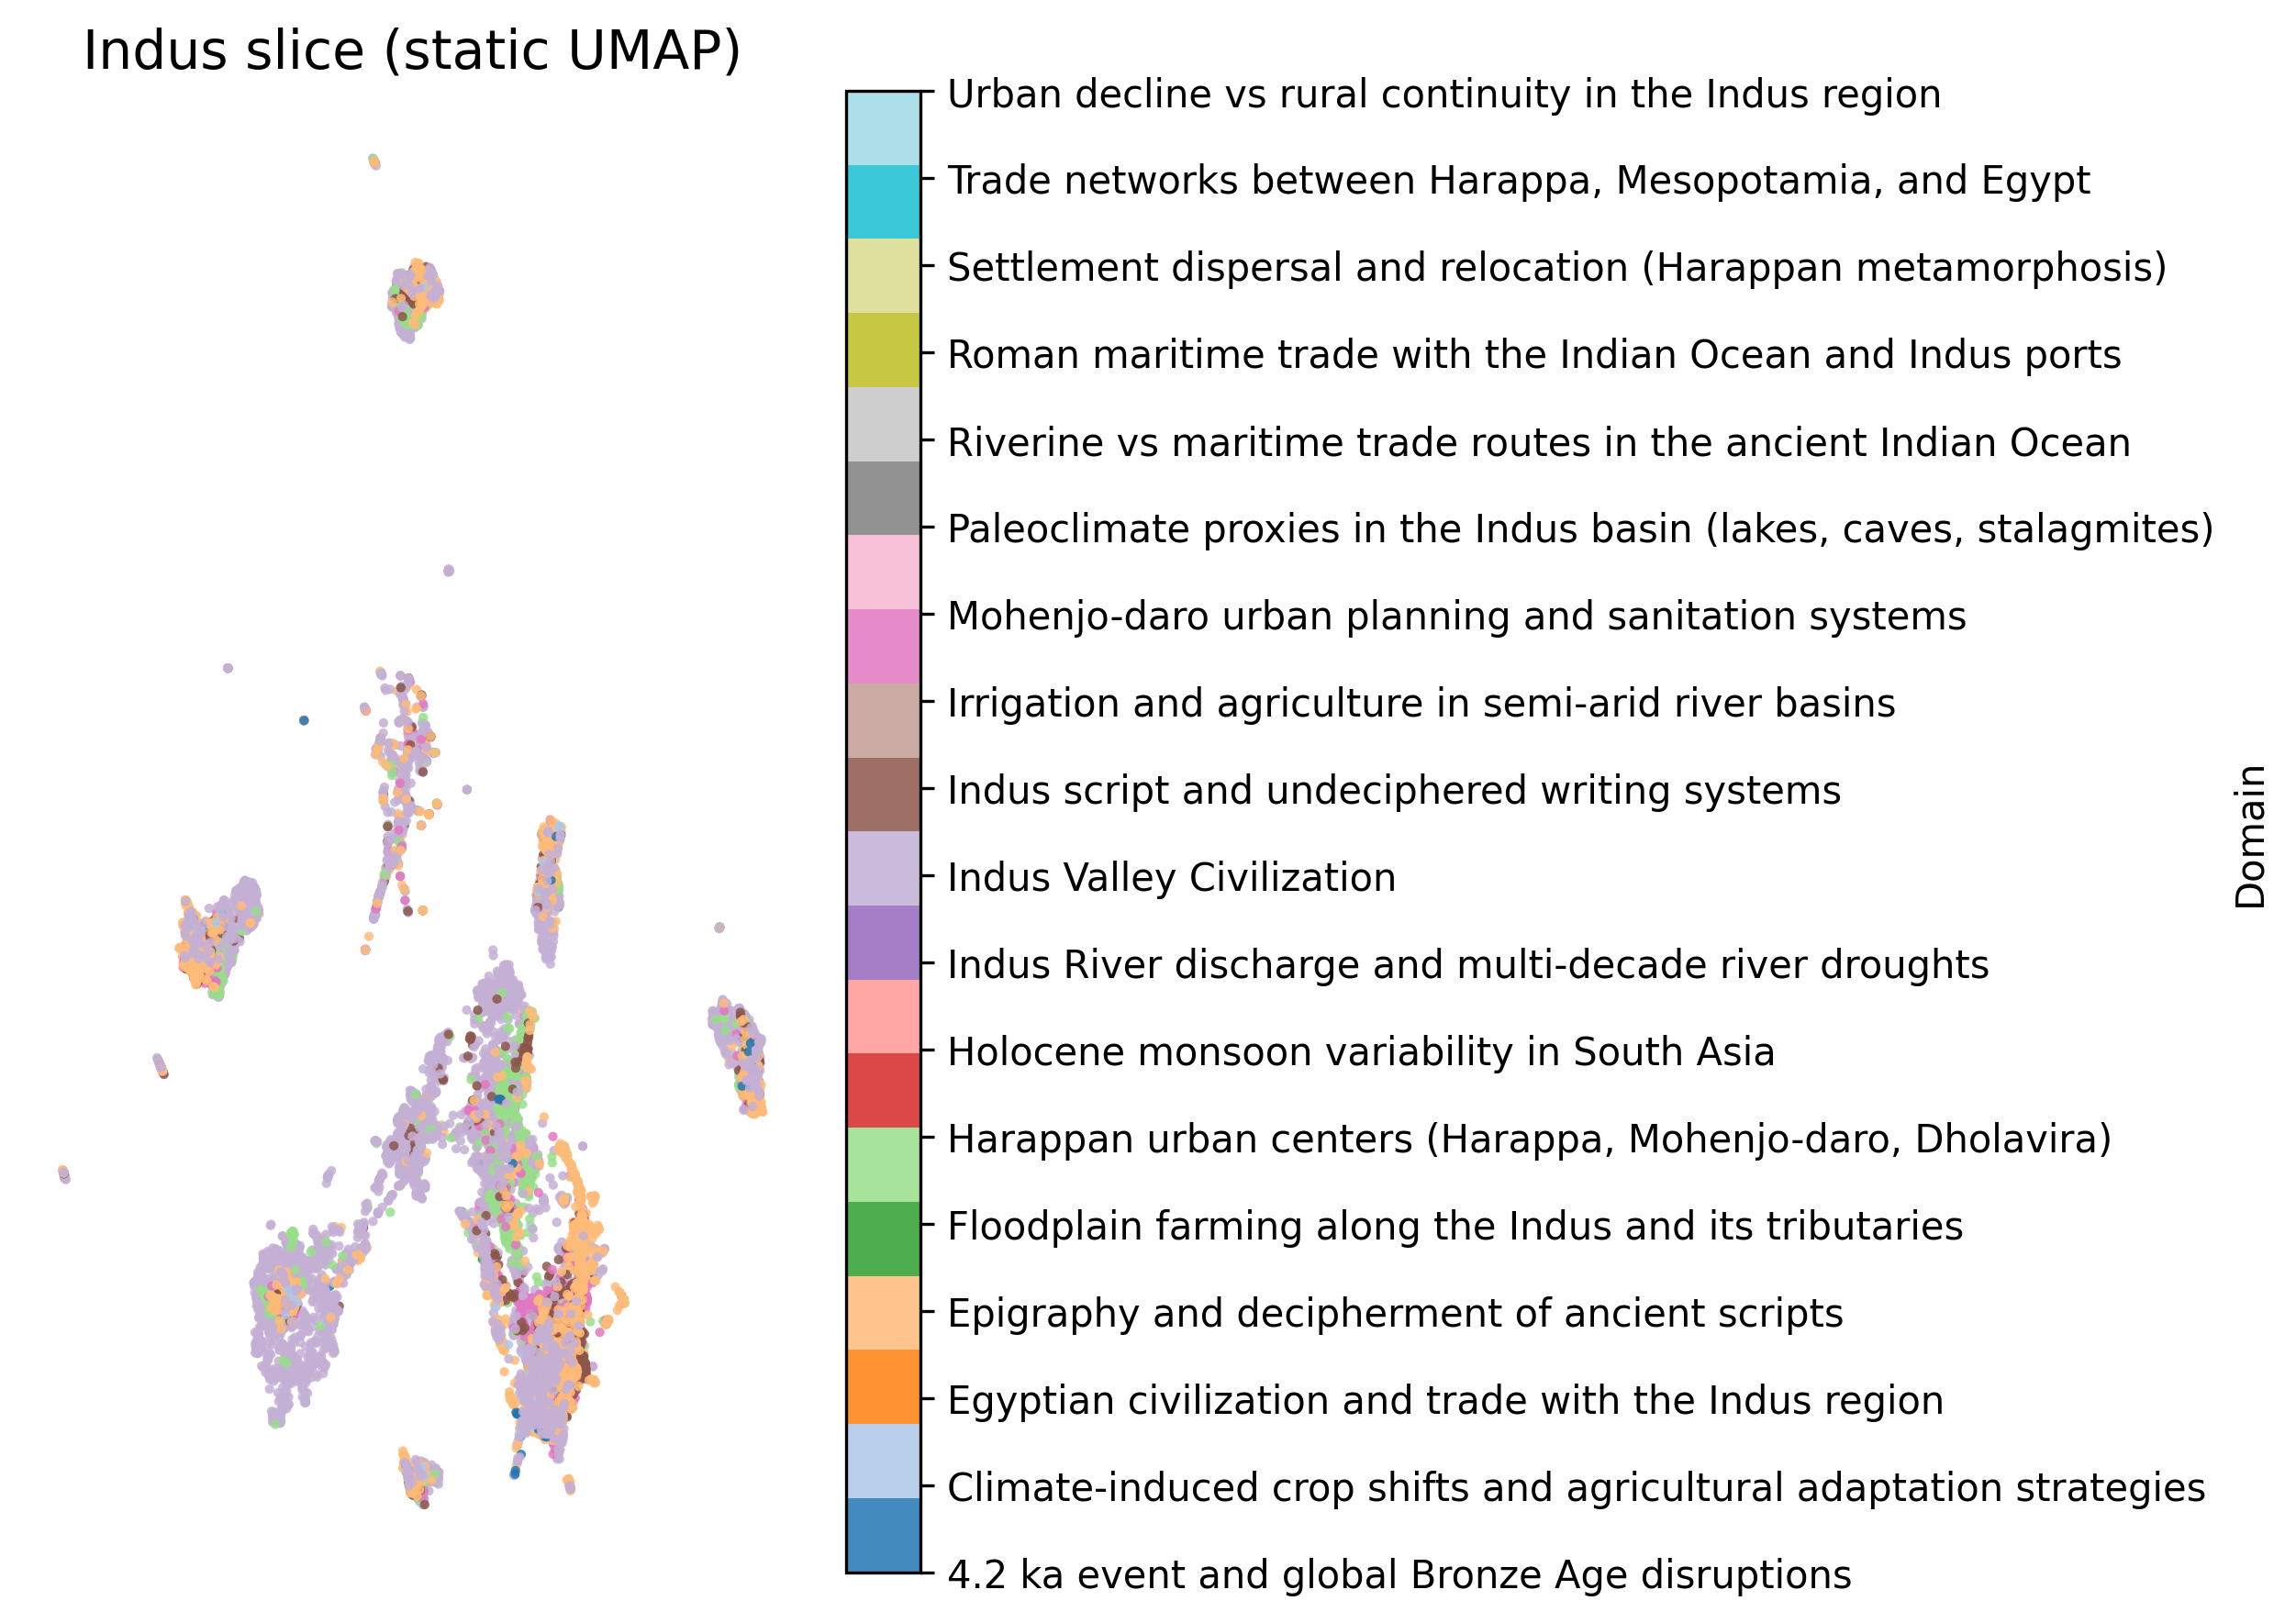
- Finally, it uses UMAP to make a 2D or 3D picture of the network. UMAP is like compressing a large, complex shape into a flat map while trying to keep nearby things still close in the picture. It stores these maps by “slices” (like folders for each domain), which the system can later combine or compare.
Key terms explained in everyday language:
- LLM: A powerful AI that reads and writes text and has absorbed lots of facts and patterns from the internet.
- Causal triple: A simple, machine-friendly version of a cause-and-effect sentence, like “X causes Y.”
- Geometric Transformer: A tool that re-organizes the network by paying attention to how items connect in small shapes (like triangles), not just single links. It helps the map make sense.
- UMAP: A visualization tool that turns a high-dimensional map into a low-dimensional picture so we can see clusters and neighborhoods.
- Slice: A slice is like a domain-specific folder or neighborhood (for example, one slice for economics and another for biology) inside the larger map.
Main Findings
The system produces big, meaningful maps of cause-and-effect relations:
- It builds clear clusters by topic. For example, climate-related variables group together, and economics topics form their own region. This shows the map is not random; related ideas end up near each other.
- It finds bridges between domains. For instance, “generative AI” connects education, productivity, misinformation, and creativity in the map.
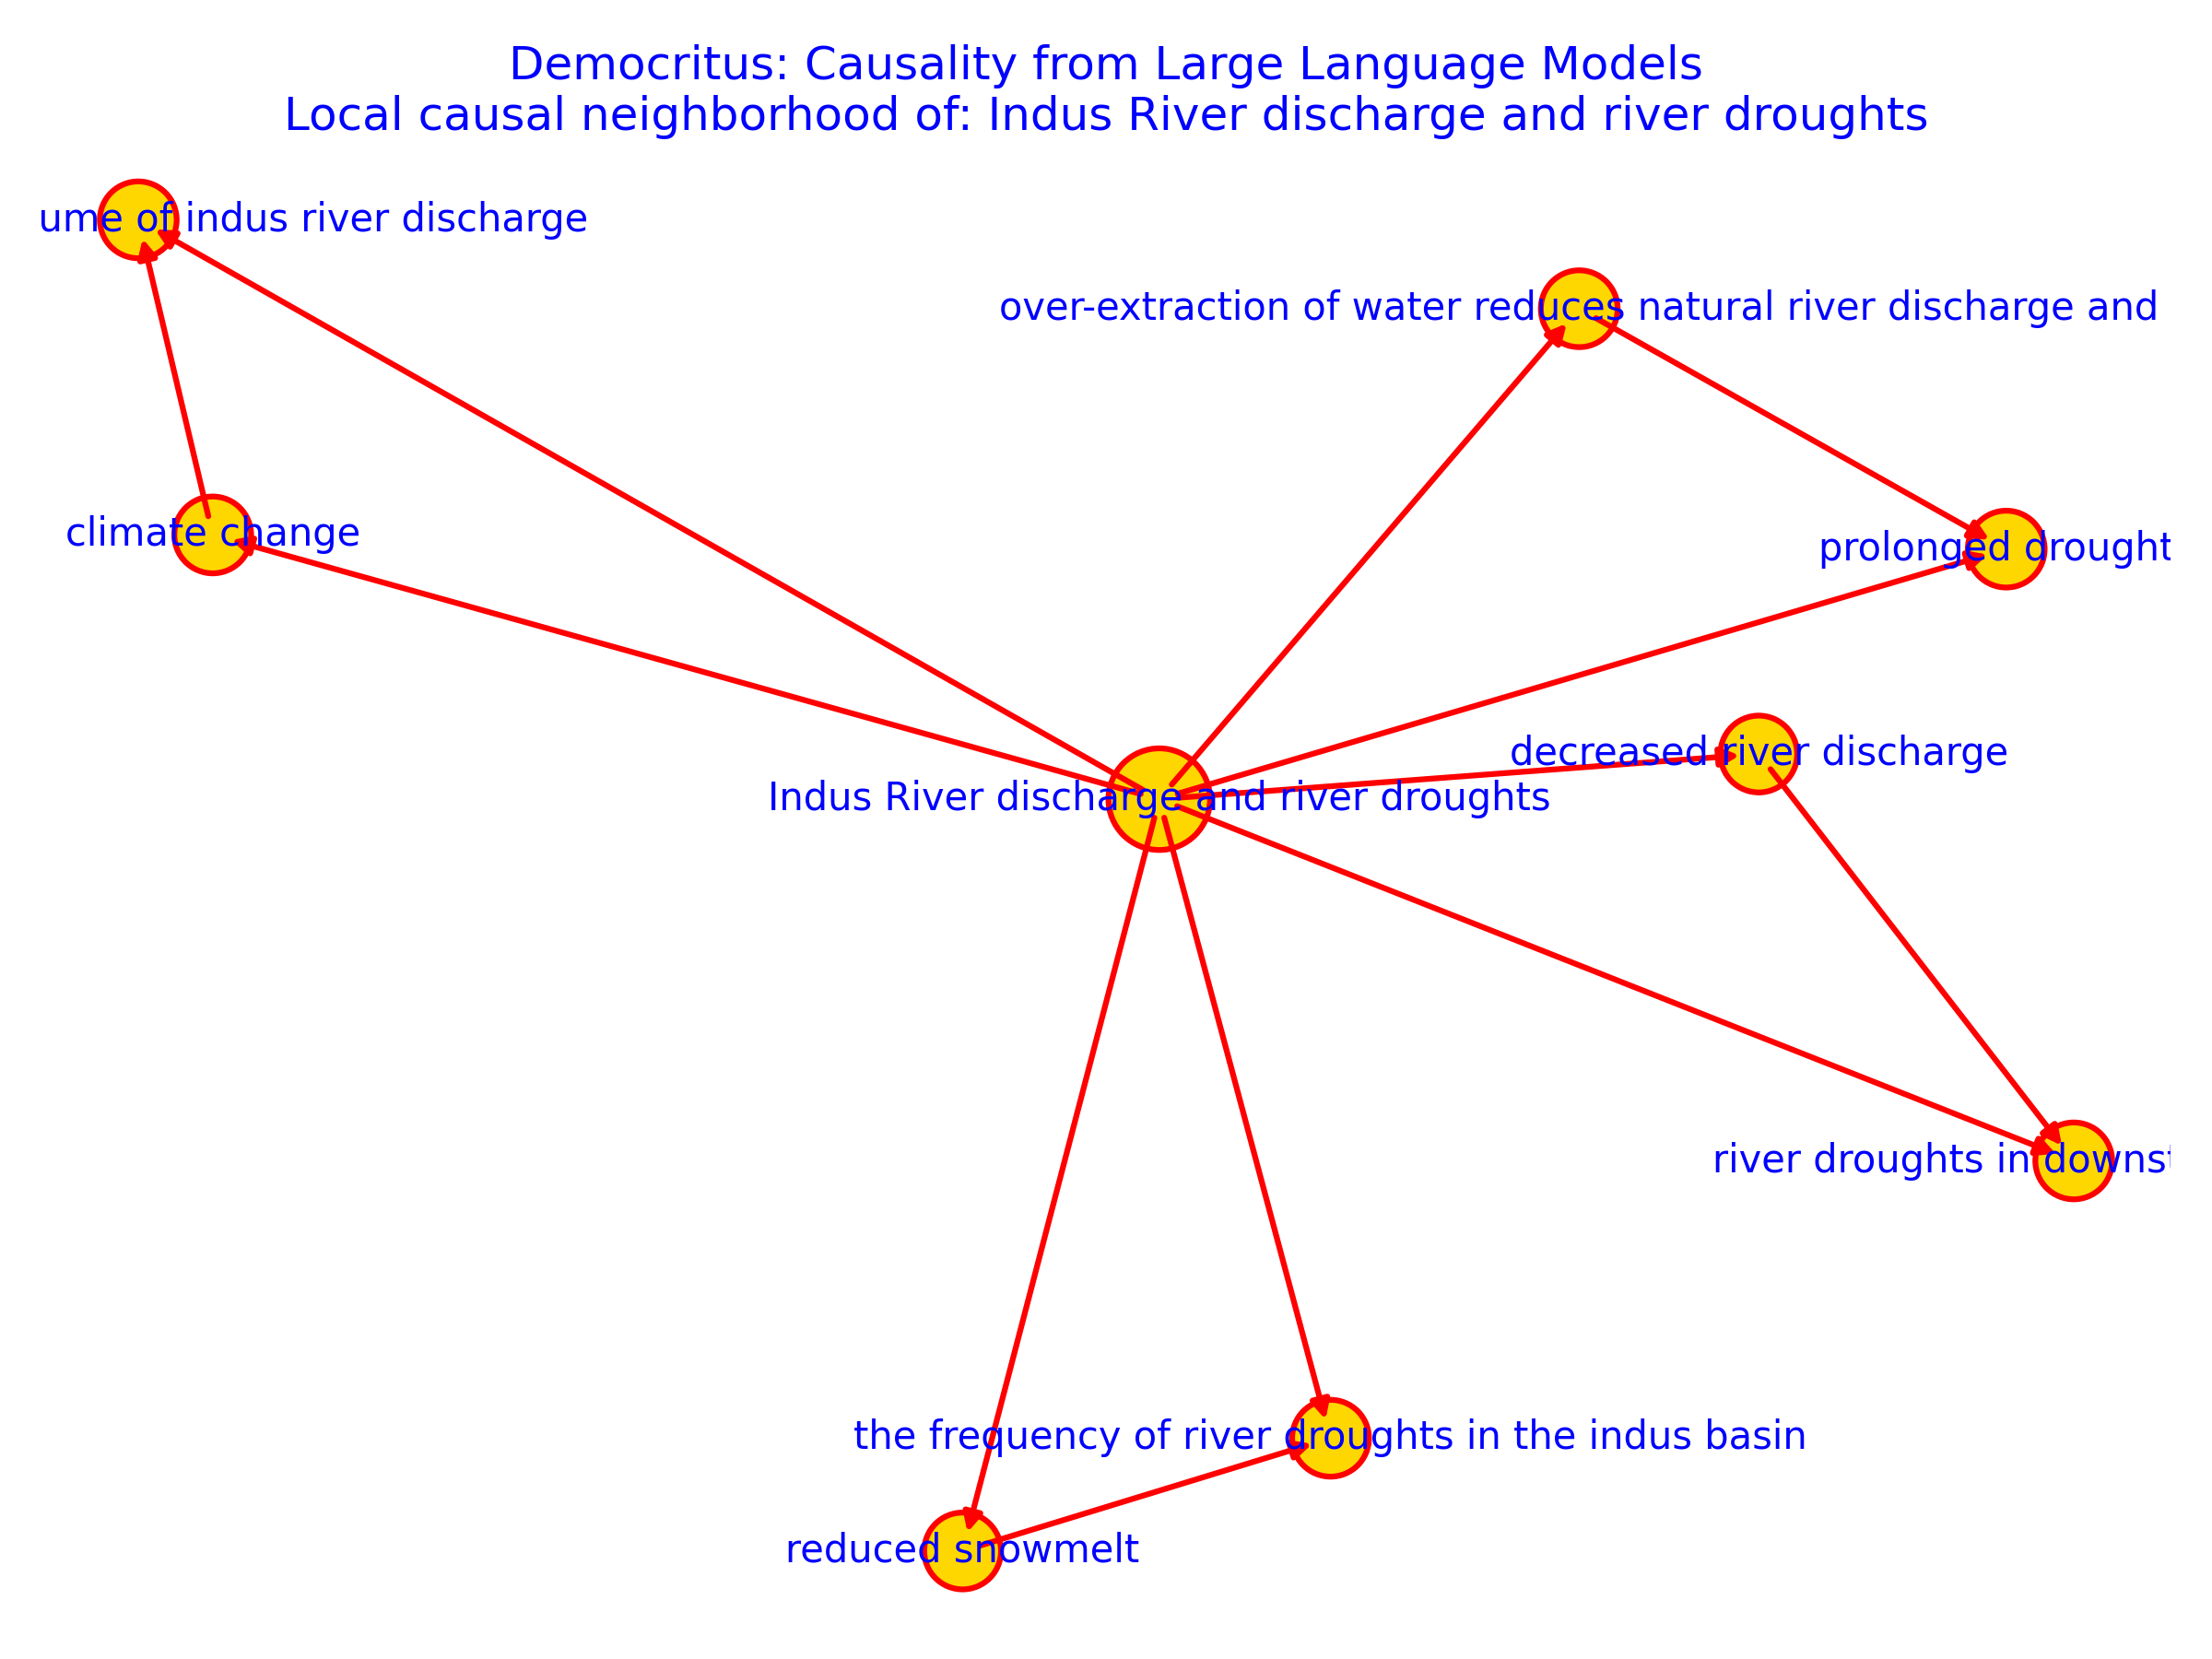
- Local neighborhoods make sense. Around “electricity demand,” it automatically shows related causes, like heating and cooling needs, EV charging, and industrial activity. Around “minimum wage,” it shows links to employment, consumer spending, and inflation.
- It highlights hubs (very connected ideas). These are important drivers such as stress, inflation, vaccination, and exercise—common “big factors” that affect many things.
- It can expand real studies. For the Indus Valley Civilization example, it gathered causes like monsoon changes, river flow, agriculture, and trade, and organized them into a map showing how these factors might connect. This is not something a single prompt to an LLM could do; it requires assembling and organizing many small pieces.
Why this matters:
- Using the Geometric Transformer makes a huge difference. Without it, the map looks like a “hairball” (a messy tangle). With it, the map reveals structure, clusters, and meaningful paths.
- Researchers can use the map to spot missing links, compare alternative explanations, and discover new questions.
Implications and Impact
In simple terms, DEMOCRITUS is a powerful “idea organizer” for causes and effects:
- It helps scientists and students explore complex topics by seeing how many small causes might connect into bigger pictures.
- It can suggest alternative explanations and modern parallels (for example, connecting ancient drought patterns to today’s climate risks).
- It can guide where to dig deeper. If a region of the map looks important or confusing, the system can ask the LLM for more details just in that area, saving time and cost.
Important limitations:
- The system does not prove anything yet. It doesn’t measure effect sizes or test hypotheses with data. It organizes plausible ideas from text.
- Future versions aim to combine this map with real numbers and experiments so the strengths of connections can be validated.
Bottom line: DEMOCRITUS turns the vast, scattered knowledge inside AI LLMs into large, structured cause-and-effect maps. These maps are useful starting points for exploring complex questions, spotting gaps, and planning deeper, data-driven research.
Knowledge Gaps
Unresolved Knowledge Gaps, Limitations, and Open Questions
Below is a single, concrete list of what remains missing, uncertain, or unexplored in the paper, framed as actionable gaps for future research.
- Quantitative validation: No evaluation of LCM edges against observational or interventional datasets; define protocols to estimate effect sizes, test identifiability, and perform formal causal validation.
- Edge weights and uncertainty: All edges default to weight
1.0; develop methods to assign calibrated strengths, confidence, and uncertainty intervals from text, corpora, or data. - Contradiction detection and resolution: LLM-generated causal claims may conflict; specify algorithms (logic constraints, probabilistic reconciliation, paraconsistent reasoning) to detect and resolve contradictions.
- Entity canonicalization: Variables are raw phrases; implement robust concept normalization (NER, coreference, synonym/variant merging, lemmatization) and assign stable IDs to reduce fragmentation.
- Ontology alignment: No alignment to external ontologies/KBs (e.g., UMLS, MeSH, SNOMED, Wikidata); create mapping pipelines to anchor variables and relations to standardized vocabularies.
- Relation semantics: Causal and non-causal relations (e.g.,
is-a,part-of) are mixed; separate and constrain relation types with formal semantics to avoid conflating taxonomy with causality. - Temporal structure: Models lack time-indexing and lags; encode temporality (event ordering, time windows, multi-scale durations) and support dynamic/recursive causal processes.
- Cycles and feedback: No handling of feedback loops or cyclic causality; design methods to detect, represent, and reason about cycles (e.g., equilibrium, control-theoretic or dynamic SCMs).
- Confounders and conditioning: No systematic discovery of confounders, mediators, moderators, or selection effects; add algorithms to propose and test latent structure and adjustment sets.
- Negation and conditionality: Statements with qualifiers (“only if”, “unless”, “under X”) are not parsed; enrich triple extraction to capture polarity, necessary/sufficient conditions, and contingencies.
- Provenance and citation: Claims lack source attribution; integrate retrieval-augmented generation with citations, track provenance, and score source reliability and recency.
- Bias and ethics: LLM-sourced claims may reflect training biases; audit domain, geographic, and cultural bias, and implement safeguards against misinformation propagation.
- Evaluation metrics: Current assessments are qualitative (plots); define quantitative metrics (precision/recall against gold causal datasets, modularity/assortativity, spectral/stability measures, link prediction performance).
- Baselines and ablations: Limited baselines (UMAP vs GT); add comprehensive comparisons (KG embeddings, GNN variants, higher-order graph models) and ablations of GT components/hyperparameters.
- Reproducibility: LLM outputs are non-deterministic; publish code, seeds, datasets, prompt templates, and report run-to-run variance across models and temperatures.
- Scalability and cost: LLM calls dominate; provide formal complexity and memory profiles, and demonstrate distributed/streaming “map-reduce” builds at million-scale triples.
- Active exploration policy: The “active deepening” concept is sketched but not specified; define budgeted exploration policies, utility functions, stopping criteria, and safety checks to avoid confirmation bias.
- Cross-slice unification: The algorithm for merging domain slices is unspecified; design principled cross-slice integration (entity resolution, conflict arbitration, edge reconciliation across domains).
- Topos reasoning integration: DEMOCRITUS is a topos builder, not a reasoner; specify APIs, inference rules (e.g., Judo calculus), soundness/completeness guarantees, and example intervention/counterfactual workflows.
- Ground-truth case studies: The Indus Valley example remains qualitative; implement expert-curated benchmarks and blind evaluations to measure coverage, correctness, and usefulness in historical/archaeological domains.
- Variable typing and measurement: No variable types, units, or measurement models; introduce schemas (categorical/continuous), units, scales, and link to measurable indicators for data integration.
- Domain generalization: Coverage is English-centric and limited to nine domains; evaluate multilingual extensions and transfer to low-resource domains.
- Safety and security: No discussion of prompt injection or integrity of generated structures; add adversarial testing, validation gates, and audit trails for edits and merges.
Practical Applications
Immediate Applications
The following applications can be deployed now using DEMOCRITUS’ current capabilities for textual causal extraction, organization, and visualization. Each item includes sectors, potential tools/products/workflows, and key assumptions/dependencies that affect feasibility.
- Cross-domain causal literature mapping for research synthesis
- Sectors: academia; research management; think tanks
- Tools/products/workflows: “LCM Explorer” to build and browse domain slices (e.g., archaeology, biology, macroeconomics), UMAP visualizations of causal neighborhoods/hubs, exportable topic/graph views for teams
- Assumptions/dependencies: relies on LLM coverage/quality; triple extraction accuracy; requires human expert review due to lack of numerical validation
- Systematic hypothesis generation and confounder enumeration
- Sectors: academia (social sciences, economics, climate science), healthcare (epidemiology, public health)
- Tools/products/workflows: “Causal Hypothesis Assistant” that produces candidate mechanisms, mediators, confounders; workflow to tag gaps/contradictions and plan data collection
- Assumptions/dependencies: hypotheses are text-derived and not effect-sized; depends on domain experts to filter plausible claims and design studies
- Policy brief causal maps and narrative building
- Sectors: policy (climate, health, labor, infrastructure), NGOs, multilateral organizations
- Tools/products/workflows: “Policy Causal Map Generator” to organize causal claims from reports into slice-specific manifolds; briefing dashboards
- Assumptions/dependencies: potential LLM bias and recency gaps; requires curated sources; needs disclaimers on evidence strength
- Enterprise causal knowledge graph from internal documents
- Sectors: software, manufacturing, energy, financial services
- Tools/products/workflows: “Causal KG Pipeline” to ingest postmortems, reports, SOPs; generate relational causal triples; visualize causal hubs (e.g., common failure drivers)
- Assumptions/dependencies: access to internal corpora; privacy/compliance (PII, IP); entity linking quality; governance for updates
- Marketing strategy and campaign planning
- Sectors: marketing, consumer products, media
- Tools/products/workflows: “Campaign Causal Navigator” to map causal links (e.g., long-term influencer partnerships → engagement/brand loyalty), identify alternative mechanisms, plan A/B tests
- Assumptions/dependencies: qualitative claims may be generic; requires market experimentation to validate; potential domain drift
- Qualitative supply-chain risk webs
- Sectors: manufacturing, logistics, retail, energy
- Tools/products/workflows: “Supply Chain Causal Map” linking input price shocks, transport constraints, policy changes to demand/sales/inventory; scenario exploration
- Assumptions/dependencies: depends on up-to-date texts and expert curation; lacks quantitative effect sizes; needs custom vocabularies
- DevOps/AIOps incident reviews with causal narrative graphs
- Sectors: software, cloud operations
- Tools/products/workflows: “AIOps Causal Reviewer” that extracts causes from incident reports, clusters repeating motifs, surfaces cross-service confounders
- Assumptions/dependencies: quality of postmortem text; secure ingestion; consistency in relation typing; human-in-the-loop remediation
- Education and curriculum design around causal reasoning
- Sectors: education (secondary, higher ed, vocational training)
- Tools/products/workflows: “Classroom LCM Visualizer” enabling students to explore domain slices (e.g., inflation dynamics, ecology), build local causal neighborhoods, critique and refine
- Assumptions/dependencies: instructional oversight; guardrails for correctness; domain-specific content vetting
- Historical and archaeological synthesis (e.g., Indus Valley case)
- Sectors: humanities, archaeology, history
- Tools/products/workflows: “Historical Causal Atlas” to aggregate cross-field narratives (climate → hydrology → trade/agriculture → settlement changes), show alternative hypotheses
- Assumptions/dependencies: interpretative nature of evidence; no experimental validation; requires careful source curation
- Patient education and lifestyle decision maps
- Sectors: healthcare; daily life
- Tools/products/workflows: “Personal Health Cause Map” (e.g., stress/exercise/diet → cardiovascular risk); printable causal guides; links to reputable guidelines
- Assumptions/dependencies: non-prescriptive; requires clear disclaimers and alignment with clinical guidance; avoid overgeneralization
- Climate communication and impact narratives
- Sectors: policy, energy, climate NGOs, municipalities
- Tools/products/workflows: “Climate Causal Storyboard” mapping energy demand → emissions → local impacts; cross-domain hubs (e.g., AI ↔ productivity ↔ emissions)
- Assumptions/dependencies: authoritative sources; potential politicization; transparency about uncertainty
- Causal search across corpora for knowledge management
- Sectors: software, legal, consulting, R&D
- Tools/products/workflows: “Causal Search Plugin” that returns causal triples and local graphs for queries, with slice filtering and neighborhood exploration
- Assumptions/dependencies: robust indexing and entity normalization; prompt templates; ongoing maintenance of relation taxonomies
Long-Term Applications
These applications require further research, scaling, integration with quantitative datasets, or development of formal reasoners. Each item includes sectors, potential tools/products/workflows, and key assumptions/dependencies.
- Data-validated causal estimation integrated with observational/experimental datasets
- Sectors: academia, healthcare, finance, public policy
- Tools/products/workflows: “LCM+CI Platform” combining DEMOCRITUS’ hypothesis manifold with causal inference modules (effect sizes, identification strategies, robustness checks)
- Assumptions/dependencies: access to high-quality datasets; causal identification (instrumental variables, DAG constraints); MLOps for reproducibility
- Decision support systems powered by intuitionistic topos reasoners
- Sectors: policy analysis, enterprise strategy, risk management
- Tools/products/workflows: “Causal Policy Simulator” that evaluates alternative interventions via Judo calculus over slices; scenario planning with constraints
- Assumptions/dependencies: maturation of topos-based reasoning engines; formal semantics alignment with decision workflows; explainability requirements
- Active manifold building and budgeted exploration
- Sectors: software platforms, research tooling
- Tools/products/workflows: “Active LCM Builder” that selectively deepens high-value regions based on downstream task signals (e.g., prediction error, expert clicks)
- Assumptions/dependencies: controller design; cost-aware LLM orchestration; task-specific utility functions; monitoring of drift
- Cross-domain early-warning and risk nexus monitoring
- Sectors: finance, supply chain, public health, disaster management
- Tools/products/workflows: “Risk Nexus Monitor” connecting causal hubs across slices (e.g., drought → crop yields → prices → unrest), alerts from streaming signals
- Assumptions/dependencies: integration with real-time data; calibration and false-positive management; governance for alerts
- Biomedical mechanistic discovery and trial prioritization
- Sectors: healthcare, biotech, pharma
- Tools/products/workflows: “Drug Target Causal Graph” linking literature-derived mechanisms to omics/electronic health records; ranking candidate interventions
- Assumptions/dependencies: multi-modal data integration; expert curation; ethical/privacy constraints; regulatory validation pathways
- Regional climate-adaptation planning with quantitative impacts
- Sectors: policy, urban planning, energy/infrastructure
- Tools/products/workflows: “Regional Causal Planner” combining narrative slices with climate/utility datasets to prioritize interventions (e.g., water storage, grid resilience)
- Assumptions/dependencies: local datasets, simulators, and constraints; stakeholder input; equity and environmental justice considerations
- Macrofinancial stress testing with causal manifolds
- Sectors: finance; central banks; risk analytics
- Tools/products/workflows: “Macro Causal Stress Lab” mapping policy shocks to macro variables (aggregate demand, inflation, unemployment), estimating transmission channels
- Assumptions/dependencies: robust econometric integration; model risk governance; disclosure and audit trails
- Adaptive learning systems that target misconceptions via causal maps
- Sectors: education technology
- Tools/products/workflows: “Causal Tutor” that diagnoses learners’ causal misunderstandings and prescribes targeted practice using slice-aware activities
- Assumptions/dependencies: assessment pipelines; longitudinal learner modeling; pedagogy research for causal reasoning
- Robotics and autonomous systems planning with grounded causal graphs
- Sectors: robotics, autonomous vehicles, industrial automation
- Tools/products/workflows: “Causal Task Planner” linking textual mechanistic knowledge to sensor/action state graphs; intervention-aware planning
- Assumptions/dependencies: grounding textual variables to physical states; real-time performance; safety certification
- Compliance and regulatory change impact analysis
- Sectors: finance, healthcare, energy; legal/compliance
- Tools/products/workflows: “Causal Compliance Analyzer” extracting causal implications of new rules (e.g., reporting → capital → lending), simulating operational impacts
- Assumptions/dependencies: high-quality regulatory corpora; domain ontologies; cross-functional validation
- Misinformation detection via causal contradiction mining
- Sectors: software platforms, media, public policy
- Tools/products/workflows: “Causal Consilience Checker” that flags contradictory causal claims across sources/slices and guides editorial review
- Assumptions/dependencies: robust source attribution; consensus scoring; human adjudication pipelines
- Public health surveillance and intervention impact forecasting
- Sectors: healthcare systems, health departments
- Tools/products/workflows: “Intervention Impact Forecaster” combining narrative causal maps with EHR/pharmacy/surveys to estimate intervention effects (vaccination, masking, messaging)
- Assumptions/dependencies: ethical data access; rigorous causal identification; fairness/health equity auditing; privacy-preserving analytics
Glossary
- 1-simplicial causal graph: A causal graph treated as a 1-dimensional simplicial structure where edges represent causal relations. "we extract causal triples to form a 1âsimplicial causal graph."
- 2-simplices: Triangular higher-order relations in a simplicial complex that capture interactions among three variables. "approximately 9k 2-simplices in total"
- 3D UMAP projection: A three-dimensional embedding produced by UMAP to visualize high-dimensional relational structure. "3D UMAP projection of an LCM constructed from over $90,000$ causal textual statements sampled from GPT models in over $10$ domains."
- 4.2 ka event: A paleoclimate anomaly around 4,200 years ago linked to widespread societal changes and droughts. "other well-known 4.2 ka event stories (Akkadian, Egyptian Old Kingdom, Caral)"
- Causal gradients: Smooth transitions in the manifold indicating progressive causal influence across related variables. "Causal gradients: e.g.\ a clear transition from energy-related factors electricity demand carbon emissions climate impacts."
- Causal site: A categorical structure formed by augmenting a causal graph with higher-order simplices to organize causal information. "Semantic domains supply 2âsimplices, producing a causal site."
- Categorical machine learning: ML approaches grounded in category theory, used to structure and reason about complex relationships. "Addressing this technical challenge required inventing new categorical machine learning methods"
- Consilience: The convergence of evidence across multiple independent sources to support a hypothesis. "evidence accumulates through the consilience of multiple partial traces: geological strata, inscriptions, settlement patterns, and so on."
- Counterfactuals: Hypothetical outcomes under alternative interventions or conditions used in causal reasoning. "representations for causal notions such as interventions and counterfactuals"
- Diagrammatic Backpropagation: A backpropagation method expressed in diagrammatic/categorical terms to refine embeddings. "The Geometric Transformer with Diagrammatic Backpropagation \citep{mahadevan:gt-db} then constructed a resulting multi-relational simplicial complex"
- Ego-graph: The local subgraph consisting of a node and its neighbors within a specified hop distance. "we take the 2-hop ego-graph around the focus node"
- Epigraphy: The study of inscriptions (e.g., Indus script) as evidence in archaeology and history. "Indus script and epigraphy, climate and hydrology (Holocene monsoon variability, Indus river discharge and droughts)"
- Geometric Transformer (GT): A transformer architecture that incorporates geometric/topological message passing over relational structures. "We use an implemented version of the Geometric Transformer (GT), proposed originally in \citep{mahadevan2024gaiacategoricalfoundationsgenerative}"
- Heavy-tailed distribution: A distribution with a high probability of extreme values (e.g., hubs in a causal graph). "The causal graph exhibits a heavy-tailed distribution with recognizable real-world âhigh-impact driversââ emerging as hubs."
- Higher-order motifs: Patterns beyond pairwise edges (e.g., triangles) used for message passing and structure refinement. "higher-order motifs (e.g. triangles as 2-simplices)"
- Holocene: The current geological epoch spanning roughly the last 11,700 years, often referenced in paleoclimate. "Holocene monsoon variability"
- Horn filling: A technique in simplicial sets to fill missing faces (“horns”) used here for generalized backpropagation. "a generalized backpropagation method that works by ``horn filling'' gaps in simplicial sets"
- Identifiability: The property that causal effects can be uniquely determined from data under specified assumptions. "do not guarantee identifiability or causal correctness in the sense of \citet{rubin-book,pearl-book}."
- Indus river discharge: The volume of water flowing in the Indus River, used as a hydrological causal variable. "Holocene monsoon variability, Indus river discharge and droughts"
- Intuitionistic logic: A logic without the law of excluded middle, supported internally by a topos. "A {\em topos} is a type of category \citep{maclane:sheaves} that supports an internal intuitionistic logic."
- Judo calculus: An intuitionistic causal reasoning framework intended to operate over topos-based causal models. "downstream intuitionistic causal reasoners using Judo calculus"
- Laplacian spectra: The set of eigenvalues of a graph Laplacian, used to analyze structural properties of graphs/manifolds. "degree distributions, Laplacian spectra, and stability of these graphs and manifolds"
- Multi-relational simplicial complex: A simplicial complex encoding multiple relation types among variables, enabling higher-order structure. "The Geometric Transformer with Diagrammatic Backpropagation \citep{mahadevan:gt-db} then constructed a resulting multi-relational simplicial complex contains between 553 and 1,336 regime triangles per domain"
- OpenIE: Open Information Extraction; a method for parsing subject–relation–object triples from text. "following the standard OpenIE-style parsing."
- Playa: A dry lakebed that serves as a paleoclimate proxy when assessing historical hydrological changes. "Lake/playa shrinkage"
- Regime triangles: Triangular structures (2-simplices) used to characterize regimes within the learned simplicial complex. "contains between 553 and 1,336 regime triangles per domain"
- Relational manifold: A low-dimensional embedding of a relational graph that preserves neighborhood and cross-domain structure. "Relational manifold (Module 5). Embed the relational graph with a Geometric Transformer, and compute a low-dimensional manifold (2D/3D) for visualization."
- River avulsion: A sudden change in a river’s course, considered as an alternative causal hypothesis in collapse narratives. "river avulsion and course changes"
- Simplicial sets: Combinatorial structures built from simplices with face/degeneracy maps, used here for geometric learning. "gaps in simplicial sets"
- Stalactites: Mineral formations hanging from cave ceilings, used as paleoclimate proxies. "tie paleoclimate proxies (caves, lakes, stalactites) to similar records elsewhere."
- Topos: A categorical structure generalizing spaces, with internal intuitionistic logic and rich morphisms. "A {\em topos} is a type of category \citep{maclane:sheaves} that supports an internal intuitionistic logic."
- Topos Causal Models (TCMs): Causal models formulated within a topos-theoretic framework, enabling slices and decentralized reasoning. "which can be viewed categorically as slices of Topos Causal Models (TCMs)"
- Topos slice: A domain-specific substructure (slice) within a larger topos-based causal architecture. "Topos slice and unification (Module 6)."
- UMAP: Uniform Manifold Approximation and Projection; a dimensionality reduction method for visualizing embeddings. "UMAP data visualization method"
Collections
Sign up for free to add this paper to one or more collections.