The missing links: Evaluating contact tracing with incomplete data in large metropolitan areas during an epidemic
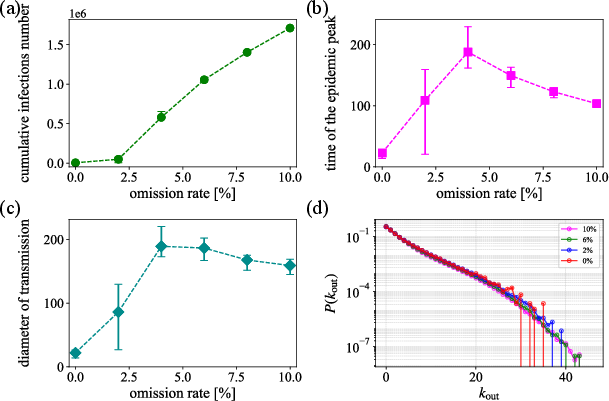
Abstract: Contact tracing (CT) plays a pivotal role in controlling early epidemic spread, particularly when a novel infectious disease emerges. However, the quantitative impact of missing information -- such as untraced cases or unnotified contacts -- on the effectiveness of CT remains insufficiently understood. Using a stochastic agent-based model with sociodemographics from metropolitan areas in South Korea, we simulate how different forms of information loss affect epidemic spreading dynamics. We construct information-loss scenarios based on two types: infector-omission (IO) and contact-omission (CO), including selective (SCO) and uniform (UCO) scenarios; IO corresponds to the omission of infected individuals (nodes) from the tracing process, leading to the loss of all movement trajectories and downstream transmission links originating from them, whereas CO corresponds to the omission of specific contact events (edges), in which infected individuals are identified but some of their transmission links fail to be detected or notified. The sensitivity of epidemic dynamics to increasing omission rates differs markedly between the two types: IO scenarios exhibit substantially stronger and more abrupt changes in transmission structure and epidemic outcomes, whereas CO scenarios produce more gradual effects. In both scenarios, the magnitude of these effects varies across cities, with a lower-population city (Busan) showing greater tolerance to information loss than the largest city (Seoul), underscoring the importance of regional tailoring in CT strategies. Both IO and CO scenarios also lead to an increase in the transmission network diameter as information loss grows, indicating that a small network diameter reflects effective contact tracing that limits the depth of transmission chains.
Paper Prompts
Sign up for free to create and run prompts on this paper using GPT-5.
Top Community Prompts
Explain it Like I'm 14
What this paper is about
This paper looks at how well contact tracing works during the early days of an epidemic in big cities when some information is missing. Contact tracing is like detective work for diseases: when someone tests positive, health workers figure out where they went and who they met, then warn those people to test and stay home. The authors ask: what happens if we miss some of that information—either we never trace some infected people at all, or we don’t warn some of their contacts?
The questions the researchers asked
The study focuses on simple, practical questions:
- How much missing information can a contact tracing system handle before it stops working well?
- Is it worse to miss entire infected people (and all their contacts) or to miss only some contact events?
- Do these effects change in different cities (for example, a very large city like Seoul versus a smaller city like Busan)?
- What does the “shape” of the infection spread look like when tracing information is missing (for example, are infection chains longer)?
How they studied it
The team built a detailed computer simulation of people living their daily lives in two South Korean cities (Seoul and Busan). Think of it as a virtual city filled with “digital people” who:
- live in households,
- go to school classrooms or workplaces,
- meet friends,
- and bump into others in local community places (like shops or buses).
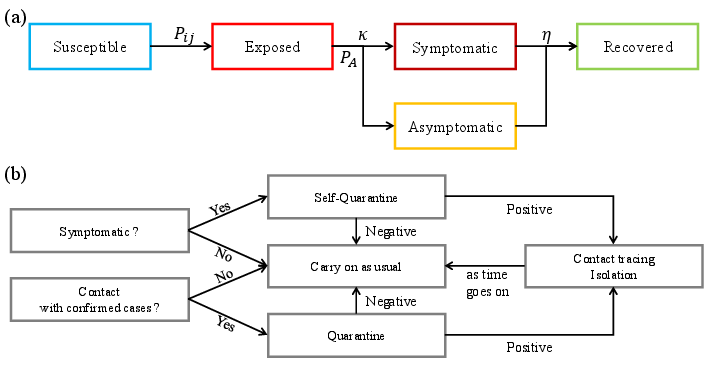
In the simulation, a new disease spreads when people meet. The researchers used a common disease model (SEIR) that puts each person in one of four stages: Susceptible (can catch it), Exposed (infected but not contagious yet), Infectious (can spread it), and Recovered (can’t spread it anymore). They started outbreaks by infecting a small number of people and then ran the model many times to see typical outcomes.
They tested two kinds of missing information in contact tracing:
- Infector-omission (IO): Some infected people get confirmed but their movements are never traced. This is like a detective never getting the case file—no one they met gets warned.
- Contact-omission (CO): The infected person’s movements are known, but some of the people they met never get the warning. They studied two versions:
- Selective CO (SCO): Missing contacts mainly from friend meetups and local community places.
- Uniform CO (UCO): Missing contacts more evenly across households, schools, workplaces, and friends (local community was always hard to trace).
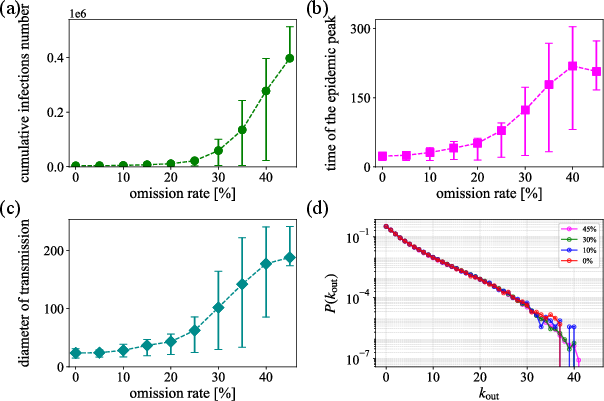
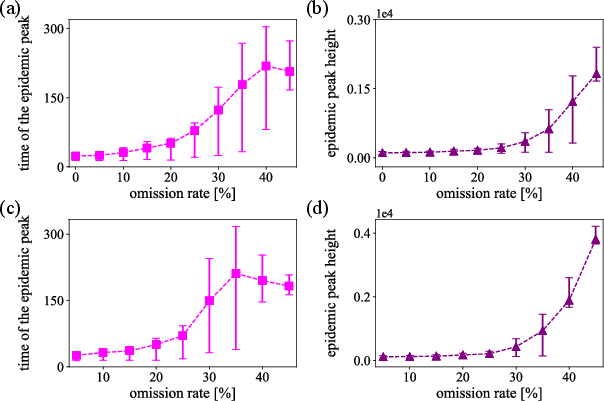
They also looked at the “length” of infection chains (called the network diameter), which is like counting how many “passes” the virus makes from one person to another in the longest chain. Shorter chains mean tracing is cutting the spread early; longer chains mean silent spread is slipping through.
What they found
Here are the main results, in plain terms:
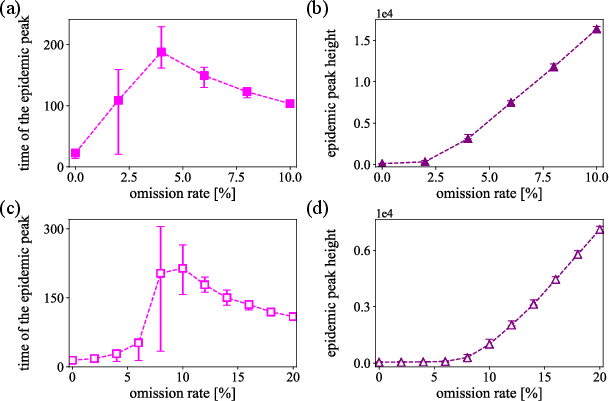
- Missing whole infected people (IO) is much more damaging than missing some contacts (CO). When IO grows, things get bad fast—there’s a sharp tipping point where tracing suddenly stops working well.
- In Seoul (the biggest city), that tipping point happens around 4% IO. In Busan (smaller and older population), the system can tolerate more missing information—around 10% IO—before control is lost. In short: bigger, denser cities are less forgiving.
- When contacts are missed (CO), problems grow more slowly and gradually. It doesn’t “break” the system all at once like IO can, but higher CO still makes outbreaks larger and longer.
- In all types of information loss, infection chains get longer. That means the virus keeps finding new people through deeper chains, which suggests tracing isn’t cutting off spread early enough.
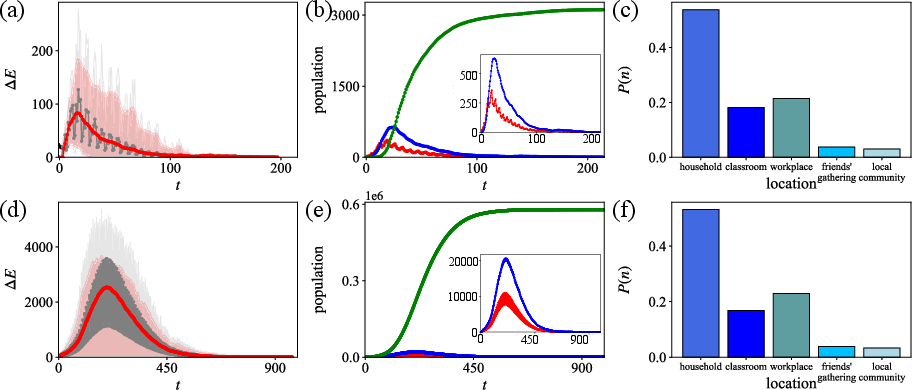
- Most transmission happens in places with longer or closer contact—especially households—then workplaces and classrooms, with friends and community encounters contributing too.
Why this matters:
- The biggest priority in tracing is to make sure every confirmed case’s movements are traced (so their contacts can be found). If you miss that step, you lose entire branches of the infection tree.
- Cities differ: what works in a smaller city may not be enough in a megacity. Local population size and patterns (like commuting) change how much missing data a system can handle.
Why it matters and what it could change
This research gives health teams practical targets:
- Keep “missed infected people” as close to zero as possible—this is the most critical part. Even a small rise can push a city past a tipping point (around 4% in Seoul, about 10% in Busan).
- If resources are limited, focus first on fully tracing confirmed cases’ movements, then work to notify as many contacts as possible.
- Plan city-specific strategies. Large, dense cities need stronger or faster tracing, more staff, or better tech support than smaller cities.
- Watch the “depth” of infection chains. If chains start getting longer, that’s a warning sign that tracing is slipping and outbreaks could become harder to control.
In short, the study shows that contact tracing can still slow early outbreaks even when it isn’t perfect—but missing entire infected people is the most dangerous gap. Building robust, city-tailored tracing systems and prioritizing complete case trajectory tracing can make a big difference in keeping future epidemics under control.
Knowledge Gaps
Knowledge gaps, limitations, and open questions
Below is a concise list of unresolved issues and missing elements that future research could address to strengthen and generalize the paper’s findings.
- Empirical validation: The ABM and CT processes were not validated against real-world contact tracing logs or outbreak investigation data; collecting and fitting to such data is essential to assess realism and accuracy.
- Pathogen-specific calibration: Many epidemiological parameters were arbitrarily assigned or borrowed from COVID-19; calibrate and stress-test results across pathogens with different latent periods, infectiousness profiles, asymptomatic ratios, and serial intervals.
- Sensitivity analysis breadth: Beyond IO/CO rates and initial seeds, conduct systematic sensitivity analyses for key parameters (e.g., self-testing probability, contact probabilities, quarantine/isolation durations, viral shedding variance, contact duration distributions).
- Testing performance and delays: Incorporate test sensitivity/specificity, false negatives/positives, repeat testing strategies, and lab turnaround times; quantify how these affect IO/CO thresholds and containment.
- Tracing and notification delays: Model realistic delays between symptom onset, case confirmation, trajectory reconstruction, contact notification, and quarantine initiation to reflect operational CT timelines.
- Capacity constraints and adaptive operations: Endogenize tracer workforce capacity, backlogs, triage rules, and dynamic prioritization (e.g., households vs. workplaces) to map omission rates to staffing and process speed.
- Simultaneous omission types: Allow IO and CO to occur concurrently and study their interaction and compounding effects on spread and thresholds.
- Local community modeling: Replace the fixed 50% omission and random encounters with venue- and setting-based contacts (e.g., bars, transit, worship, gyms) and setting-specific omission rates; assess sensitivity to high-risk environments and superspreading events.
- Friendship network realism: The homophilic BA network forbids cross-age ties and is confined to 1,000-agent cohorts; test alternative social network models with cross-age connections, multiplexity, and empirically grounded degree distributions.
- School mixing: Classrooms are isolated units without inter-class or school-level interactions; include hallway, cafeteria, extracurricular, and teacher–teacher contacts to capture realistic school transmission.
- Workplace heterogeneity: Workplace size and mixing assumptions are simplified; incorporate sectoral differences (manufacturing vs. office), shift work, and inter-team contacts to evaluate CT impact by industry.
- Behavioral adaptation: Agents do not change behavior in response to rising cases or policies; include time-varying NPIs (masking, distancing), risk avoidance, and fatigue to study their interaction with CT.
- Compliance heterogeneity: Model variable compliance with testing, isolation, and quarantine (by age, occupation, socioeconomic status), and refusal rates; quantify their effects on omission rates and containment thresholds.
- Digital CT integration: Compare manual versus digital tracing (adoption, compliance, privacy constraints) and hybrid strategies; estimate how improving trajectory coverage shifts IO thresholds.
- Importations and inter-city dynamics: No external seeding or inter-city mobility shocks were considered; add importation processes and inter-regional commuting to test robustness of thresholds under continued introductions.
- Reinfection and waning immunity: The model assumes permanent immunity; evaluate scenarios with waning immunity, reinfection risk, and variant immune escape on CT effectiveness.
- Vaccination and variants: Extend to vaccination coverage, vaccine efficacy, and higher-transmissibility variants; examine how these alter network diameter, peak dynamics, and CT resource needs.
- Outcome metrics: Augment outcomes beyond peak and diameter (e.g., age-stratified attack rates, effective reproduction number over time, hospitalization and ICU demand) for public health planning.
- Analytical mechanism of thresholds: Provide a mechanistic or analytical explanation (e.g., percolation/branching process theory) for the observed IO thresholds and their dependence on city size and contact density.
- Mapping to operations: Translate omission rates into operational metrics (cases traced per day, average contacts per case, staff-hours per link) to guide staffing targets and surge capacity planning.
- Equity and heterogeneity: Assess differential CT effectiveness across demographics (e.g., elderly, essential workers), neighborhoods, and socioeconomic strata; identify where omission harms are concentrated.
- Time-of-day and schedule realism: Daily routines are simplified; integrate fine-grained temporal contact patterns (e.g., rush hours, weekends) and assess their impact on tracing delays and network diameter.
- Robustness to model structure: Compare results across alternative ABMs or network constructions to ensure thresholds are not artifacts of specific structural choices (e.g., BA friendship, fixed meeting probability 1/7).
- Policy optimization: Formulate and test resource-constrained optimization (which layers to prioritize, whom to notify first) to minimize epidemic size or diameter under limited CT capacity.
- Data needs: Identify specific empirical datasets required to replace assumptions (layer-specific contact duration distributions by age/setting, compliance rates, CT process times) and enable calibration.
Practical Applications
Practical Applications Derived from the Paper’s Findings and Methods
The following applications translate the paper’s findings, thresholds, and agent-based modeling (ABM) innovations into actionable use cases. Each item notes sector links, potential tools/products/workflows, and key dependencies or assumptions.
Immediate Applications
- CT operations prioritization and QA to minimize infector-omission (IO)
- Sector: Public health, government
- What to do: Set a “maximum IO budget” (e.g., <4% in Seoul-like megacities; <10% in Busan-like cities) and prioritize trajectory reconstruction over exhaustive contact notification; implement audit checks to detect untraced confirmed cases.
- Tools/workflows: QA sampling of case files; IO rate tracker; escalation playbooks.
- Dependencies/assumptions: Thresholds are city- and disease-specific; require basic CT audit data; model used COVID-like parameters.
- Real-time CT KPI dashboard (IO, CO, network diameter) integrated with case management
- Sector: Software, public health informatics
- What to do: Add operational metrics—IO rate, CO rate, and estimated transmission-network diameter—to existing CT systems; define triggers for policy shifts.
- Tools/products: Dashboard plug-ins; automated alerts when IO approaches thresholds; simple chain-depth proxy when full infector-infectee data are unavailable.
- Dependencies/assumptions: Needs line lists and linkage data; network diameter requires infector–infectee pairs or approximations (e.g., cluster depth, serial-interval chains).
- Surge triggers and resource allocation based on IO thresholds
- Sector: Policy, public health
- What to do: When IO exceeds threshold, pivot from manual CT to mass testing, targeted NPIs, or digital augmentation.
- Tools/workflows: Pre-approved trigger matrix tied to IO/diameter; staffing surge plans prioritizing trajectory teams over contact notification teams.
- Dependencies/assumptions: Political will and legal frameworks for rapid policy switching; timely data.
- City-specific CT staffing calculators using the provided ABM
- Sector: Public health, academia
- What to do: Recalibrate the open-source model with local demographics to estimate staff needed to keep IO below the local threshold.
- Tools/products: “CT staffing calculator” derived from the GitHub code; local parameter library.
- Dependencies/assumptions: Local census/mobility inputs; calibration to the circulating pathogen.
- Interview protocol optimization to improve trajectory reconstruction
- Sector: Public health, healthcare systems
- What to do: Standardize high-yield prompts (recent workplaces/schools/households), structured diaries, and consented retrieval of location artifacts (transit passes, payment logs) to reduce IO.
- Tools/products: Case-interview templates; pre-interview SMS forms; checklist apps.
- Dependencies/assumptions: Legal and privacy constraints; cooperation/compliance.
- Enterprise and campus internal tracing to keep organizational IO low
- Sector: Employers, universities
- What to do: Maintain internal exposure logs (badging, seating charts, rosters), rapid notification systems, and protocols to reconstruct trajectories of confirmed employees/students.
- Tools/products: Facility mapping; automated roster/linkage to HR/SIS; in-house CT SOPs.
- Dependencies/assumptions: Data governance; union/worker council agreements; integration with public health guidance.
- Event and venue risk management acknowledging high local-community omissions
- Sector: Events, hospitality
- What to do: Because public-space tracing is hard (modeled 50% omissions), use entry testing, timed ticketing, cohorting, or post-event notifications to compensate.
- Tools/products: Event CT playbooks; QR check-ins; air-quality/ventilation requirements.
- Dependencies/assumptions: Feasibility and public acceptance; costs to organizers.
- Training and drill simulations for CT teams using the released code
- Sector: Academia, public health training
- What to do: Run tabletop exercises and live drills to practice operations under rising IO/CO and to interpret diameter as a performance signal.
- Tools/products: Curriculum modules; scenario packs; CI dashboards.
- Dependencies/assumptions: Staff availability; basic modeling literacy.
- Early-warning signal: monitoring transmission-network diameter
- Sector: Surveillance, policy
- What to do: Track increases in chain depth as an operational KPI of CT effectiveness and as a proxy for prolonged chains that heighten variant risk.
- Tools/products: Cluster-depth analytics in surveillance reports.
- Dependencies/assumptions: Requires cluster linking; alternative proxies may be needed if links are sparse.
- Public communication to raise symptomatic testing and self-quarantine rates
- Sector: Public health communication, daily life
- What to do: Boost voluntary testing/self-isolation (model used 50% self-testing) to shorten infectious periods in the community and lighten CT workloads.
- Tools/products: Targeted messaging; employer sick-leave policies supporting early testing.
- Dependencies/assumptions: Access/cost of tests; paid leave availability.
Long-Term Applications
- National CT planning platform calibrated with live CT logs
- Sector: Government, software
- What to build: A continuously updated ABM platform ingesting real CT operations data to estimate IO/CO, forecast capacity breaches, and optimize staffing.
- Tools/products: Federated data pipelines; privacy-preserving analytics; city-level parameter libraries.
- Dependencies/assumptions: Data-sharing agreements; legal frameworks; sustained funding.
- Privacy-preserving digital trajectory reconstruction (beyond proximity-only apps)
- Sector: Digital health, cybersecurity
- What to build: Consent-based, on-device location proofs and selective disclosure to reconstruct movement paths of confirmed cases without central tracking.
- Tools/products: Secure multi-party computation, verifiable location receipts, personal data vaults.
- Dependencies/assumptions: Smartphone penetration; regulatory acceptance; UX to drive adoption.
- AI-assisted case interviewing and cross-data linking
- Sector: Software, healthcare
- What to build: Assistive tools that reconcile calendars, receipts, transit logs, and badge data (with consent) to auto-suggest likely trajectories and contacts for investigators.
- Tools/products: NLP interview copilots; entity-resolution engines.
- Dependencies/assumptions: Data interoperability; bias and privacy safeguards; human-in-the-loop protocols.
- KPI-driven adaptive policy controllers
- Sector: Policy, governance tech
- What to build: Automated triggers that adjust NPIs, testing cadence, and CT priorities when IO/CO/diameter cross thresholds; public dashboards for transparency.
- Tools/products: Policy automation engines; simulation-in-the-loop controllers.
- Dependencies/assumptions: Clear legal authority; robust monitoring; community trust.
- Cross-city CT strategy generator (SaaS)
- Sector: Software, global health
- What to build: A service that, given demographics and mobility, proposes staffing plans, IO targets, and mitigation bundles tailored to each city.
- Tools/products: Scenario libraries; benchmarking against peer cities.
- Dependencies/assumptions: High-quality local inputs; maintenance across pathogens.
- Integrated epidemic modeling with vaccines, variants, and behavior adaptation
- Sector: Academia, policy modeling
- What to build: Extend the ABM to jointly optimize CT with vaccination rollout, variant properties, and compliance dynamics.
- Tools/products: Modular modeling frameworks; calibration toolchains.
- Dependencies/assumptions: Access to immunization and genomic surveillance data.
- Standardization of “transmission chain depth” as a global KPI
- Sector: Public health standards (e.g., WHO, CDC)
- What to do: Define and promote chain-depth/diameter metrics for routine reporting and inter-jurisdictional comparison.
- Tools/products: Technical guidance; reference implementations.
- Dependencies/assumptions: Consensus on definitions; consistent data capture across systems.
- Insurance and financial risk analytics incorporating IO/CO and chain depth
- Sector: Finance, insurance
- What to build: Pandemic business interruption models that price risk based on local CT capacity (IO/CO) and expected chain depth, informing coverage and reserves.
- Tools/products: City risk indices; portfolio stress tests.
- Dependencies/assumptions: Data availability; regulatory acceptance of novel risk factors.
- Urban and institutional design to reduce transmission depth
- Sector: Urban planning, education, enterprise ops
- What to do: Use model insights to structure cohorts, stagger schedules, and redesign spaces in schools/workplaces to shorten chains (smaller “diameter”).
- Tools/products: Layout and timetable optimizers; cohorting playbooks.
- Dependencies/assumptions: Operational feasibility; labor and regulatory constraints.
- Education and certification in CT analytics
- Sector: Academia, professional training
- What to do: Develop courses that teach ABM-based CT planning, KPI interpretation, and data-privacy-by-design approaches for future outbreaks.
- Tools/products: MOOCs; micro-credentials; case-study repositories.
- Dependencies/assumptions: Institutional partnerships; sustained demand.
Notes on general assumptions and dependencies across applications:
- The paper’s thresholds (e.g., ~4% IO in Seoul, ~10% IO in Busan) are illustrative, based on COVID-like parameters and synthetic populations; they must be recalibrated to the pathogen and city at hand.
- The model assumes no reinfection, fixed behavior, and limited delays; real-world performance will vary with vaccination, variants, and behavior changes.
- Accurate computation of IO/CO and network diameter requires high-quality CT data and, in some cases, legal permission for data linkage.
- Local-community contact tracing is intrinsically noisy; compensatory measures (environmental controls, testing) remain important.
Glossary
- Accept–reject scheme: A Monte Carlo method that accepts or rejects random samples to simulate probabilistic events. "we apply a Monte Carlo sampling procedure based on an acceptâreject scheme."
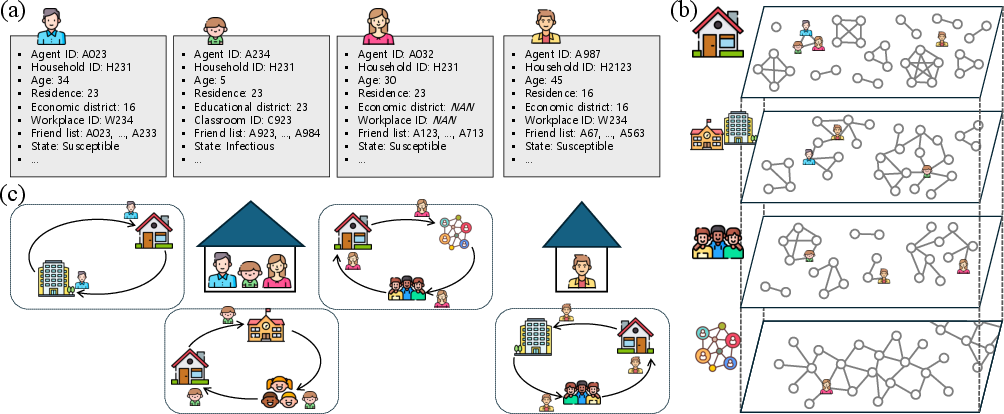
- Agent-based model (ABM): A simulation framework that models individual agents and their interactions to capture heterogeneous dynamics. "We developed a high-resolution agent-based model (ABM) to evaluate how such information loss affects CT effectiveness by simulating the spread of emerging infectious diseases across metropolitan areas in South Korea."
- Administrative 2 (ADM-2) level regions: Second-tier administrative divisions used to define spatial structure in the model. "The spatial structure of the model reflects the administrative 2 (ADM-2) level regions."
- Barabasi-Albert (BA) model: A scale-free network model built via preferential attachment, used here to generate friendship links. "A friendship network is generated using a homophilic Barabasi-Albert (BA) model~\cite{lee2019homophily, barabasi1999emergence} that preferentially connects agents of similar age, reflecting the cultural importance of age in Korean social relationships."
- Case reproduction number: The number of secondary infections caused by a single infected individual. "This distribution corresponds to the case reproduction number in epidemics, which is defined as the number of secondary infections generated by a single infected individual."
- Compartmental models: Epidemiological models that partition populations into compartments (e.g., S, E, I, R) and track flows between them. "the ABM is preferable to traditional compartmental models due to its ability to incorporate individual-level heterogeneity"
- Contact-omission (CO): Failure to notify or act on specific contact events during tracing, leaving potential transmission links unaddressed. "CO corresponds to the omission of specific contact events (edges), in which infected individuals are identified but some of their transmission links fail to be detected or notified."
- Directed transmission network: A graph with directed edges from infectors to infectees representing transmission pathways. "this individual-level resolution allows our ABM to explicitly reconstruct the directed transmission network."
- Exposed period: The latent time between exposure and becoming infectious. "The exposed period () is drawn from a gamma distribution $f(\kappa;\alpha,\theta)=\frac{1}{\Gamma(\alpha)\theta^{\alpha}\kappa^{\alpha-1}e^{-\kappa/\theta}$ (shape = 1.926, scale = 1.775) for each agent~\cite{he2020temporal}."
- Force of infection: The per-contact rate or intensity at which susceptible individuals become infected. "Here, represents the force of infection associated with a single contact, and is the contact duration..."
- Gamma distribution: A continuous probability distribution used to model durations like latency and shedding. "Viral shedding follows a gamma distribution with a mean of 3.067 and a standard deviation of 2.109~\cite{he2020temporal}."
- Homophily parameter: A parameter controlling the tendency of links to form between similar individuals (e.g., same age group). "with a homophily parameter leading the increased probability of same-age-group links."
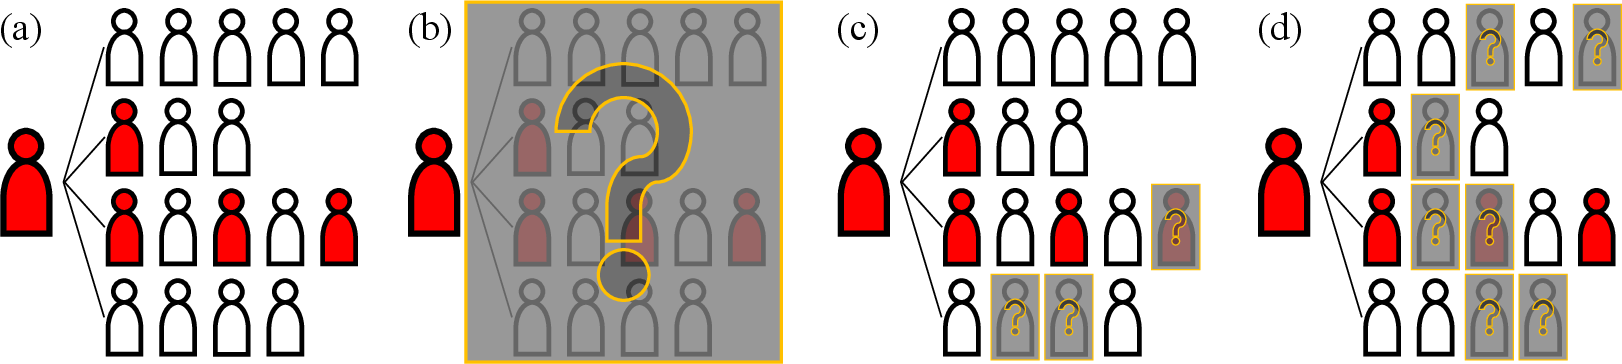
- Infector-omission (IO): Missing the trajectory tracing of a confirmed case, causing all their contacts to remain unidentified. "An infector-omission (IO) scenario occurs when a confirmed case tests positive but their movement trajectory is not traced at all (Figure~\ref{fig:omission}(b))."
- Iterative proportional updating algorithm: A reweighting method to scale sample data to match population marginals. "We project the 2\% census of Seoul (145,817 records) to the entire population of Seoul (9,529,266 agents) using an iterative proportional updating algorithm~\cite{ye2009methodology, chae2023evaluation}."
- Monte Carlo sampling procedure: Randomized computational sampling used to simulate probabilistic infection events. "To implement this transmission mechanism, we apply a Monte Carlo sampling procedure based on an acceptâreject scheme."
- Multilayer social networks: Network structures with multiple interaction layers (households, workplaces, schools, etc.). "The model incorporates multilayer social networks~\cite{Kivela2014} to capture heterogeneous interpersonal interactions across different social contexts."
- Non-pharmaceutical interventions (NPIs): Public health measures (e.g., distancing, closures, tracing) that do not involve drugs or vaccines. "governments are compelled to rely on a broad arsenal of non-pharmaceutical interventions (NPIs) to mitigate transmission"
- Out-degree distribution: The distribution of outgoing edges per node in the transmission network, reflecting secondary cases per infector. "Figure~\ref{fig:tor_result}(d) shows the out-degree distribution of the directed transmission network (plotted in the semi-log scale with the log-scale vertical axis)."
- Preferential attachment: A mechanism where new nodes are more likely to connect to already well-connected nodes. "New agents form preferential attachments to existing ones, with a homophily parameter ..."
- Relative infectiousness: An individual-level multiplier adjusting baseline infectiousness. "Relative infectiousness () varies across agents, such that some agents exhibit higher or lower overall infectiousness levels."
- Selective contact-omission (SCO): Missing contacts specifically in certain layers (friends and local community). "A selective contact-omission (SCO) scenario occurs when omissions take place only in the friend meeting and local community networks (Figure~\ref{fig:omission}(c))."
- SEIR model: A compartmental model with Susceptible, Exposed, Infectious, and Recovered states. "We model disease progression using an extended susceptible-exposed-infectious-recovered (SEIR) model described in Figure~\ref{fig:seir}(a)."
- Stochastic: Involving randomness in model dynamics or parameter realization. "Using a stochastic agent-based model with sociodemographics from metropolitan areas in South Korea..."
- Synthetic population: An artificial dataset constructed to match real-world demographic and social characteristics. "We have created a synthetic population reflecting the sociodemographic characteristics of Seoul's (Busan's) individuals..."
- Transmission network diameter: The length of the longest infection chain in the transmission network. "Both IO and CO scenarios also lead to an increase in the transmission network diameter as information loss grows..."
- Uniform contact-omission (UCO): Missing contacts uniformly across multiple social layers at similar rates. "A uniform contact-omission (UCO) scenario occurs when omission rates are applied equally across all social networks except the local community network (Figure~\ref{fig:omission}(d))."
- Viral shedding: The release of virus from an infected person, affecting infectiousness over time. "Viral shedding follows a gamma distribution with a mean of 3.067 and a standard deviation of 2.109~\cite{he2020temporal}."
Collections
Sign up for free to add this paper to one or more collections.