MultiVis-Agent: A Multi-Agent Framework with Logic Rules for Reliable and Comprehensive Cross-Modal Data Visualization
Abstract: Real-world visualization tasks involve complex, multi-modal requirements that extend beyond simple text-to-chart generation, requiring reference images, code examples, and iterative refinement. Current systems exhibit fundamental limitations: single-modality input, one-shot generation, and rigid workflows. While LLM-based approaches show potential for these complex requirements, they introduce reliability challenges including catastrophic failures and infinite loop susceptibility. To address this gap, we propose MultiVis-Agent, a logic rule-enhanced multi-agent framework for reliable multi-modal and multi-scenario visualization generation. Our approach introduces a four-layer logic rule framework that provides mathematical guarantees for system reliability while maintaining flexibility. Unlike traditional rule-based systems, our logic rules are mathematical constraints that guide LLM reasoning rather than replacing it. We formalize the MultiVis task spanning four scenarios from basic generation to iterative refinement, and develop MultiVis-Bench, a benchmark with over 1,000 cases for multi-modal visualization evaluation. Extensive experiments demonstrate that our approach achieves 75.63% visualization score on challenging tasks, significantly outperforming baselines (57.54-62.79%), with task completion rates of 99.58% and code execution success rates of 94.56% (vs. 74.48% and 65.10% without logic rules), successfully addressing both complexity and reliability challenges in automated visualization generation.

Paper Prompts
Sign up for free to create and run prompts on this paper using GPT-5.
Top Community Prompts
Explain it Like I'm 14
Overview: What this paper is about
This paper introduces MultiVis-Agent, a smart AI system that can turn different kinds of inputs—like text, pictures of charts, example code, and even existing chart code—into working, good-looking data visualizations. It’s designed for real-world use where people often need to tweak charts step by step, not just get a one-shot result. The big idea is to combine the creativity of AI with strict “logic rules” that act like guardrails, so the system stays reliable, avoids getting stuck in loops, and doesn’t crash.
Key questions the paper asks
- How can we build an AI system that understands many types of inputs (text, images, code) for making charts?
- How can it safely improve charts over several rounds of feedback without breaking?
- Can we add clear rules so the system has mathematical guarantees it will stop, recover from errors, and run safely?
- How do we fairly test such a system across different real-world situations?
How the researchers approached the problem
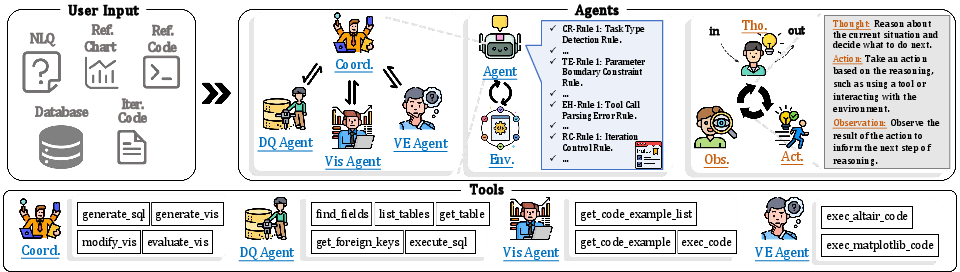
A team of smart helpers (agents)
Think of MultiVis-Agent like a team with a coach:
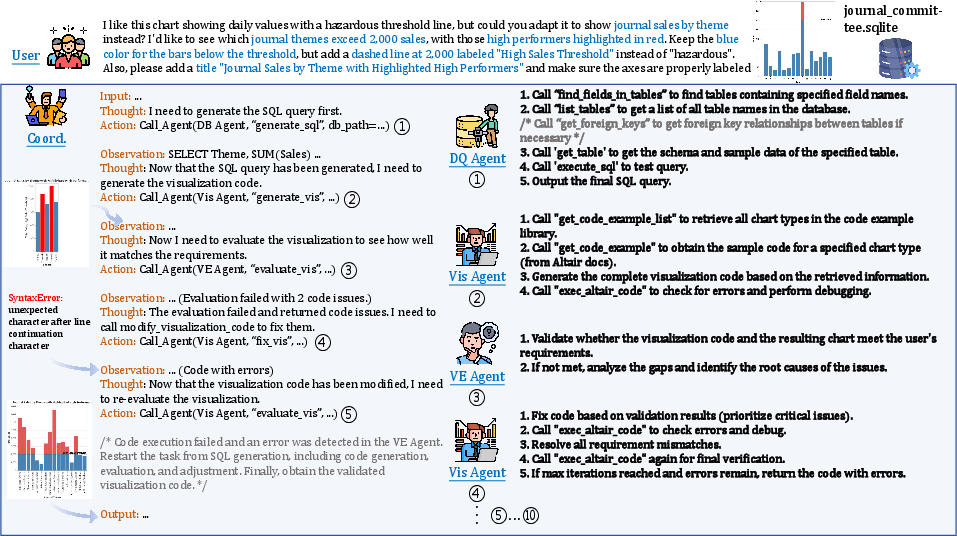
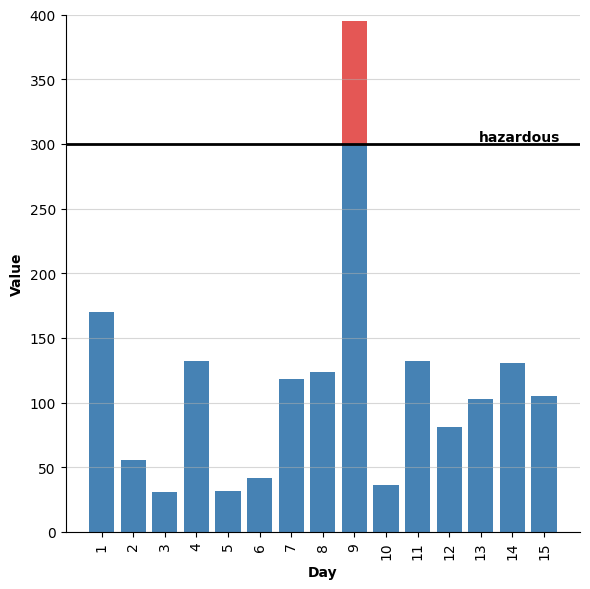
- The Coordinator Agent is the coach. It looks at the task and decides who should do what.
- The Database Query Agent is the data expert. It finds the right data by writing SQL (the language for databases).
- The Visualization Implementation Agent is the code writer. It creates or edits chart code (in Python using Altair).
- The Validation and Evaluation Agent is the checker. It runs the code and evaluates whether the chart matches the request and looks clear.
These agents talk and work in cycles: get data → write chart code → check it → refine it. This setup helps the system handle complex requests and fix mistakes step by step.
The four logic rules: guardrails that keep things safe
To avoid common AI failures (like endless loops, bad parameters, or brittle workflows), the system follows four layers of rules. You can think of them like the rules of a game that keep play fair and safe:
- Task classification: The coach decides exactly what kind of task it is.
- Basic text request
- Text + reference image
- Text + reference code
- Edit existing chart code
- Parameter limits: Tools only run with safe inputs (like keeping numbers within allowed ranges).
- Error recovery: When something goes wrong (a code error or bad input), the system identifies the type of error and follows a plan to fix it.
- Loop termination: There’s a strict stop rule (a maximum number of attempts), so the system won’t get stuck repeating forever.
These rules don’t replace the AI’s thinking. Instead, they set boundaries so the AI stays dependable while still being flexible.
The MultiVis-Bench test set
To fairly test the system, the authors built a new benchmark called MultiVis-Bench with 1,202 examples. It covers four realistic scenarios and uses real databases and executable Python chart code. This makes testing end-to-end: the system must produce code that actually runs and makes the right chart.
Here are the four scenarios they test:
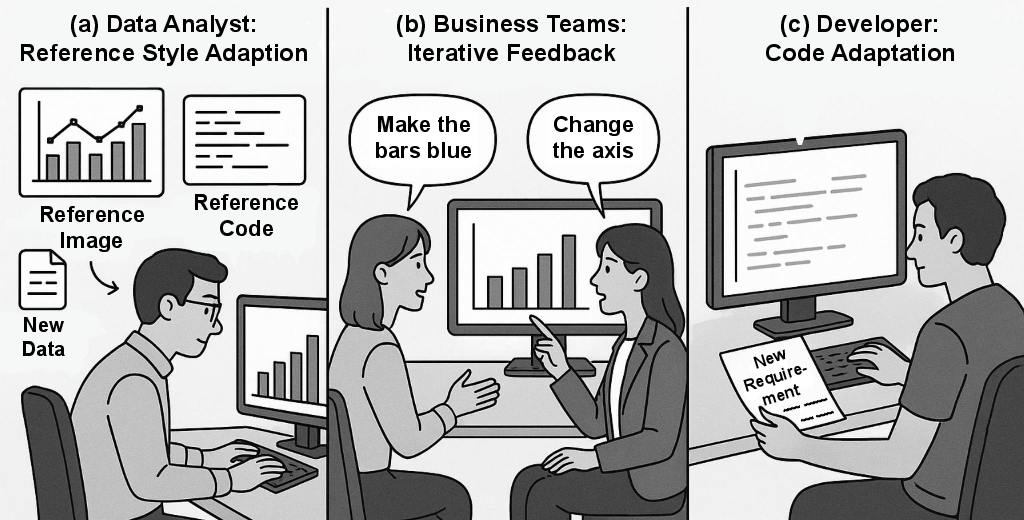
- Basic Generation: Make a chart from text + data.
- Image-Referenced Generation: Make a chart that matches a style shown in a picture.
- Code-Referenced Generation: Adapt a chart using example code as a guide.
- Iterative Refinement: Improve an existing chart based on feedback (like “rotate labels” or “add a title”).
Main findings: What worked and why it’s important
The system did much better than other methods, especially on tougher tasks:
- Chart quality scores were higher: about 75.63% in challenging image-guided tasks versus 57.54–62.79% for baselines.
- It almost always finished the job: 99.58% task completion with the logic rules, compared to 74.48% without them.
- Its code ran successfully most of the time: 94.56% execution success, compared to 65.10% without the rules.
In short, adding the four logic rule layers made the system both smarter and safer. It could handle multi-modal inputs and refine charts over several steps, while avoiding common AI pitfalls like crashes or infinite loops.
Why it matters and what could come next
Many people—from students to data analysts—need charts that look good, match a specific style, and are easy to adjust. MultiVis-Agent shows that you can combine AI’s creativity with strict safety rules to make a reliable assistant for real-world visualization work.
Potential impacts:
- Better tools for data analysis that understand multiple input types (text, images, example code).
- Smarter chart editors that safely refine visualizations over time.
- A foundation for reliable, rule-guided AI systems in other areas where consistency and safety matter (like coding assistants, data cleaning, or report generation).
Future steps could include supporting more chart libraries, handling even richer inputs (like interactive dashboards), and expanding the benchmark to cover more domains and styles.
Knowledge Gaps
Knowledge gaps, limitations, and open questions
Below is a consolidated list of what remains missing, uncertain, or unexplored in the paper, phrased to be concrete and actionable for future research.
- Metric transparency: The paper reports a “visualization score” and task completion/execution success, but does not define the scoring rubric, measurement procedure, annotator protocol, inter-rater reliability, or the extent of automated versus human judgments. Future work should specify metric definitions, validation, and quality control.
- Image-to-style fidelity evaluation: While Image-Referenced Generation (IRG) is a core scenario, there is no quantitative method described for assessing style/layout/color fidelity to the reference image (e.g., structural similarity, palette matching, typography/alignment metrics). A standardized fidelity metric and benchmark annotations would strengthen claims.
- Vision modality details: The system’s mechanism for interpreting reference images (model choice, feature extraction pipeline, vision-language fusion strategy) is not described. Clarify the vision backbone, pre/post-processing, and how visual cues are encoded to guide code generation.
- Code-reference translation specifics: For Code-Referenced Generation (CRG), cross-library translation strategies (e.g., Matplotlib → Altair) are not formalized beyond LLM-driven adaptation. Provide explicit mapping patterns, semantic equivalence checks, and tests across diverse libraries (Altair, Matplotlib, Vega-Lite, Plotly).
- Output modality limitation: MultiVis-Bench outputs only executable Altair Python code. It remains unknown how well the framework generalizes to other visualization grammars and runtimes (Matplotlib, Vega-Lite, ggplot, D3/Observable). Extending outputs and evaluating cross-library generalization is needed.
- Dataset representativeness and scale: MultiVis-Bench has 1,202 examples and draws schemas from Spider, with 109 IRG cases and 233 CRG cases. Assess whether the dataset size and domain diversity sufficiently capture real-world complexity (messy schemas, heterogeneous data types, temporal/geospatial, high cardinality). Expand coverage and report domain distributions and difficulty strata.
- Real-world, human-in-the-loop validation: Iterative Refinement (IR) uses expert-crafted modification instructions; no live user study evaluates usability, iteration quality, satisfaction, or time-to-task metrics. Conduct controlled and field studies with analysts and developers.
- Ambiguity handling in NLQ: The paper acknowledges ambiguous queries but does not detail disambiguation strategies (e.g., clarification questions, schema-aware suggestions). Formalize and evaluate an ambiguity resolution protocol.
- Conflict resolution in multi-modal inputs: The deterministic priority ordering (D ≻ C ≻ B ≻ A) may ignore useful lower-priority cues or lead to suboptimal fusion when inputs conflict. Investigate multi-source fusion policies, conflict detection, and weighted integration that leverage all modalities.
- Error taxonomy completeness: EH rules assume a fixed set of error types (parameter, execution, parse, timeout), but real systems face more heterogeneity (e.g., data encoding issues, dependency/version mismatches, environment permissions, GPU/CPU resource limits). Extend taxonomy, recovery strategies, and empirical coverage.
- Termination bound rationale: The global iteration cap T_max = 10 is asserted but not justified or adapted to task complexity. Study the sensitivity of performance and reliability to T_max, and design adaptive termination policies that consider task difficulty and evaluation feedback.
- Formal guarantees assumptions: Proof sketches rely on bounded processing times, finite error sets, and reliable validation predicates; these are not formally verified or mechanized. Provide rigorous assumptions, formal models of LLM outputs, and, where feasible, mechanized proofs or runtime monitors to ensure guarantees hold.
- Enforcement mechanisms: RC/CR/TE/EH rules assume robust enforcement over LLM outputs (e.g., response format validation, prerequisite checks). Detail the exact parsers, validators, execution sandboxes, and how rule violations trigger overrides, including failure modes when LLMs deviate from expected formats.
- Security and sandboxing: Code execution “standardization” is mentioned, but the paper does not describe sandboxing, resource limits, I/O restrictions, dependency management, or injection defenses for SQL/code. Document security model and conduct penetration tests.
- Scalability and latency: The system’s throughput, end-to-end latency, and resource footprint (model calls, tool invocations, evaluation cycles) are not reported. Benchmark performance under load, and explore optimization (caching, tool selection policies, partial compilation, streaming).
- Database complexity coverage: The DQ agent tools are described, but there is no quantitative analysis of SQL complexity (joins, nested queries, window functions) or success on challenging schema features (weakly structured text fields, many-to-many relationships, schema drift). Add SQL difficulty tiers and report success per tier.
- Handling large and non-relational data: The approach focuses on SQLite relational tables. Extensions to big data backends (e.g., warehouses), non-relational sources (JSON, Parquet), and streaming/interactive data are unexplored. Evaluate scalability beyond local SQLite.
- Advanced visualization features: Support for interactivity, dashboards/multi-view compositions, tooltips, filters, linked brushing, theming, and accessibility (colorblind-safe palettes, font sizes) is not assessed. Expand benchmarks and metrics to cover interaction and accessibility.
- Cross-lingual generalization: All scenarios appear in English. Assess performance on NLQ and code comments across languages, including multilingual databases and locale-specific formats.
- Reproducibility of model dependencies: The system uses “Gemini-2.0-pro-exp” for dataset construction and unspecified LLM(s) at runtime. Report exact model versions, configurations, temperature/decoding settings, seeds, and costs; provide baselines with open models.
- Baseline fairness and transparency: The “LLM Workflow” and “Instructing LLM” baselines are not fully specified (architectures, prompt templates, iteration policies, tool access). Provide detailed baselines, ablation studies, and ensure identical external conditions where possible.
- Failure analysis: The paper reports aggregate gains but lacks qualitative analyses of failure modes (e.g., misinterpreted styles, incorrect encodings, schema misalignment). Include error case studies and actionable insights for improvement.
- Rule design and maintenance cost: The four-layer logic rules likely require manual specification, tuning, and updates. Quantify the engineering overhead, rule conflicts, and portability to other tasks; investigate automated rule induction/refinement.
- Model selection criteria: RC-Rule 3 depends on a compatibility function κ for choosing models based on content and URLs, but κ is undefined. Specify selection criteria, decision boundaries, and empirical gains from adaptive model routing.
- Integration with BI ecosystems: Real-world adoption often requires integration with existing tools (Tableau, Power BI, Superset) and workflows (versioning, collaboration). Explore connectors, export formats, and user interfaces for production deployment.
- Ethics and bias in visualization: Perceptual effectiveness is mentioned, but fairness/ethics (e.g., misleading encodings, bias amplification, deceptive scales) are not evaluated. Define ethical guidelines and audit procedures for generated charts.
- Licensing and dataset accessibility: Clarify licensing of curated images/code snippets, database redistribution rights, and potential legal constraints; provide dataset cards and documentation for responsible use.
Practical Applications
Immediate Applications
Below are practical, deployable-now use cases that leverage the paper’s methods, logic-rule framework, and benchmark. Each item includes sectors, potential tools/workflows, and feasibility notes.
- Notebook/IDE visualization copilot for analysts and developers
- Sectors: software, finance, healthcare, education, research
- Tools/workflows: JupyterLab/VS Code extension that implements MultiVis-Agent to:
- Generate Altair code from NLQ and database
- Adapt code from reference snippets (CRG)
- Refine existing code via iterative prompts (IR)
- Apply styles inferred from a reference chart image (IRG)
- Assumptions/dependencies: Python runtime with Altair, sandboxed code execution, DB connector (e.g., SQLite/Postgres), access to a multimodal LLM, network policies for model access
- Slack/Teams data-viz assistant for ad hoc analytics in secure environments
- Sectors: finance, healthcare, enterprise IT, operations
- Tools/workflows: Chat interface backed by the Coordinator + Database/Vis/Validation agents; trusted logic rules prevent infinite loops and unsafe parameters; exports reproducible code for audit
- Assumptions/dependencies: Secure LLM access (on-prem or VPC), role-based DB access, containerized sandbox for code execution, logging for audit
- CI/CD “visualization code checker” for data apps and reports
- Sectors: software, journalism, research, publishing
- Tools/workflows: GitHub Action/GitLab CI job that uses the Validation/Evaluation Agent to execute Altair code, catch parameter boundary violations, and enforce style/metadata checks (axes labels, legends, error-free execution)
- Assumptions/dependencies: Headless execution environment, deterministic rendering (seeded), rule configuration for acceptable recommendations
- Code migration assistant between plotting libraries (e.g., Matplotlib → Altair)
- Sectors: software, education, research
- Tools/workflows: CRG scenario to translate reference code patterns and adapt to a new dataset, emitting idiomatic Altair code with Validation Agent pass/fail gating
- Assumptions/dependencies: Adequate examples/templates for both libraries, coverage of library-specific features, test datasets to validate parity
- Automated dataset documentation with example charts
- Sectors: data platforms, open-data portals, enterprise analytics
- Tools/workflows: Scheduled process that scans new tables, suggests useful chart types (BG), and generates executable examples with consistent visual style (via reference image/code)
- Assumptions/dependencies: Data profiling, schema access, style templates or brand guidelines, storage for code + rendered images
- Classroom tooling for teaching visualization and grading assignments
- Sectors: education
- Tools/workflows: Instructor provides target chart/code; students submit code; system uses Iterative Refinement + Validation Agent to provide structured feedback and auto-grade for correctness/faithfulness
- Assumptions/dependencies: Rubrics encoded as validation checks, controlled compute to run student code safely, LMS integration
- Newsroom chart assistant for rapid, reliable visualizations
- Sectors: media/publishing
- Tools/workflows: IRG to match house styles from reference images; CRG to adapt canonical code snippets to new datasets; Validation Agent to prevent execution failures on deadline
- Assumptions/dependencies: Style galleries, editorial constraints encoded as rules, sandboxed execution
- Internal reporting standardization and brand compliance
- Sectors: finance, retail, manufacturing
- Tools/workflows: Reference style images/code as canonical sources; agents generate/refine reports to match standards; logic rules guarantee termination and parameter safety in batch production
- Assumptions/dependencies: Approved templates, centralized data connections, governance over model prompts/artifacts
- Self-service analytics for domain users with auditability
- Sectors: public sector, healthcare, regulated industries
- Tools/workflows: Natural-language-to-chart with reproducible code artifacts; EH/RC logic rules ensure recoverable errors and finite iterations; all steps logged for compliance
- Assumptions/dependencies: PHI/PII-safe deployment (on-prem where required), prompt/response logging with redaction, policy-aligned LLM usage
- Data observability and KPI watchboards
- Sectors: SaaS, energy, logistics
- Tools/workflows: Generate standard time-series and categorical breakdown charts from schemas (BG), iterate to add annotations/thresholds (IR), and validate visual encodings before publishing to dashboards
- Assumptions/dependencies: Metric store/data warehouse connectivity, scheduled job runner, visualization export pipeline
- Benchmark-driven model evaluation and training
- Sectors: academia, ML/AI tooling companies
- Tools/workflows: Use MultiVis-Bench to evaluate LLM agents across BG/IRG/CRG/IR; fine-tune agents or prompt strategies; compare with and without logic rules
- Assumptions/dependencies: Access to the benchmark, reproducible evaluation harness, consistent scoring/visualization metrics
Long-Term Applications
These applications are promising but require further research, scaling, integration work, or expanded capabilities beyond the paper’s current scope.
- Native integration into mainstream BI tools with cross-modal assistance
- Sectors: software/BI (Tableau, Power BI, Looker)
- Tools/workflows: In-product agent to interpret reference images/code and iteratively refine visuals; code-to-spec translation to BI-native grammars
- Assumptions/dependencies: Vendor APIs for programmatic chart creation, secure LLM plugins, semantics mapping across BI grammars, governance approvals
- Cross-language visualization translation at scale (Python ↔ R ↔ JavaScript)
- Sectors: software, research, education
- Tools/workflows: Extend CRG to support ggplot2, plotly.js, Vega-Lite; validation via cross-runtime equivalence tests and perceptual checks
- Assumptions/dependencies: Large parallel corpora of cross-lib examples, robust equivalence criteria, multi-runtime sandboxes
- Brand and accessibility-aware style transfer with automatic WCAG compliance
- Sectors: public sector, enterprise reporting, education
- Tools/workflows: IRG + validation rules expanded to check color contrast, font sizes, alt text, annotations; auto-suggest accessible color palettes and encodings
- Assumptions/dependencies: Formalizing accessibility checks for charts, richer validation metrics, curated accessible style libraries
- Real-time, streaming visualization agents with reliability guarantees
- Sectors: energy, finance, IoT/operations
- Tools/workflows: Continuous data ingestion with dynamic chart updates; error handling and termination rules adapted for streaming; stateful refinement
- Assumptions/dependencies: Low-latency data pipelines, incremental rendering, robust backpressure and retry strategies
- Autonomous analytics co-pilot that spans data retrieval, modeling, and visualization
- Sectors: enterprise analytics, SMBs, consulting
- Tools/workflows: Extend Database Agent to feature engineering and basic statistical modeling; Vis Agent composes multi-chart dashboards; Validation Agent checks statistical assumptions and visual integrity
- Assumptions/dependencies: Expanded toolset, domain-specific guardrails, statistical validation logic, human-in-the-loop review for decisions
- Regulatory-grade reporting with end-to-end audit trails
- Sectors: finance (Basel/IFRS), healthcare (quality reporting), government
- Tools/workflows: Formal provenance of inputs, decisions, iterations; logic-rule policies codified as organizational controls; reproducible builds of reports with code artifacts
- Assumptions/dependencies: Policy alignment, third-party audit acceptance, red-teaming against prompt injection and data leakage
- Multi-agent “VisOps” platform for governance and lifecycle management
- Sectors: enterprise software, data platforms
- Tools/workflows: Versioning of prompts, logic rules, datasets, and charts; automated tests with MultiVis-Bench; promotion gates (dev → staging → prod) for visualizations
- Assumptions/dependencies: Platform engineering investment, standardized metadata schemas, cross-team adoption
- Interactive report/slide generation with conversational refinement
- Sectors: consulting, marketing, education
- Tools/workflows: Compose multi-slide narratives with charts, iteratively refined via dialogue; style transfer from a brand deck; export to PPT/HTML with embedded, executable code
- Assumptions/dependencies: Robust layout engines, template translation, narrative coherence checks
- Privacy-preserving, on-device/multi-tenant deployments
- Sectors: healthcare, defense, high-security enterprises
- Tools/workflows: Distilled or local LLMs with multimodal capability; logic rules enforced within air-gapped environments; GPU-scarce optimization
- Assumptions/dependencies: Capable local models, efficient multimodal parsing (image/code) on-prem, secure sandboxes, hardware constraints
- Advanced chart QA for scientific integrity and error prevention
- Sectors: academia, pharma, scientific publishing
- Tools/workflows: Validation Agent extended to detect misleading encodings (truncated axes, inappropriate aggregations), effect-size annotations, and preregistered analysis checks
- Assumptions/dependencies: Domain-specific validation rules, curated best-practice corpora, metadata-rich datasets
Notes on Feasibility and Dependencies (common across applications)
- Model capabilities: High-quality, multimodal LLMs are needed to interpret images and code references; reliability depends on model latency/cost and access policies.
- Execution sandboxing: Safe, deterministic code execution with network/filesystem restrictions is critical to realize parameter safety and error recovery in production.
- Data connectors and governance: Secure, audited access to databases; role-based controls and PII/PHI handling for regulated sectors.
- Library coverage: The current system targets Altair and Matplotlib; broader adoption requires more libraries/grammars and domain-specific templates.
- Rule tuning and monitoring: Logic rules may need domain tuning (e.g., acceptable parameter ranges, termination thresholds). Observability is needed to catch edge cases and measure drift.
- IP and compliance: Using reference images/code implies licensing and attribution considerations; organizational policies must allow LLM-mediated tooling.
- Benchmark representativeness: MultiVis-Bench enables rigorous evaluation but should be complemented with domain datasets (e.g., clinical, financial) for transferability.
Glossary
- Altair: A declarative statistical visualization library for Python built on Vega-Lite that produces interactive charts. "Adapt this matplotlib code using Altair and current data"
- Basic Generation (BG): The scenario where a system generates visualization code directly from a natural-language request and a database, without external references. "Scenario A (BG, Basic Generation)"
- Black: A Python code formatter that enforces a consistent code style automatically. "code formatting standardization using tools like Black"
- Catastrophic failures: Severe system breakdowns that can lead to unrecoverable errors or endless error cycles. "catastrophic failures with infinite error loops"
- Code-Referenced Generation (CRG): A scenario where provided reference code guides the structure and style of the generated visualization. "Scenario C (CRG, Code-Referenced Generation)"
- Coordinator Agent: The central controller that orchestrates specialized agents and enforces rule-guided decisions across the workflow. "a Coordinator Agent dynamically orchestrates specialized agents"
- Coordination logic rules (CR): System-level rules that govern task classification, tool prerequisites, and decision logic. "Coordination logic rules (CR): System-Level Decision Making."
- Cross-library translation: Translating visualization logic and style between different plotting libraries. "Current approaches struggle with cross-library translation and semantic code understanding."
- Cross-modal: Involving understanding or mapping between different input modalities (e.g., text, images, code). "introducing cross-modal understanding challenges."
- Deterministic task classification: A rule-based, unambiguous mapping from inputs to a specific scenario type. "deterministic task classification"
- Dialogue state tracking: Maintaining and using conversation context and prior code to apply precise user-requested modifications. "requiring dialogue state tracking and precise modification."
- Error Handling logic rules (EH): Rules that classify errors and select targeted recovery strategies to ensure robustness. "Error Handling logic rules (EH): Systematic Error Recovery."
- Gemini-2.0-pro-exp: The specific LLM used to assist in generating and refining dataset examples. "LLM (Gemini-2.0-pro-exp) prompted with database schemas"
- Graceful degradation: The system’s ability to reduce functionality safely rather than fail catastrophically under error conditions. "enable graceful degradation under error conditions"
- Graceful failure: Failing in a controlled way that avoids crashes and allows recovery or fallback. "graceful failure"
- Guaranteed loop termination: A formal assurance that iterative processes will stop within bounded steps. "guaranteed loop termination"
- Image-Referenced Generation (IRG): A scenario where a reference image guides the style, layout, or chart type of the generated visualization. "Scenario B (IRG, Image-Referenced Generation)"
- Infinite loop susceptibility: The risk that a system may enter a non-terminating cycle during processing. "infinite loop susceptibility"
- Iterative Refinement (IR): A scenario where existing visualization code is modified based on feedback through multiple iterations. "Scenario D (IR, Iterative Refinement)"
- LLM: A generative AI model trained on large corpora, used here for reasoning, planning, and code generation. "LLM-based approaches"
- Matplotlib: A widely used Python plotting library for creating static, animated, and interactive visualizations. "101 Matplotlib reference code snippets"
- Multi-Agent Framework: A system design where multiple specialized agents collaborate under coordination to solve complex tasks. "a logic rule-enhanced multi-agent framework"
- Multi-modal: Handling multiple input modalities (e.g., text, database, images, code) simultaneously. "multi-modal inputs (images, code)"
- MultiVis: The paper’s comprehensive task formulation that unifies multiple visualization generation and refinement scenarios. "We formalize the MultiVis task"
- MultiVis-Agent: The proposed logic rule-enhanced multi-agent system for reliable multi-modal visualization generation. "we propose MultiVis-Agent, a logic rule-enhanced multi-agent framework"
- MultiVis-Bench: The benchmark dataset introduced to evaluate systems across all MultiVis scenarios with executable outputs. "develop MultiVis-Bench, a benchmark"
- Natural Language Query (NLQ): A user request expressed in natural language used to drive data retrieval and visualization generation. "a natural language query (NLQ)"
- One-shot generation: Single-pass generation without iterative refinement or feedback loops. "one-shot generation"
- Parameter Boundary Constraint: A rule ensuring tool parameters remain within valid ranges and domains before execution. "TE-Rule 1: Parameter Boundary Constraint."
- ReAct: An agent prompting paradigm that alternates reasoning and acting with observations to guide tool use. "ReAct Control logic rules (RC)"
- ReAct Control logic rules (RC): The rule layer that manages iteration control, response validation, and model selection. "ReAct Control logic rules (RC): Iteration Management."
- Spider benchmark: A dataset of complex databases and NL-to-SQL tasks used here to source diverse databases. "selected from the Spider benchmark"
- SQLite: A lightweight embedded relational database engine used to store the benchmark’s tables. "141 complex SQLite databases"
- Systematic error recovery: Structured processes for detecting, classifying, and correcting errors during execution. "systematic error recovery"
- Termination predicate: A logical condition that determines when an iterative process must stop. "Define termination predicate"
- Text-to-Visualization (Text-to-Vis): Mapping natural-language descriptions to visualization code or specifications. "Text-to-Visualization (Text-to-Vis) paradigm"
- Thought-Observation-Action: An agent reasoning loop where the agent thinks, acts (via tools), then observes outcomes. "follows a reasoning cycle (Thought-Observation-Action)"
- Tool Execution logic rules (TE): Rules ensuring parameter safety and a standardized execution environment for running code. "Tool Execution logic rules (TE): Parameter Safety and Environment Control."
- Vega-Lite: A high-level grammar of interactive graphics that underpins libraries like Altair. "Vega-Lite"
- Visual Query Language (VQL): A formal language for specifying visualizations as structured queries used by several benchmarks. "VQL"
- Visualization Implementation Agent: The specialized agent that generates and modifies executable visualization code. "Visualization Implementation Agent."
Collections
Sign up for free to add this paper to one or more collections.