A Multi-Dimensional, Per-Pass Empirical Study of the LLVM Optimization Pipeline
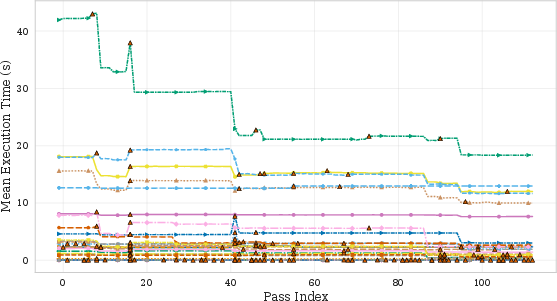
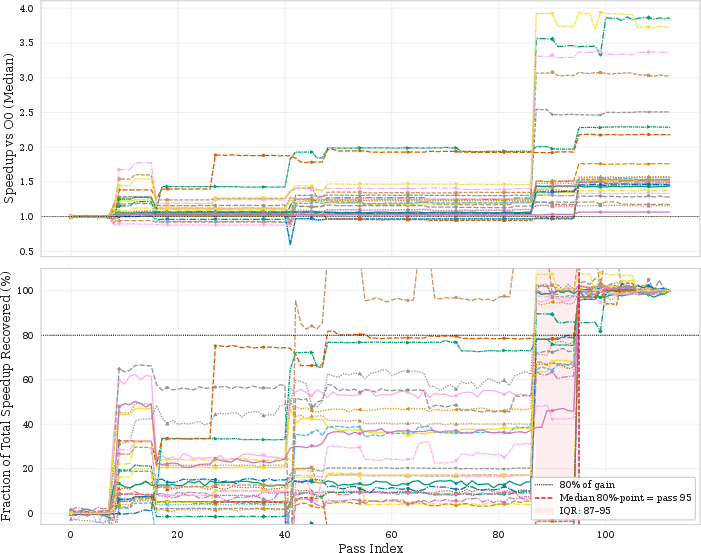
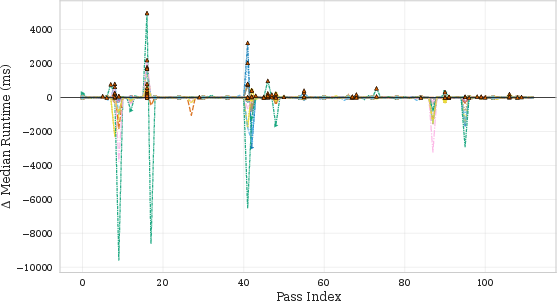
Abstract: Quantifying the marginal impact of individual optimization passes underpins phase ordering, pass selection, optimization design, and analysis of pass/hardware interactions. In LLVM -- the standard backend for C/C++, Rust, and ML stacks via MLIR -- interactions among optimization passes, measurement noise, and pipeline scale make this difficult. We present a systematic, empirical study of the LLVM -O3 optimization pipeline. We decompose the pipeline into cumulative per-pass prefixes. We then measure execution time, compile time, binary size, hardware counters, and RAPL energy across 84,750 measurements covering 113 cumulative prefixes of the -O3 pipeline evaluated on 30 PolyBench/C kernels under rigorous noise mitigation. On these compute-bound affine kernels, the pipeline is non-monotone (6.6-9.7% of transitions regress) and strongly back-loaded (the median non-regressing kernel needs 84.8% of the pipeline for 80% of its speedup). Most gains are driven by a small Pareto-dominant core of passes, while the final -O3 configuration is Pareto-dominated on (size, speedup) for 29 of 30 kernels. We further show that IR instruction count is an unreliable predictor of runtime, that runtime-targeted passes are de facto energy-targeted (30-60% savings), and that the search-free idealized-additive upper bound on losses due to phase interference is 46.35%. These findings enable more informed pass pruning, cost-model calibration, and autotuning.

Paper Prompts
Sign up for free to create and run prompts on this paper using GPT-5.
Top Community Prompts
Explain it Like I'm 14
What is this paper about?
This paper looks at how a popular compiler, called LLVM, speeds up programs. LLVM has a preset “-O3” plan made of many small steps (called passes) that try to make your code run faster. The authors ask a simple question: what does each individual step actually do? They measure how each step changes program speed, the time it takes to compile, the size of the final program, how the computer’s hardware behaves, and how much energy is used.
Think of it like an assembly line for code: the paper watches what happens after each station, not just the final product.
What questions did the researchers ask?
The researchers focused on four easy-to-understand questions:
- How much does each single optimization step help (or hurt) performance?
- Do some steps make code faster but also make compiling slower or the program bigger?
- How do these steps change what’s happening inside the CPU (like cache misses or instructions per cycle)?
- How much performance is lost because steps get in each other’s way (they “interfere”)?
How did they study it?
They built a tool that takes the long -O3 sequence of steps and cuts it into “prefixes.” A prefix is “do the first step,” then “do the first two steps,” then “do the first three,” and so on until all steps are done. After each prefix, they re-measured the same program to see exactly what the newly added step changed.
To make the test fair and reliable, they:
- Used 30 small, math-heavy programs (from a suite called PolyBench) that are common in scientific and machine-learning code.
- Tested 113 prefixes (that’s how many step positions there are in the -O3 pipeline).
- Collected 84,750 measurements in total, including speed, compile time, program size, CPU hardware counters (like cache misses), and energy use (using a built-in power meter called RAPL).
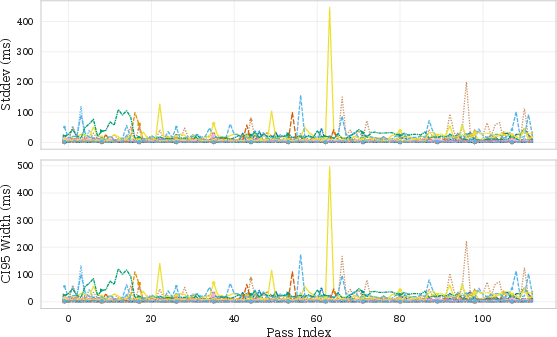
- Repeated runs many times and locked the tests to a single CPU core to reduce noise, so tiny differences wouldn’t trick them.
In everyday terms: they paused the assembly line after each station, weighed and timed the product, checked the “factory sensors,” and repeated that many times to be sure.
What did they find?
Here are the main takeaways, explained simply.
- Some steps make things worse before they get better.
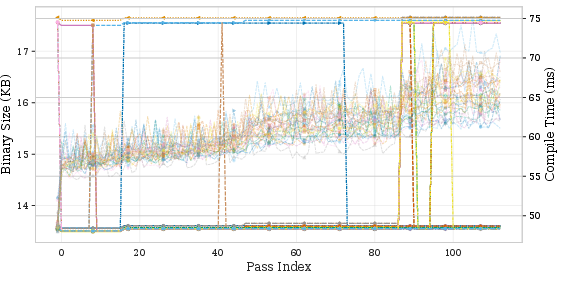
- About 7–10% of step-to-step changes actually slow the program down instead of speeding it up. That means the pipeline is non-monotone: it doesn’t just steadily improve.
- Most of the big wins happen late in the pipeline.
- To reach 80% of the final speedup, the median program needed about 85% of all steps. In other words, a lot of the best gains are back-loaded near the end, not at the start.
- A small group of steps does most of the work.
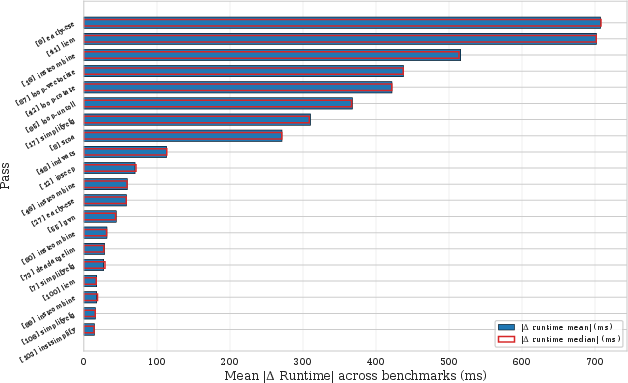
- A few “heavy hitters” (like common subexpression elimination, loop-invariant code motion, loop vectorization, loop unrolling, and instruction combining) produce most of the gains. Many other steps have little visible effect on their own.
- The final “-O3” result is not always the best trade-off.
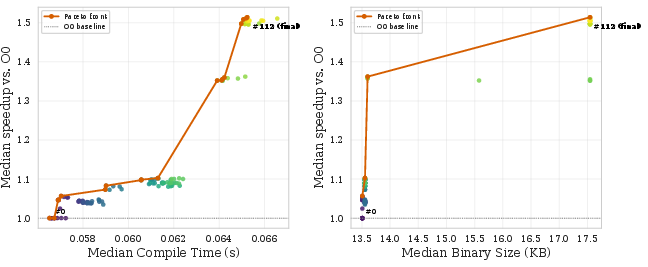
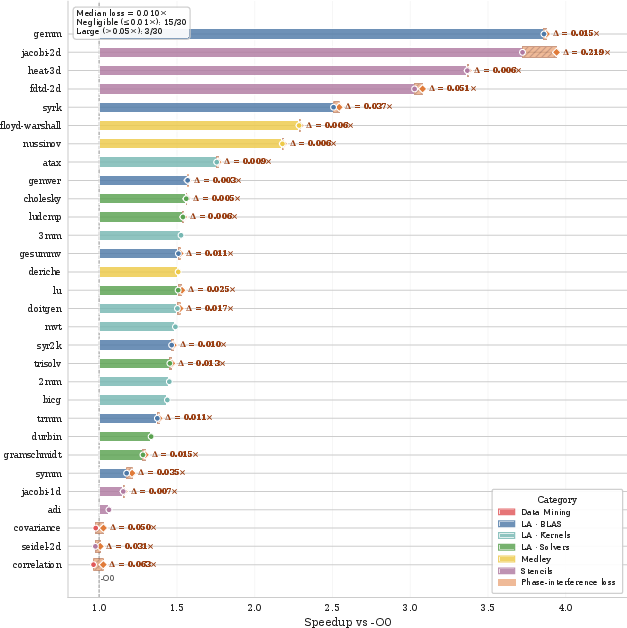
- For 29 out of 30 programs, an earlier checkpoint in the pipeline produced a program that was at least as fast (and often faster) while also being no bigger. That means the usual final setting can be “Pareto-dominated”: there exists a better earlier point for size and speed together.
- Program size and speed don’t move together in simple ways.
- Steps that make code faster sometimes also make it bigger (for example, unrolling loops copies code to do more work per loop, which can make the program larger). Early steps often shrink code; late steps can grow it.
- Counting instructions in the code is a poor shortcut for guessing speed.
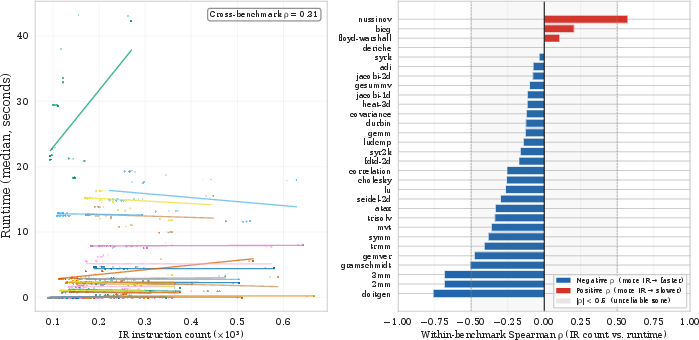
- The number of instructions in the compiler’s middle form (IR) does not reliably predict real runtime. Sometimes having more IR instructions still results in faster execution after optimization.
- How the CPU behaves explains the speedups.
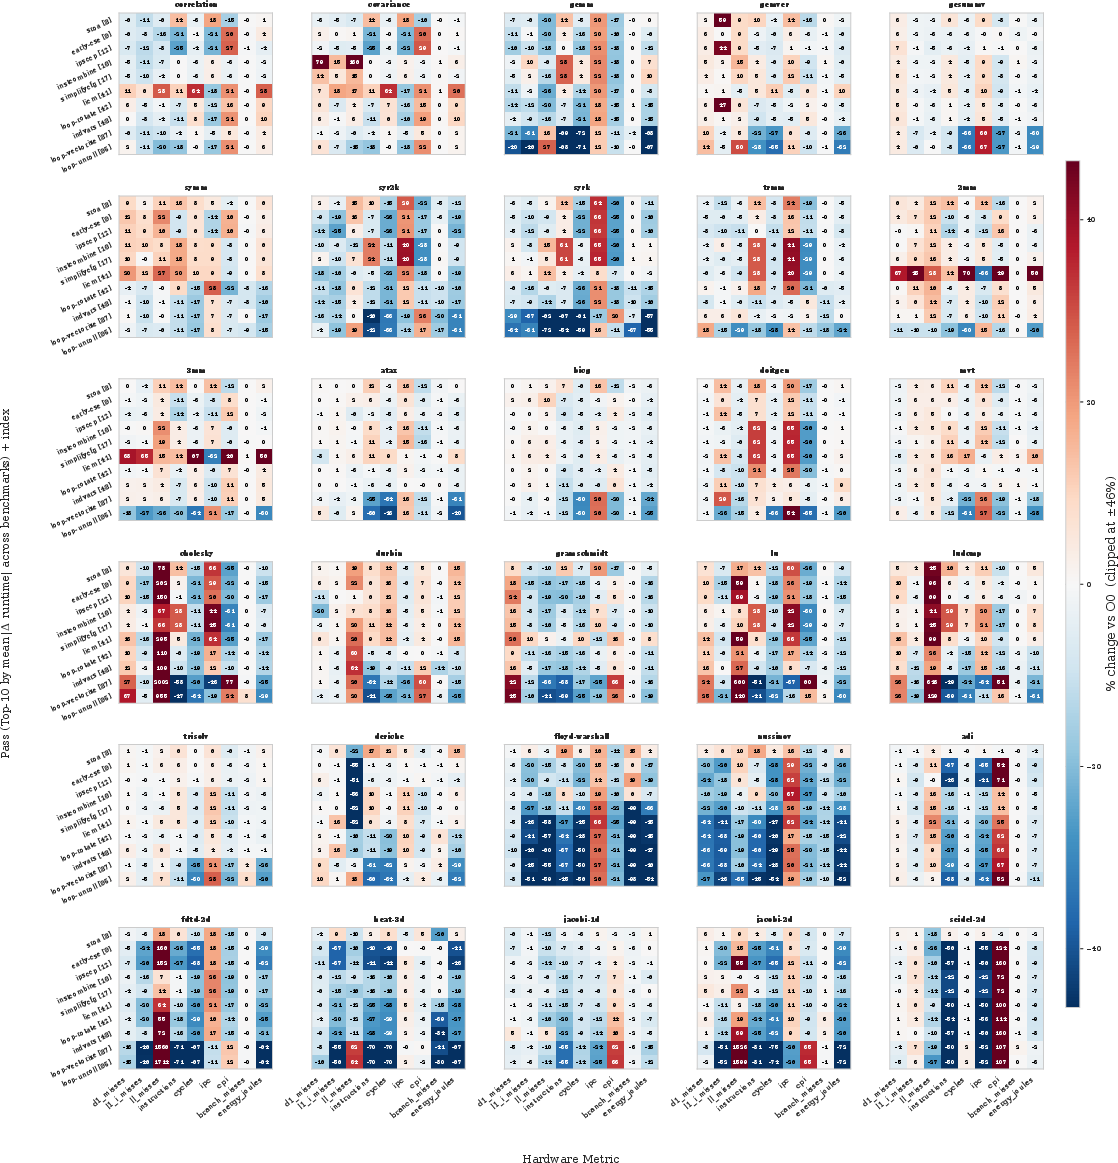
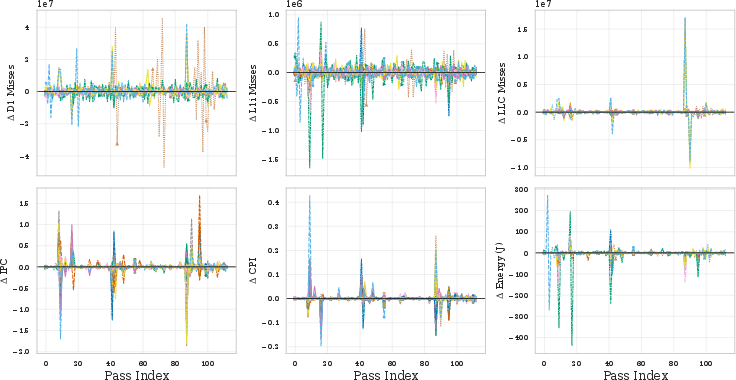
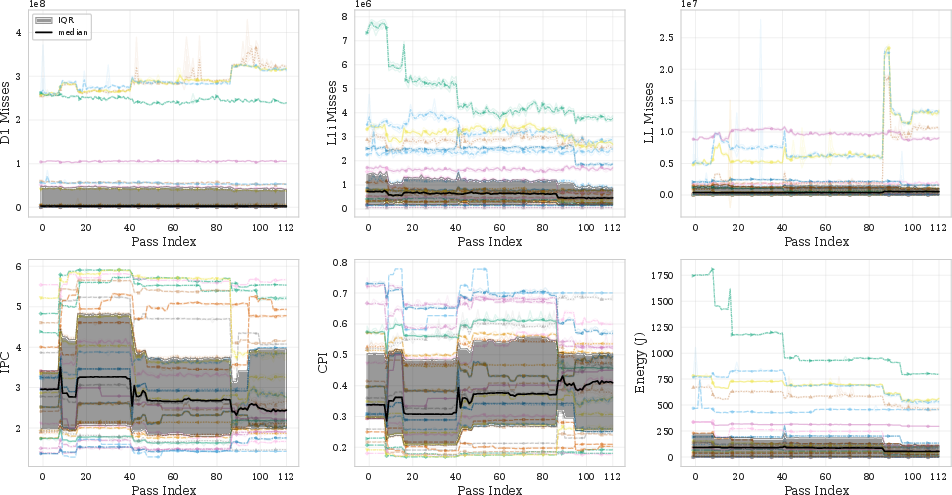
- Big wins come mostly from doing fewer total instructions and fewer CPU cycles overall, not from each instruction going faster. In fact, “instructions per cycle” (IPC) often goes down after vectorization, because you do fewer, heavier operations at once.
- Energy use drops a lot when runtime drops. For these compute-heavy programs, speed-focused steps also saved about 30–60% energy.
- Steps can interfere with each other a lot.
- If you imagine a “perfect world” where every good step’s benefit adds up without being undone by later steps, the authors estimate up to about 46% of potential speedup is lost to interference (on average). That’s an upper bound, not something you can fully get back, but it shows interference matters.
Why does this matter?
This work gives practical guidance to people who build and use compilers:
- Smarter stopping points: Since many programs have a better earlier checkpoint than the final -O3, compilers could stop at the “best-so-far” point to avoid late slowdowns or code bloat, improving speed and size together.
- Focus on the few powerful steps: Because a small set of passes delivers most benefits, tuning efforts can prioritize those, saving time and avoiding unnecessary work.
- Better models and tools: Don’t rely on simple counts (like IR instruction count) to predict speed. Use richer signals (like CPU cycles or cache behavior) to guide decisions or machine-learning autotuners.
- Energy co-benefits: For compute-heavy code, making programs faster often also saves a lot of energy. That’s good for battery life and data center costs.
- Guarding risky steps: Some late steps (like aggressive unrolling) can bloat code or increase last-level cache misses for certain algorithms. Compilers could use simple checks (e.g., about data working sets) to decide when to apply them.
In short, the paper shows exactly which optimization steps matter most, how they interact, and where the -O3 pipeline can be improved. This helps compiler engineers build faster, smaller, and more energy-efficient programs—and helps users get better performance without having to be experts in compiler internals.
Knowledge Gaps
Unresolved gaps, limitations, and open questions
Below is a concise list of what remains missing, uncertain, or left unexplored, distilled to guide follow-on research and engineering:
- Generalizability beyond PolyBench/C:
- Validate results on irregular, pointer-heavy, branchy code (e.g., SPEC CPU, MultiSource, MiBench), real-world applications, and multi-translation-unit builds.
- Assess memory-bound and cache-unfriendly workloads where DRAM traffic dominates; the paper focuses on compute-bound affine kernels.
- Examine multi-threaded programs and parallel runtime interactions, which are excluded by the single-threaded design.
- Pipeline and compiler scope:
- Replicate the study for -O1/-O2/-Os/-Oz/-Ofast, LTO/ThinLTO, and PGO to test whether non-monotonicity, back-loaded gains, and Pareto dominance persist.
- Include code-generation (machine-level) passes (instruction selection, register allocation, scheduling, peephole, branch shortening) to capture end-to-end effects beyond IR-level transformations.
- Compare the new vs. legacy LLVM pass managers and different pass-scheduling heuristics for stability of pass impacts.
- Hardware and platform coverage:
- Reproduce on diverse microarchitectures (AMD Zen, ARM Neoverse/Apple M-series, older Intel, AVX2 vs. AVX-512 availability) to test ISA- and cache-hierarchy-specific effects (e.g., LLC inflation on dense solvers).
- Study heterogeneous cores (E-cores vs. P-cores) and OS schedulers to quantify sensitivity to core type and interference.
- Evaluate portability across OSes and kernel versions (Linux distributions, macOS, Windows).
- Energy measurement completeness:
- Incorporate DRAM and uncore domains (and, where applicable, GPU/accelerator power) to assess full-system energy; package-only RAPL misses off-die energy and can mislead on memory-bound cases.
- Calibrate and validate RAPL on the test platform (Alder Lake) across power states and thermal regimes; quantify error bars versus external power meters.
- Dataset scaling and working-set effects:
- Vary dataset sizes to push working sets beyond LLC and to L3/DRAM to observe when vectorization/unrolling regresses due to capacity/associativity limits.
- Characterize sensitivity of phase interference and Pareto dominance to problem size and data layout (AoS vs. SoA, alignment, padding).
- Microarchitectural visibility:
- Extend counter coverage to front-end (uop cache, I-TLB), memory (L2/DTLB/loads-stores, MLP), and backend (port pressure, stall cycles, bad speculation) to pinpoint root causes of pass-induced regressions.
- Avoid counter multiplexing and document event scheduling; report raw-to-derived metric mappings and potential aliasing on the tested CPU.
- Causality of regressions:
- Perform root-cause analyses for the identified regression bands (e.g., around passes 41–42, 87, 95): which cost model decisions or transformations (vector width, unroll factor, inlining sites) trigger working-set expansion or pipeline throughput loss?
- Correlate IR-level changes (loop structure, vector types, memory-access strides) with counter deltas to derive actionable cost-model fixes.
- Beyond “idealized-additive” phase-interference bound:
- Quantify the practically recoverable fraction of the 46.35% upper bound via concrete techniques (limited reorderings, selective pass disabling, parameter tuning) rather than an additive ceiling.
- Compare “search-free” guards versus light-weight search (beam search, local swaps) to estimate marginal gains per unit compile-time overhead.
- Disentangle losses due to order interference vs. parameter mis-specification (e.g., unroll factors) to prioritize remedies.
- Adaptive pipeline control:
- Design, implement, and evaluate a “stop-at-best” policy inside LLVM that halts at a trajectory-best checkpoint without runtime probes (e.g., using compile-time proxies or counters); quantify compile-time overheads and risk of premature stopping.
- Develop and test “do-not-run p_i on IR signature X” guards: define signatures, build detectors (rules or learned models), measure false positives/negatives, and impact on speed/size/energy across benchmarks.
- Explore online/feedback-driven strategies that use fast signals (instructions, cycles, simple counters) to adapt pipeline progression per TU/function.
- Stability of pass-impact rankings:
- Test cross-version stability (LLVM 12→22+) and across targets/flags to identify robust “load-bearing” passes versus version-/target-specific ones.
- Aggregate per-occurrence rankings into pass-family or transformation-class rankings to see whether dominance persists after collapsing repeats.
- Better performance proxies:
- Since IR instruction count is unreliable, develop and validate alternative cheap proxies (hybrid static features, early codegen estimates, selected counters) that predict runtime and energy reliably across prefixes.
- Evaluate ML-based cost models using the paper’s multi-metric per-pass data as supervision; test generalization to unseen code and architectures.
- Coverage of compile-time impacts:
- Break down compile-time per pass and per pass-group (e.g., vectorization, inlining) to guide tuning of -O levels for build systems; quantify memory (RSS) and peak allocations of compilation steps.
- Include link-time costs (lld) and whole-program analysis costs (LTO/IPO) to reflect real build pipelines.
- Translation-unit and interprocedural scope:
- Examine multi-TU projects and cross-module IPO to understand effects of cgscc passes (inlining, devirtualization) that are underrepresented in single-TU PolyBench.
- Measure how module-level transformations interact with later loop/func passes in larger call graphs.
- Parameter sensitivity of key passes:
- Systematically vary vector widths, unroll factors, inlining thresholds, and alias-analysis choices to map performance/size/energy response surfaces and identify robust settings per workload class.
- Evaluate whether learned or analytic parameter tuning can mitigate the LLC regressions in dense solvers without sacrificing speedups elsewhere.
- MLIR and domain transfer:
- Directly test MLIR-generated kernels and end-to-end ML compiler stacks (e.g., TVM, OpenXLA) to validate the hypothesized transfer from PolyBench-like kernels.
- Quantify how upstream MLIR transformations constrain or amplify LLVM pass effects (e.g., tiling/fusion before LLVM).
- Threats to validity requiring replication:
- Re-run with ASLR enabled and realistic system noise to bound practical reproducibility outside laboratory conditions.
- Validate that pipeline “flattening” preserves semantics and ordering equivalence in the presence of nested managers and repeated pass invocations.
- Tooling and data reproducibility:
- Provide per-benchmark, per-pass IR snapshots and transformation diffs to aid causal debugging and downstream ML training.
- Package scripts to regenerate results across LLVM versions/architectures and to plug in new benchmarks with different datasets.
Practical Applications
Immediate Applications
The following applications can be adopted with current LLVM/MLIR toolchains and standard performance tooling, leveraging the paper’s measurements, pass rankings, and the provided pipeline-decomposition infrastructure.
- Stop-at-trajectory-best compilation flag for -O3
- What: Add a compiler option that stops the pipeline at the best observed checkpoint for a target/kernel to avoid late-pipeline regressions and binary bloat (29/30 kernels had an earlier Pareto-superior point).
- Sectors: software/devtools, embedded, mobile, automotive, HPC.
- Tools/workflow: integrate “checkpoint sweeps” around known high-impact passes (e.g., ~87 loop-vectorize, ~95 loop-unroll) into clang/MLIR drivers; cache per-function best checkpoints.
- Assumptions/dependencies: profiling harness; reproducible builds; results most robust for compute-bound, affine kernels on LLVM 21.x.
- CI/CD performance regression bisecting at pass granularity
- What: Use the per-pass prefix method to localize performance regressions to specific LLVM pass positions when updating toolchains or code.
- Sectors: software, finance (low-latency), HPC, cloud services.
- Tools/workflow: GitHub Action/CI job running llvm-passview-like sweeps on hotspots; store historical pass-level baselines.
- Assumptions/dependencies: stable hardware; perf permissions; pinned cores; deterministic microbench code paths.
- Energy-aware -O3 profiles for compute-bound kernels
- What: Offer an -O3-energy preset that prioritizes passes with demonstrated 30–60% energy gains (e.g., vectorization/unrolling) for numerical kernels.
- Sectors: data centers, edge ML inference, mobile, scientific computing.
- Tools/workflow: policy-based pass subsets; pre-vetted “energy-positive” pass bundles.
- Assumptions/dependencies: RAPL (or equivalent) visibility; compute-bound regime; excludes DRAM/GPU energy.
- MLIR/TVM/OpenXLA pass gating with LLC-capacity predicates
- What: Gate loop-vectorize/unroll behind working-set/LLC-capacity checks to prevent LLC miss explosions on dense triangular solvers (lu/ludcmp/cholesky).
- Sectors: ML compilers, HPC, robotics (real-time control).
- Tools/workflow: lightweight working-set estimator + hardware cache model; target-agnostic MLIR pass options.
- Assumptions/dependencies: estimated/block-level footprint accuracy; target cache hierarchy available.
- Cost-model calibration: de-emphasize IR-instruction count
- What: Update compiler and autotuner cost models to avoid using IR instruction count as a runtime proxy; replace with counters like cycles/instructions and miss rates.
- Sectors: compiler vendors, ML compilers, autotuning platforms.
- Tools/workflow: integrate perf/PMU-based features; retrain ML models; refine analytical heuristics.
- Assumptions/dependencies: access to PMU counters; per-target calibration; consistent methodologies.
- Autotuning with pass-impact priors
- What: Use the Pareto-dominant pass set (early-cse, licm, instcombine, loop-vectorize, loop-rotate, loop-unroll, simplifycfg, sroa, indvars) as priors to shrink search spaces in iterative compilation/Bayesian optimization.
- Sectors: HPC, ML deployment, embedded DSP stacks.
- Tools/workflow: seed search with high-payoff passes and positions; early stopping when gains plateau.
- Assumptions/dependencies: LLVM version alignment; workload similarity; measurement noise control.
- Performance debugging via “do-not-run p_i on IR signature X” guards
- What: Introduce pass guards conditioned on IR patterns tied to known regressions (e.g., skip specific LICM/rotate combos for certain loop forms).
- Sectors: safety-critical (automotive), finance, telecom.
- Tools/workflow: IR pattern library; configurable pass pipelines; guard logs for auditability.
- Assumptions/dependencies: robust pattern matching; regression catalogs; revalidation for side effects.
- Library and kernel maintainers’ profile-guided checkpoint selection
- What: Ship libraries (e.g., BLAS/stencil kernels) compiled at a pipeline checkpoint that maximizes speedup without enlarging binaries.
- Sectors: scientific libraries, mobile SDKs, embedded firmware.
- Tools/workflow: per-kernel checkpoint discovery and distribution; fat-binary or per-target artifacts.
- Assumptions/dependencies: ABI compatibility; multi-variant packaging overhead.
- IDE/compiler plugin for pass-level transparency
- What: Provide per-function pass-impact summaries (runtime/size/energy) to guide optimization pragmas and code refactors.
- Sectors: software engineering, education.
- Tools/workflow: VSCode/CLion plugin consuming passview data; inline hints and diffs.
- Assumptions/dependencies: debug info mapping IR to source; developer time budgets.
- Data-center build profiles balancing compile time vs speedup
- What: Use the L-shaped compile-time vs speedup frontier to cap -O3 pass budgets in large builds (opt is <50% of total compile time).
- Sectors: cloud, SaaS, large-scale monorepos.
- Tools/workflow: policy that clips after diminishing returns; per-binary budgets.
- Assumptions/dependencies: empirical calibration; no critical throughput regressions.
- Educational lab kits for compilers courses
- What: Adopt the released infrastructure to teach pass ordering/selection, phase interference, and multi-metric trade-offs.
- Sectors: academia.
- Tools/workflow: containerized labs; preconfigured passes/benchmarks; reproducibility rubrics.
- Assumptions/dependencies: supported hardware or simulation of counters.
- Vendor–architecture feedback loop
- What: Use hardware-counter signatures to inform pass scheduling defaults per microarchitecture (e.g., Alder Lake vs Zen).
- Sectors: semiconductor, toolchain vendors.
- Tools/workflow: per-target regression dashboards; downstream patchsets.
- Assumptions/dependencies: cross-arch measurement; validation suites beyond PolyBench.
Long-Term Applications
These opportunities require additional research, cross-ecosystem adoption, or broader validation beyond PolyBench and the tested hardware.
- Adaptive, counter-driven pass scheduling (online or PGO)
- What: Build ML/RL systems that monitor counters during compilation or PGO and adapt pass order/selection to minimize phase-interference loss (~46% additive upper bound).
- Sectors: browsers/JITs, finance, robotics (adaptive control code).
- Dependencies: low-overhead instrumentation; safety guards; robust exploration strategies.
- -O3-smart pipelines with automatic early stopping and pass guards
- What: Integrate “trajectory-best” stopping and IR-pattern-based guards into production compilers to self-avoid known late-pipeline regressions.
- Sectors: software/toolchains, mobile stores.
- Dependencies: longitudinal evidence across diverse suites (SPEC, irregular code); governance for default behavior changes.
- Cross-domain generalization and new pass bundles for memory-bound/irregular code
- What: Extend the study to pointer-heavy, multi-threaded, and memory-bound workloads; derive alternative Pareto cores and energy co-benefits.
- Sectors: databases, networking, OS kernels, embedded.
- Dependencies: DRAM/uncore energy visibility; thread-aware counters; representative benchmarks.
- MLIR-level working-set models and capacity-aware lowering
- What: Incorporate first-class working-set estimators into MLIR to gate loop transforms before LLVM lowering, using tensor-shape and tiling metadata.
- Sectors: ML frameworks, autonomous systems.
- Dependencies: accurate shape inference; target cache models; interplay with fusion/tiling passes.
- Unified performance–energy certification for compiled artifacts
- What: Establish policies and badges for “energy-conscious compilation” with standardized pass-level reporting in software procurement/governance.
- Sectors: public sector IT, sustainability reporting, enterprise.
- Dependencies: standard metrics across platforms; independent verification; toolchain vendor support.
- Pass-telemetry standard for autotuners and research platforms
- What: Standardize per-pass deltas and counter traces as artifacts consumable by CompilerGym/AutoPhase/AutoTVM to accelerate learning.
- Sectors: academia, autotuner vendors.
- Dependencies: schema governance; privacy/security controls for telemetry.
- Co-design with CPU vendors for architecture-aware defaults
- What: Collaborate to craft microarchitecture-specific pass schedules that reflect observed counter signatures (IPC, LLC, L1-I trends).
- Sectors: semiconductor, hyperscalers.
- Dependencies: NDA data sharing; continuous integration benchmarks; backport pathways.
- JIT-time micro-profiling for pass selection in heterogeneous systems
- What: On-device short-run profiling to choose pass subsets for target cores (big.LITTLE, edge SoCs) balancing size, speed, and energy.
- Sectors: mobile, IoT, AR/VR.
- Dependencies: JIT overhead budgets; sandboxed PMU access; caching compiled variants.
- Build-system orchestration of compile-time budgets via frontiers
- What: Cluster schedulers allocate optimization budgets across services based on frontier curves to maximize organization-wide ROI.
- Sectors: large-scale CI/CD, HPC centers.
- Dependencies: organization-wide metrics collection; policy integration; developer buy-in.
- Curriculum and visualization platforms for pass-interaction literacy
- What: Interactive tools to visualize non-monotonic trajectories, phase interference, and multi-metric trade-offs for students and practitioners.
- Sectors: education, professional training.
- Dependencies: scalable web visualizations; curated cross-suite datasets.
- Energy-first compilation for battery-critical medical/assistive devices
- What: Tailor pass bundles for medical wearables and assistive robotics, prioritizing energy reductions without sacrificing safety margins.
- Sectors: healthcare, assistive robotics.
- Dependencies: device-level energy telemetry; certification constraints; strong regression testing.
- Secure-by-default pass configurations for safety-critical domains
- What: Curate pass sets that minimize code size growth and complexity (e.g., limiting deep unrolling) to ease verification while maintaining performance.
- Sectors: automotive (ISO 26262), aerospace (DO-178C), industrial control.
- Dependencies: formal toolchain validation; domain-specific compliance; rigorous benchmarking.
Cross-cutting assumptions and dependencies
- Findings are validated on PolyBench/C 4.2.1 (compute-bound, single-threaded, affine kernels), LLVM 21.1.8, and an Intel Alder Lake host; transfer to other workloads (memory-bound, irregular, multi-threaded), architectures (ARM, RISC-V, GPUs), and LLVM versions requires replication.
- Energy measurements rely on RAPL package counters (excluding DRAM/GPU); full-system energy profiling may change conclusions for memory-bound workloads.
- Effective deployment depends on reproducible measurement (CPU pinning, governor settings, ASLR control), access to performance counters, and CI infrastructure.
- Pass-level marginal effects are contextual: a pass inert in one position may enable later transformations; any pruning or guarding requires end-to-end revalidation.
Glossary
- Address-space layout randomization (ASLR): A security feature that randomizes memory addresses of key process components; disabled here to reduce measurement noise. "address-space layout randomization (ASLR) disabled (setarch -R)."
- Affine kernels: Programs whose loop bounds and memory accesses are affine (linear) functions of loop indices; common in numerical code. "On these compute-bound affine kernels, the pipeline is non-monotone"
- Bayesian optimization: A sample-efficient optimization method that models the objective to guide selection of new configurations. "adds Bayesian optimization"
- Branch misses: Hardware events counting mispredicted branches. "branch misses"
- called-value-propagation: An interprocedural analysis/optimization that propagates known call argument values to enable simplifications. "called-value-propagation"
- cgscc: The pass-manager level operating on strongly connected components of the call graph. "module, function, cgscc, loop, and loop-mssa."
- Cohen's d: A standardized effect-size measure comparing the difference between two means relative to pooled variance. "Cohen's between consecutive variants for the top-10 passes"
- Cycles per instruction (CPI): A throughput metric equal to CPU cycles divided by retired instructions. "IPC/CPI open at $2.96$/$0.338$"
- early-cse: A pass that performs early common subexpression elimination to canonicalize and simplify IR. "Top spot is occupied by early-cse (27 out of 30 benchmarks)"
- globaldce: Global dead-code elimination pass that removes unused functions/globals. "and~112 (globaldce)"
- Hyperfine: A benchmarking tool used to run timed command repetitions with warmups. "Runtime measurements use hyperfine (3 warmup, 15 timed runs)"
- indvars: Induction-variable simplification/strengthening pass for loop canonicalization. "48~indvars"
- instcombine: A peephole IR combiner that merges and simplifies instruction patterns. "licm, instcombine, loop-vectorize, loop-rotate, loop-unroll, simplifycfg, sroa, indvars."
- Instructions per cycle (IPC): A throughput metric equal to retired instructions divided by cycles. "instructions per cycle (IPC) gain"
- interquartile range (IQR): The range between the 25th and 75th percentiles; a robust spread measure. "IQR [30.4\%, 54.2\%]"
- ipsccp: Interprocedural sparse conditional constant propagation, an analysis that propagates constants across function boundaries. "Propagation (12~ipsccp) reduces instructions"
- L1 instruction-cache (L1-I): The first-level instruction cache storing fetched instructions. "L1 instruction-cache (L1-I)"
- Last-level cache (LLC): The cache level shared across cores before main memory. "last-level cache (LLC)"
- LICM: Loop-Invariant Code Motion, a loop optimization that hoists invariant computations out of loops. "licm which performs loop-invariant code motion"
- Loop-invariant code motion: Moving computations not dependent on loop iteration outside the loop to reduce work inside. "loop-invariant code motion"
- loop-mssa: The loop-level pass manager that operates on loops in memory SSA form. "loop, and loop-mssa."
- loop-rotate: A loop transformation that rotates loop bodies to improve fall-through and canonical forms. "loop-rotate"
- loop-unroll: A transformation that duplicates loop bodies to reduce overhead and expose optimization. "loop-unroll"
- loop-vectorize: A pass that converts scalar loops to SIMD-vectorized loops when profitable. "loop-vectorize ranks 4th"
- mem2reg: Promotion of memory (stack) allocations to SSA registers to enable further optimizations. "mem2reg which promotes stack allocations to virtual registers"
- MLIR: Multi-Level Intermediate Representation, a compiler infrastructure used to lower high-level ops to LLVM IR. "via MLIR"
- MSR counters: Model-Specific Register-based hardware counters for low-level performance events. "x86 MSR counters"
- New Pass Manager: LLVM’s redesigned pass-management framework with hierarchical, nested managers. "The new pass manager"
- Non-commutative: Describes operations whose results depend on order; here, pass effects depend on pipeline order. "non-commutative"
- Pareto-dominated: A configuration worse or equal in all objectives compared to another; strictly worse in at least one. "Pareto-dominated on (size, speedup) for 29 of 30 kernels."
- Pareto-skewed: A distribution where a small fraction of items contribute most of the effect (80/20-like). "The distribution is severely Pareto-skewed"
- perf stat: Linux tool to collect hardware performance counters and related metrics. "Hardware behavior is characterized using perf stat"
- Phase interference: Deleterious interactions where one optimization pass reduces or negates the benefits of another. "phase interference within the pipeline"
- Phase-ordering problem: The challenge of finding the best order of compiler passes for a given program. "the phase-ordering problem"
- PolyBench/C: A benchmark suite of numerical kernels used to evaluate compiler optimizations. "30 PolyBench/C kernels"
- RAPL: Running Average Power Limit; Intel’s on-chip energy/power measurement interface. "running average power limit (RAPL)"
- simplifycfg: A pass that simplifies the control-flow graph (CFG) by merging blocks and removing redundant branches. "17~simplifycfg"
- SIMD: Single Instruction Multiple Data; vector execution of the same operation over multiple data elements. "single instruction multiple data (SIMD)"
- sroa: Scalar Replacement of Aggregates; rewrites aggregates into scalars to enable further optimization. "sroa which performs scalar replacement of aggregates"
- SSA: Static Single Assignment form, where each variable is assigned exactly once, simplifying analysis. "SSA-based compilation framework"
- Spearman rho: A nonparametric rank correlation coefficient measuring monotonic relationships. "Spearman "
- taskset: Linux utility to set CPU affinity of processes/threads. "using taskset"
- TOML: A human-readable configuration file format used to specify experiments. "specified in TOML"
- Wilcoxon test: A nonparametric statistical significance test for paired or independent samples. "Wilcoxon "
Collections
Sign up for free to add this paper to one or more collections.