- The paper demonstrates that CKA's sensitivity to minor transformations can lead to unexpectedly low similarity scores despite negligible changes in output.
- It employs both theoretical and empirical analyses to reveal how outliers and specific data shifts critically influence CKA measurements.
- The findings underscore the need to combine CKA with other metrics to achieve a more robust and comprehensive evaluation of neural network representations.
Reliability of CKA as a Similarity Measure in Deep Learning
Introduction
The proliferation of deep learning models across diverse domains has intensified the need to understand their internal workings, particularly focusing on how neural networks learn and represent data. Representation learning posits that as data passes through the layers of an Artificial Neural Network (ANN), increasingly complex internal representations are formed. A critical aspect of this understanding involves comparing such learned representations across different models. The Centered Kernel Alignment (CKA) metric has recently emerged as a favored tool for this purpose, especially its linear variant, enabling the comparison of representations within a network, across similar networks with different initializations, and across different architectures trained on the same dataset.
Theoretical Analysis of CKA Sensitivity
This paper presents formal analyses that delineate the sensitivity of CKA to various transformations. One such focus is the sensitivity of CKA to simple transformations that maintain the linear separability of the data, which is a vital attribute for generalization. The authors provide concrete explanations for CKA's responsiveness to outliers—a phenomenon previously observed empirically. Additionally, they explore CKA's handling of transformations that preserve data separability but may drastically alter CKA similarity values.
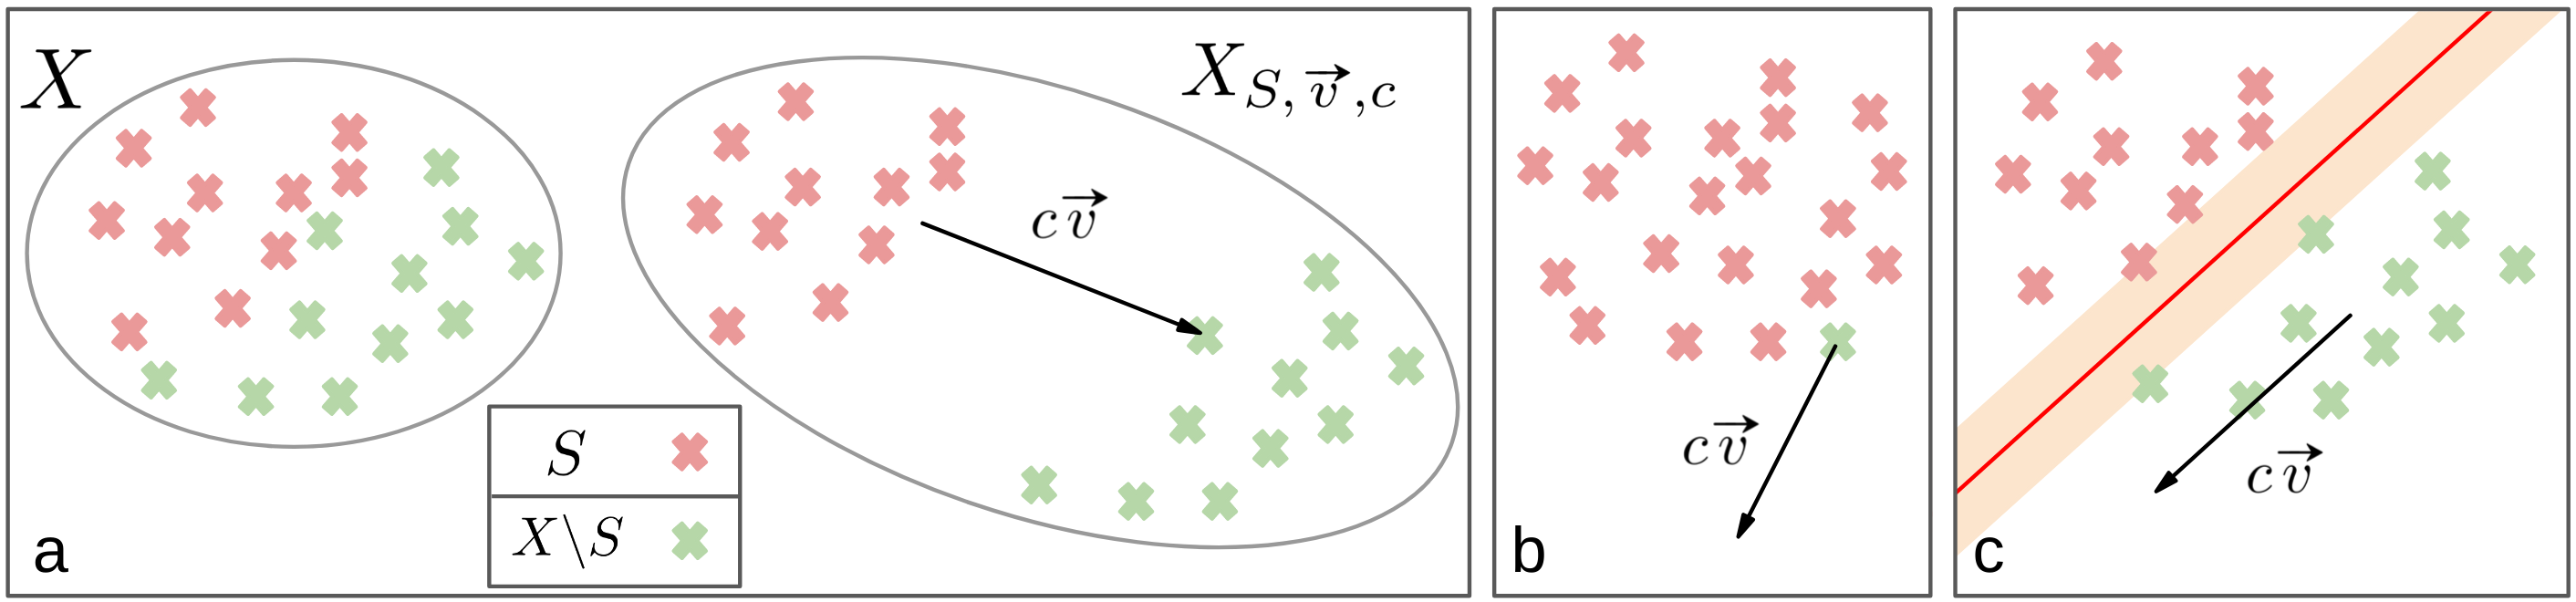
Figure 1: Visual representations of the transformations considered in the theoretical analysis.
Empirical Findings
The empirical section of the paper further investigates CKA's reliability. The authors demonstrate scenarios where CKA paradoxically indicates similarity or dissimilarity, challenging intuitive expectations. For example, they show how CKA may yield low similarity scores between ostensibly similar sets due to minor but impactful transformations.
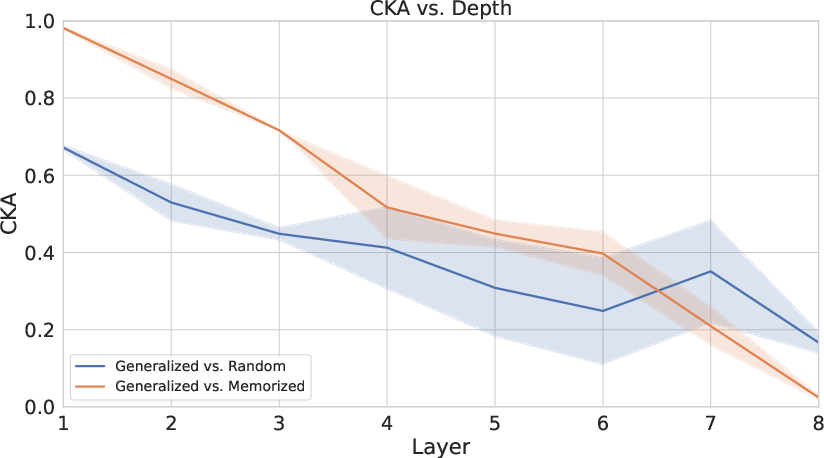
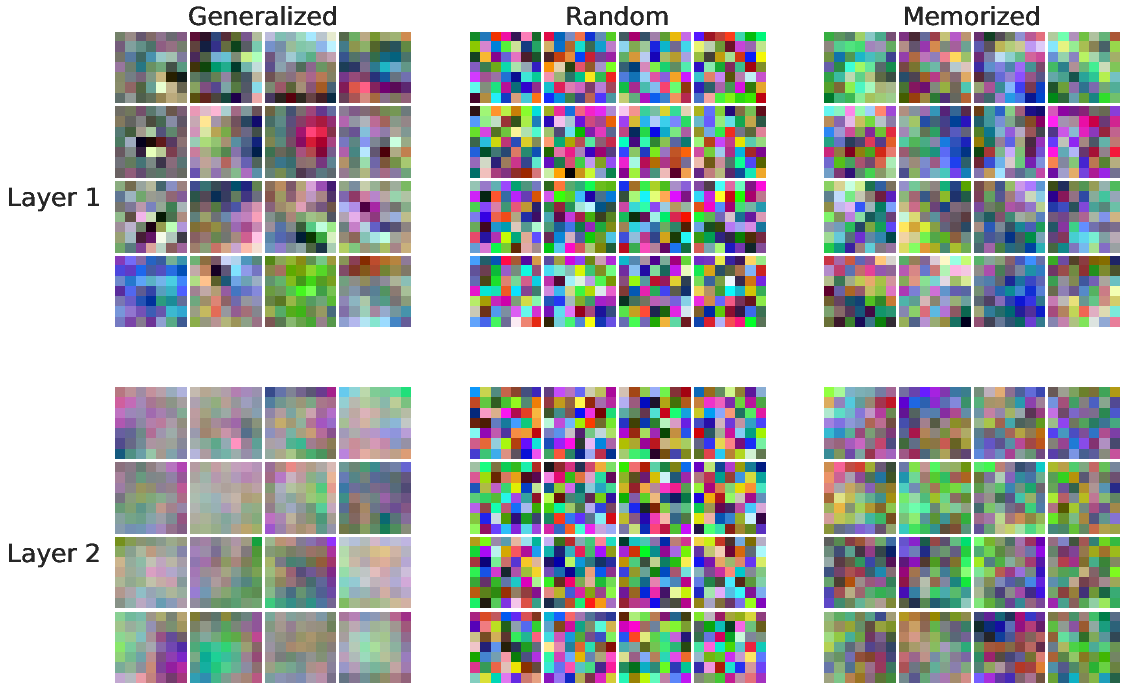
Figure 2: A layer-wise CKA comparison of generalized, memorized, and randomly initialized networks.
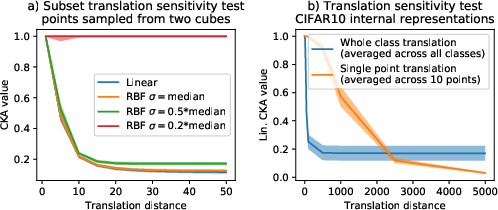
Figure 3: CKA sensitivity tests with subset translations and outliers.
Implications for Neural Network Analysis
The findings suggest that while CKA is a powerful tool, its use demands careful consideration of its limitations. Particularly, the ability to manipulate CKA scores without noticeably affecting model outputs suggests that CKA similarity values can be misleading if relied upon exclusively. This insight calls for a nuanced application of CKA, suggesting that it be used in conjunction with other metrics to ensure robustness when analyzing and comparing neural network representations.
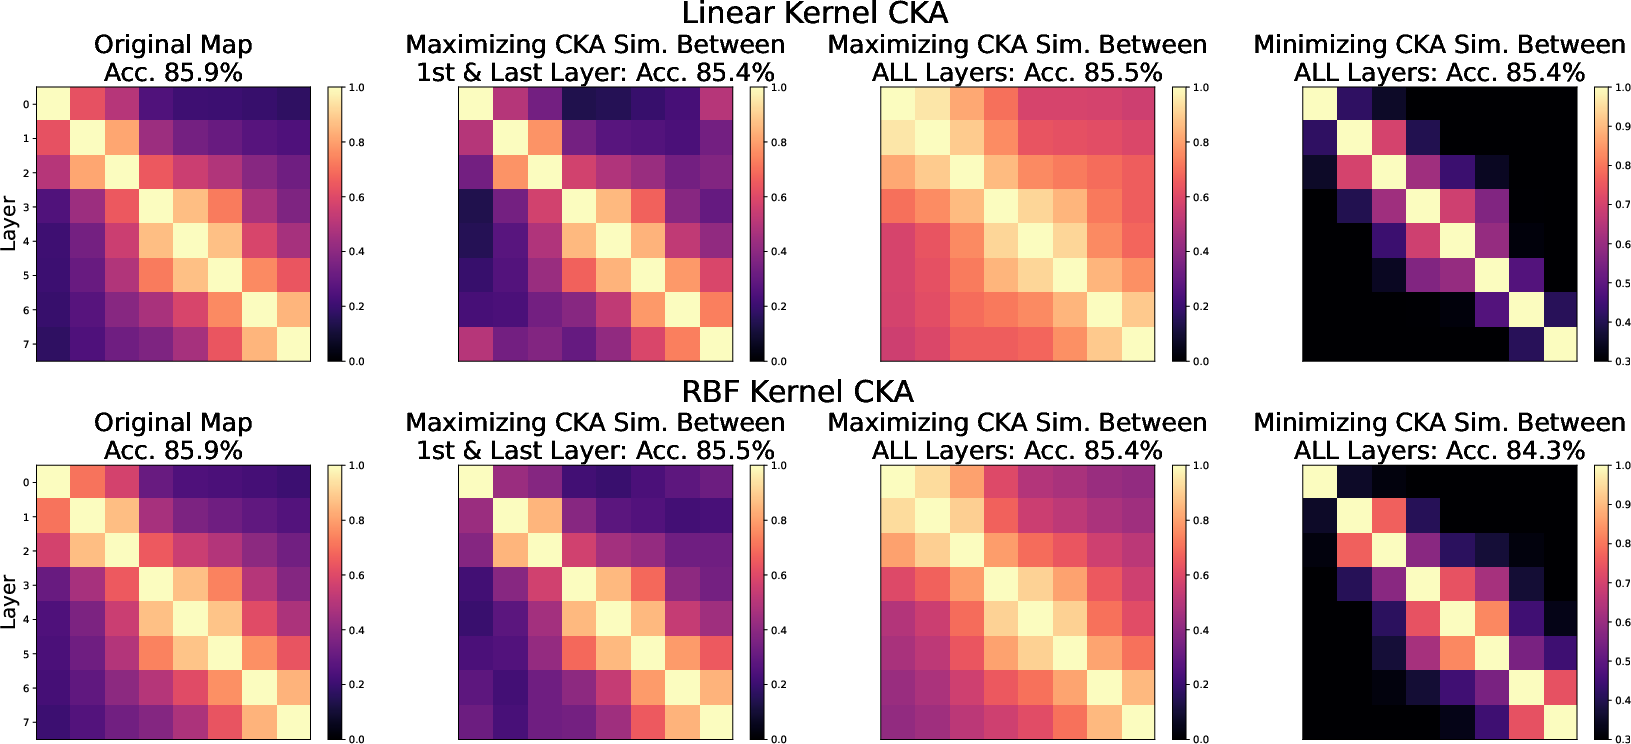
Figure 4: Analytical optimization of CKA maps across network layers.
Conclusion
The study underscores important limitations of the CKA similarity measure, particularly in its linear form. It shows that CKA values can be heavily influenced by transformations that do not affect the functional output of neural networks, calling into question the reliability of CKA as a standalone metric for representation similarity. This necessitates caution in interpreting CKA results and an encouragement to combine it with other methods to obtain a comprehensive understanding of neural representations. Future work may explore more robust similarity measures or adjustments to CKA that can account for the identified issues, aiming to enhance the interpretability and reliability of model comparisons in deep learning.