- The paper presents a novel method that maps over 1,000 language models via log-likelihood vectors to approximate KL divergence.
- The approach uses t-SNE visualization and double-centering normalization, enabling robust clustering of similar model architectures.
- Predictive performance is estimated using ridge regression, demonstrating the practical utility of model mapping for evaluation.
Mapping 1,000+ LLMs via the Log-Likelihood Vector
This essay dissects a method proposed for comparing a large cohort of autoregressive LLMs by utilizing log-likelihood vectors as model features. The paper introduces a scalable technique for constructing a "model map," allowing us to visualize and analyze these LLMs efficiently.
Introduction
The landscape of LMs has evolved rapidly, necessitating systematic exploration of model similarities and their theoretical underpinnings. The paper introduces a method that aligns with the geometric structure of probability distributions, defining models by their log-likelihood vectors across a text corpus. This approach is rooted in the principle that the squared Euclidean distance in this vector space approximates the Kullback-Leibler (KL) divergence, providing a new perspective for large-scale model analysis.
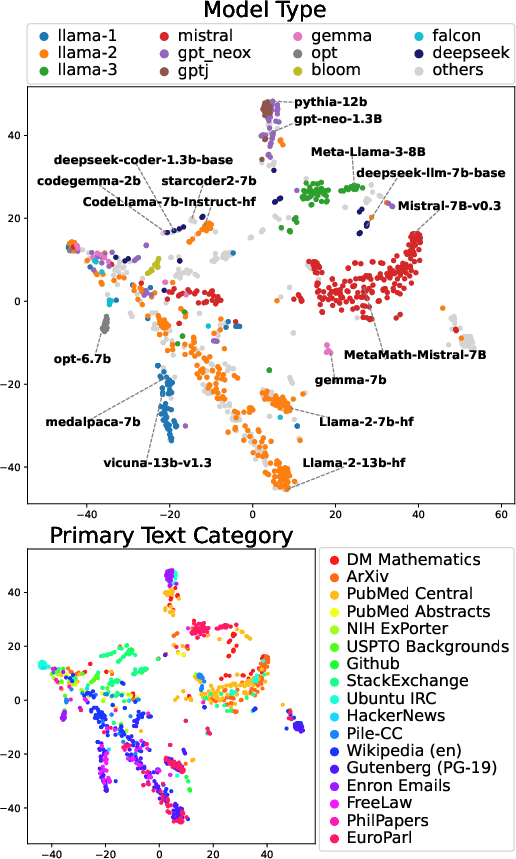
Figure 1: Map of 1,018 LLMs. Their log-likelihood vectors are visualized using t-SNE.
Methodology
Log-Likelihood Vectors and Model Coordinates
The authors define a model's coordinates using log-likelihood vectors derived from a corpus of texts. The method involves computing the log-likelihood matrix L for K models over N text samples. Each model's log-likelihood vector serves as a feature vector. The paper uses double-centering to normalize these vectors, establishing a coordinate system that captures the Euclidean distances between models.
Kullback-Leibler Divergence Approximation
A pivotal insight from the paper is the approximation of the 2⋅KL divergence using the squared Euclidean distance in the model coordinate system. This approximation is grounded in the principles of the exponential family of distributions, ensuring that the theoretical foundation is robust and scalable.
Experimental Validation
Experiments were conducted using a comprehensive dataset from Hugging Face, comprising over 1,000 LLMs. The results demonstrate that distances in this model space reflect similarity in text-generation probability distributions.
Insights from Model Mapping
Visualization of the model map revealed clustering tendencies. Models with similar architectures grouped together, and distinct regions identified thematic or functional categorizations.
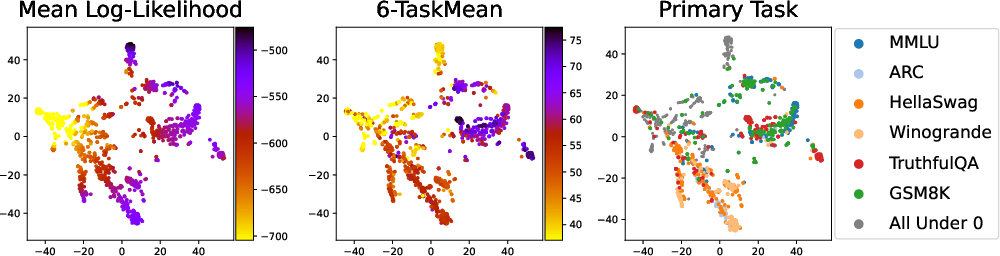
Figure 2: Model maps illustrating model performance. Panels show mean log-likelihood, 6-TaskMean score, and the primary task score.
The log-likelihood vectors not only facilitate comparisons across models but can also predict benchmark task performance. Ridge regression was applied, revealing strong correlations across diverse benchmark datasets, highlighting the method's efficacy.
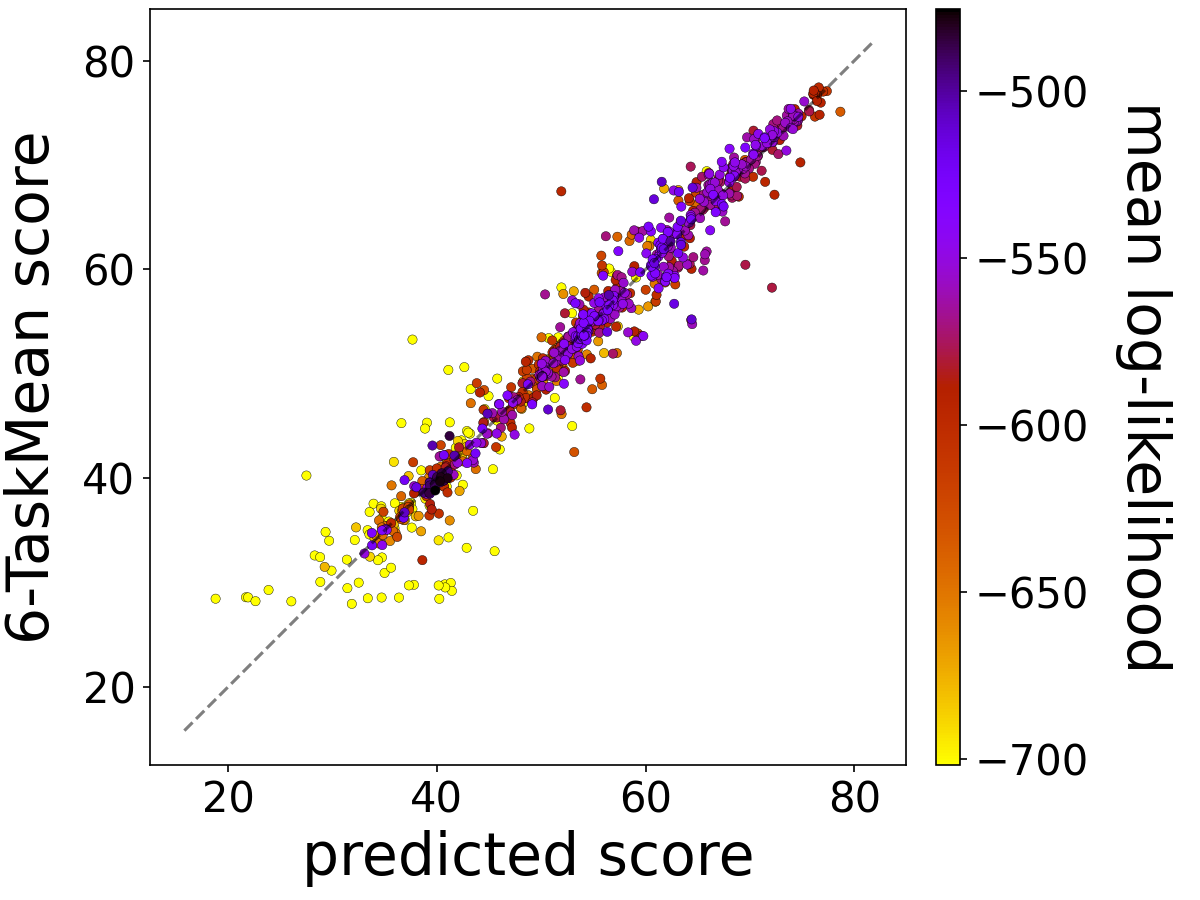
Figure 3: Scatter plot of predicted scores versus 6-TaskMean scores for test sets.
Implications and Future Directions
The method outlined offers a scalable solution for analyzing large collections of LMs. It highlights potential data leakage (e.g., from pre-trained datasets) and enables efficient performance prediction. Future research could explore more granular interpretations of the model map and its implications for model development strategies.
Conclusion
The paper presents a robust framework for distinguishing similarities among LLMs by leveraging the geometric structure of log-likelihood vectors. It provides a practical tool for both theoretical analysis and real-world model evaluation, set to address the complexities of the rapidly expanding LM landscape.