Disentangling the Factors of Convergence between Brains and Computer Vision Models
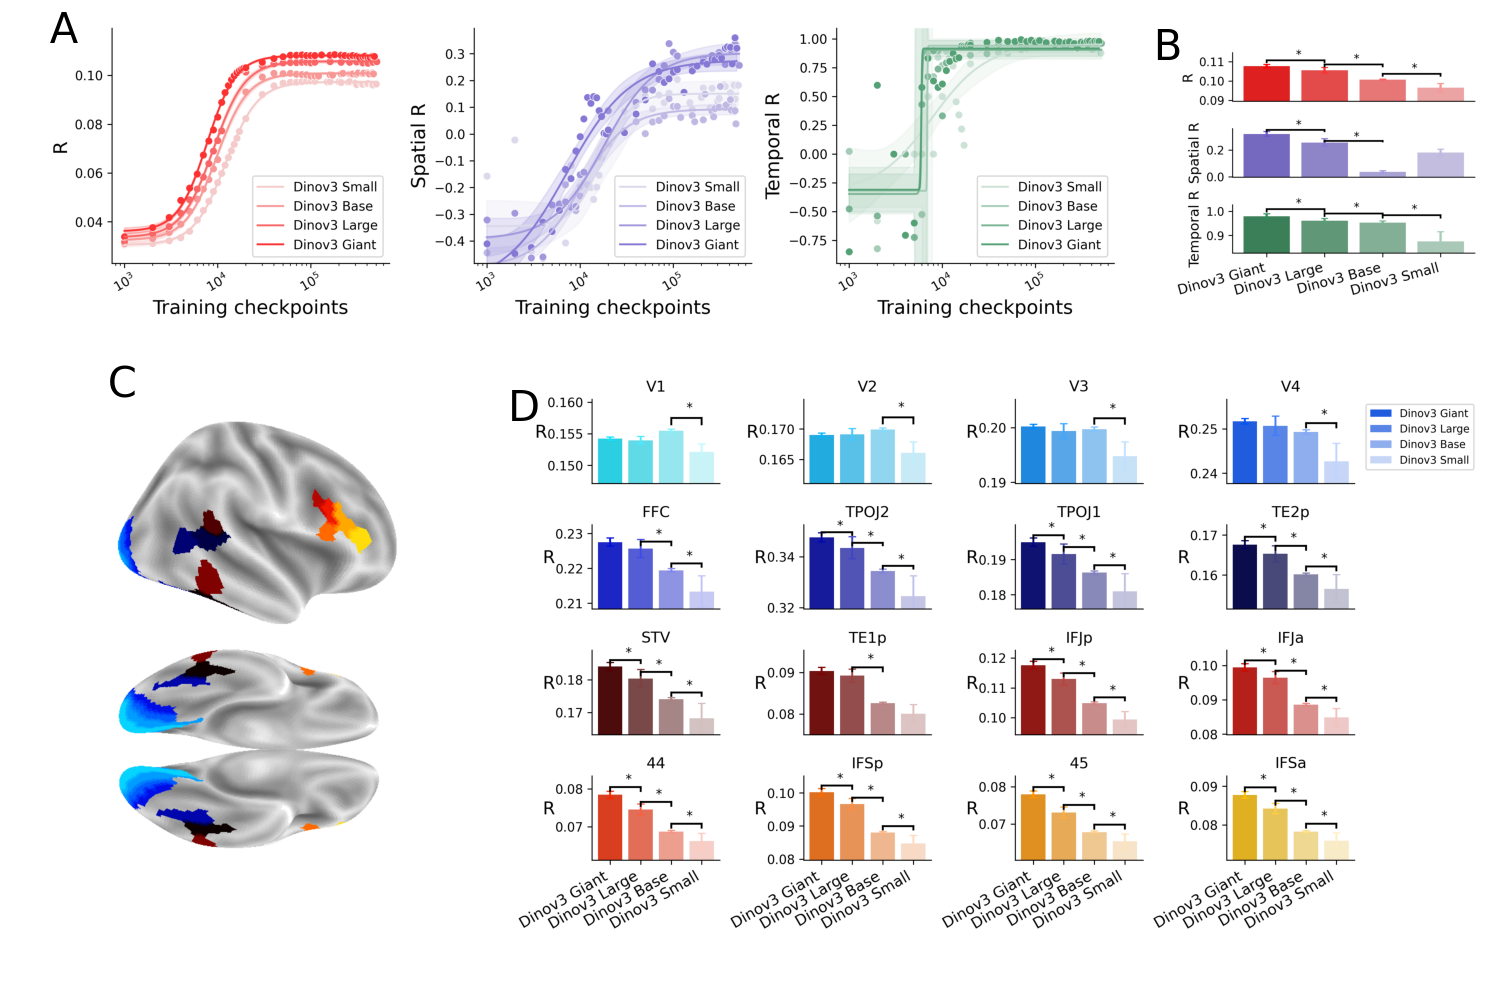
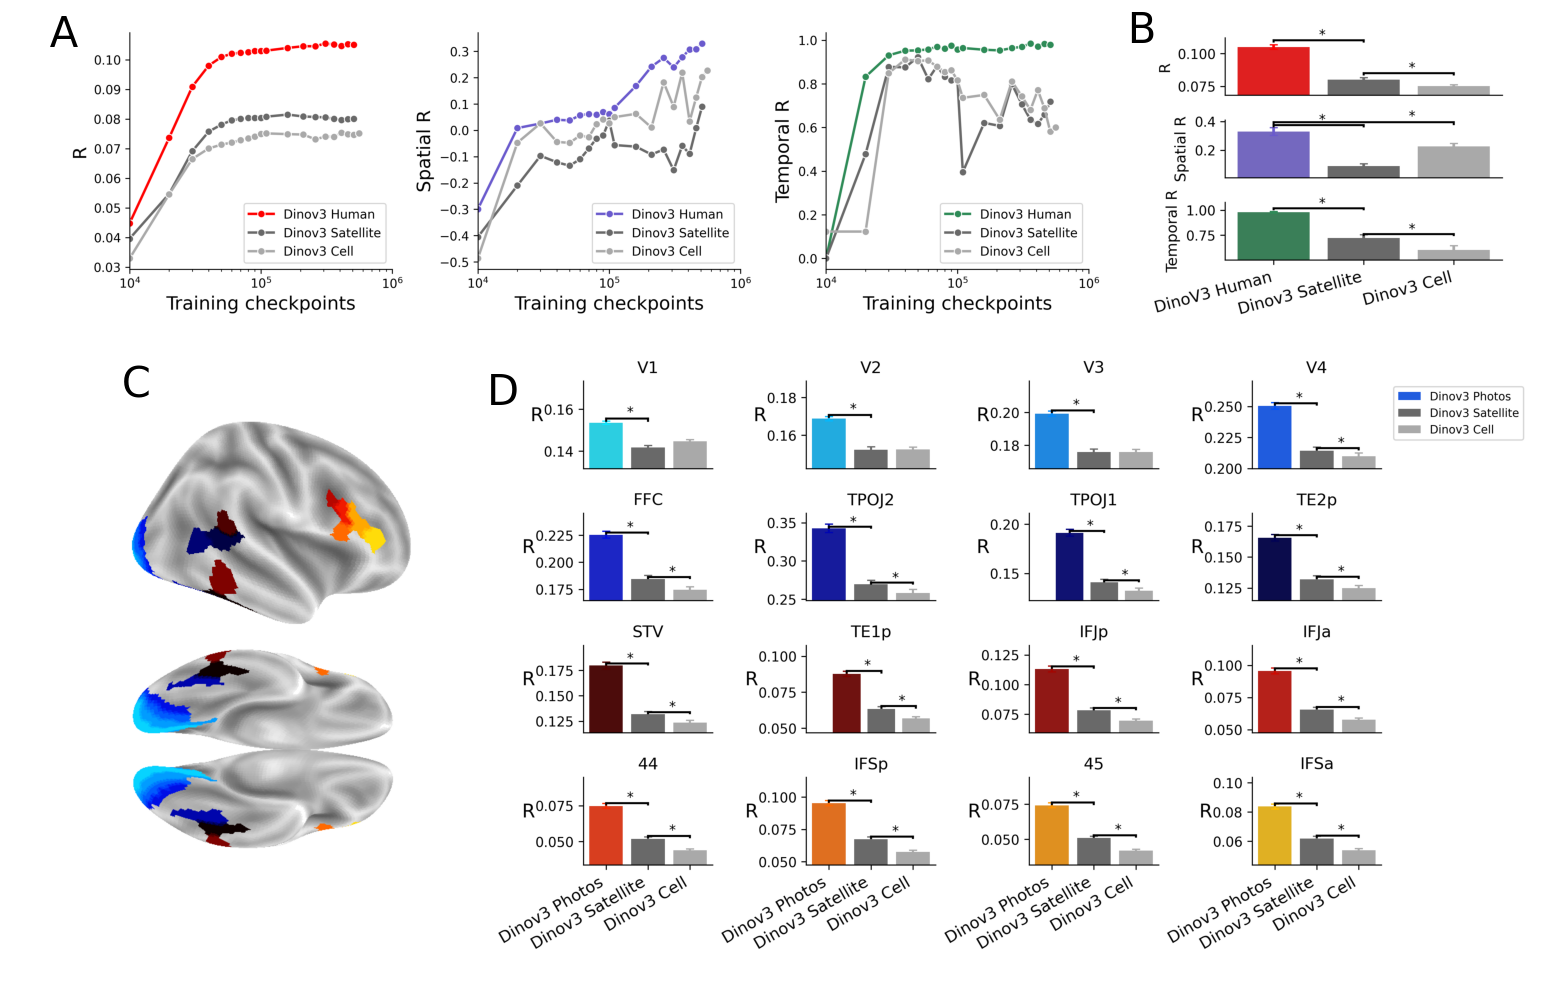
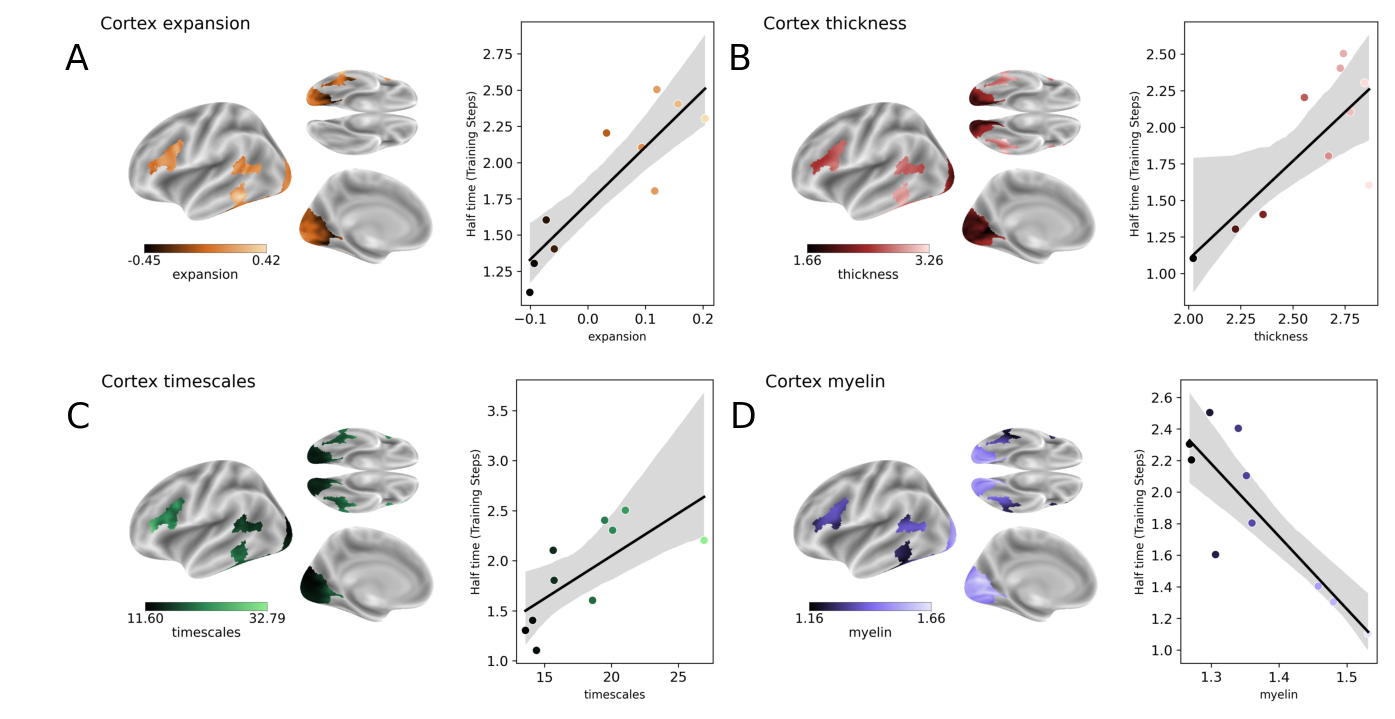
Abstract: Many AI models trained on natural images develop representations that resemble those of the human brain. However, the factors that drive this brain-model similarity remain poorly understood. To disentangle how the model, training and data independently lead a neural network to develop brain-like representations, we trained a family of self-supervised vision transformers (DINOv3) that systematically varied these different factors. We compare their representations of images to those of the human brain recorded with both fMRI and MEG, providing high resolution in spatial and temporal analyses. We assess the brain-model similarity with three complementary metrics focusing on overall representational similarity, topographical organization, and temporal dynamics. We show that all three factors - model size, training amount, and image type - independently and interactively impact each of these brain similarity metrics. In particular, the largest DINOv3 models trained with the most human-centric images reach the highest brain-similarity. This emergence of brain-like representations in AI models follows a specific chronology during training: models first align with the early representations of the sensory cortices, and only align with the late and prefrontal representations of the brain with considerably more training. Finally, this developmental trajectory is indexed by both structural and functional properties of the human cortex: the representations that are acquired last by the models specifically align with the cortical areas with the largest developmental expansion, thickness, least myelination, and slowest timescales. Overall, these findings disentangle the interplay between architecture and experience in shaping how artificial neural networks come to see the world as humans do, thus offering a promising framework to understand how the human brain comes to represent its visual world.
Paper Prompts
Sign up for free to create and run prompts on this paper using GPT-5.
Top Community Prompts
Knowledge Gaps
Knowledge gaps, limitations, and open questions
Below is a single, actionable list of what remains missing, uncertain, or unexplored in the paper.
- Exclusivity of DINOv3: The study only investigates a single self-supervised ViT family (DINOv3). It remains unknown whether the observed spatial, temporal, and encoding alignments generalize to other architectures (e.g., CNNs, CoAtNet, MLP-Mixers), training objectives (supervised, contrastive, masked modeling, generative), and multimodal models (e.g., CLIP, SigLIP, MAE).
- Confounds in model scaling: “Size” varies both depth and width across variants; the specific contribution of depth vs width vs token capacity vs patch size to brain alignment is not disentangled. Controlled ablations are needed.
- Training recipe confounds: Training schedules differ (e.g., batch size 4096 vs 2048; total steps and data scale vary by model/data type). The causal attribution to “data type” vs “training recipe” remains ambiguous without fully matched hyperparameters and compute budgets.
- Data type attribution: Human-centric vs satellite vs cellular datasets are matched in quantity (10M), but not in low-level statistics (spectral content, color channels), resolution, camera geometry, or augmentations. Which visual statistics drive higher brain alignment is not isolated.
- Augmentation effects: DINO-style strong augmentations (crops, color jitter, blur) may shape invariances relevant for cortical alignment, but their role is not explicitly varied or measured.
- Layer selection and feature choice: The paper alternately references “22 layers” while models have 12–40 layers, and it is unclear whether features come from CLS token, patch tokens, or pooled embeddings. This ambiguity can bias layer–ROI mapping and temporal analyses.
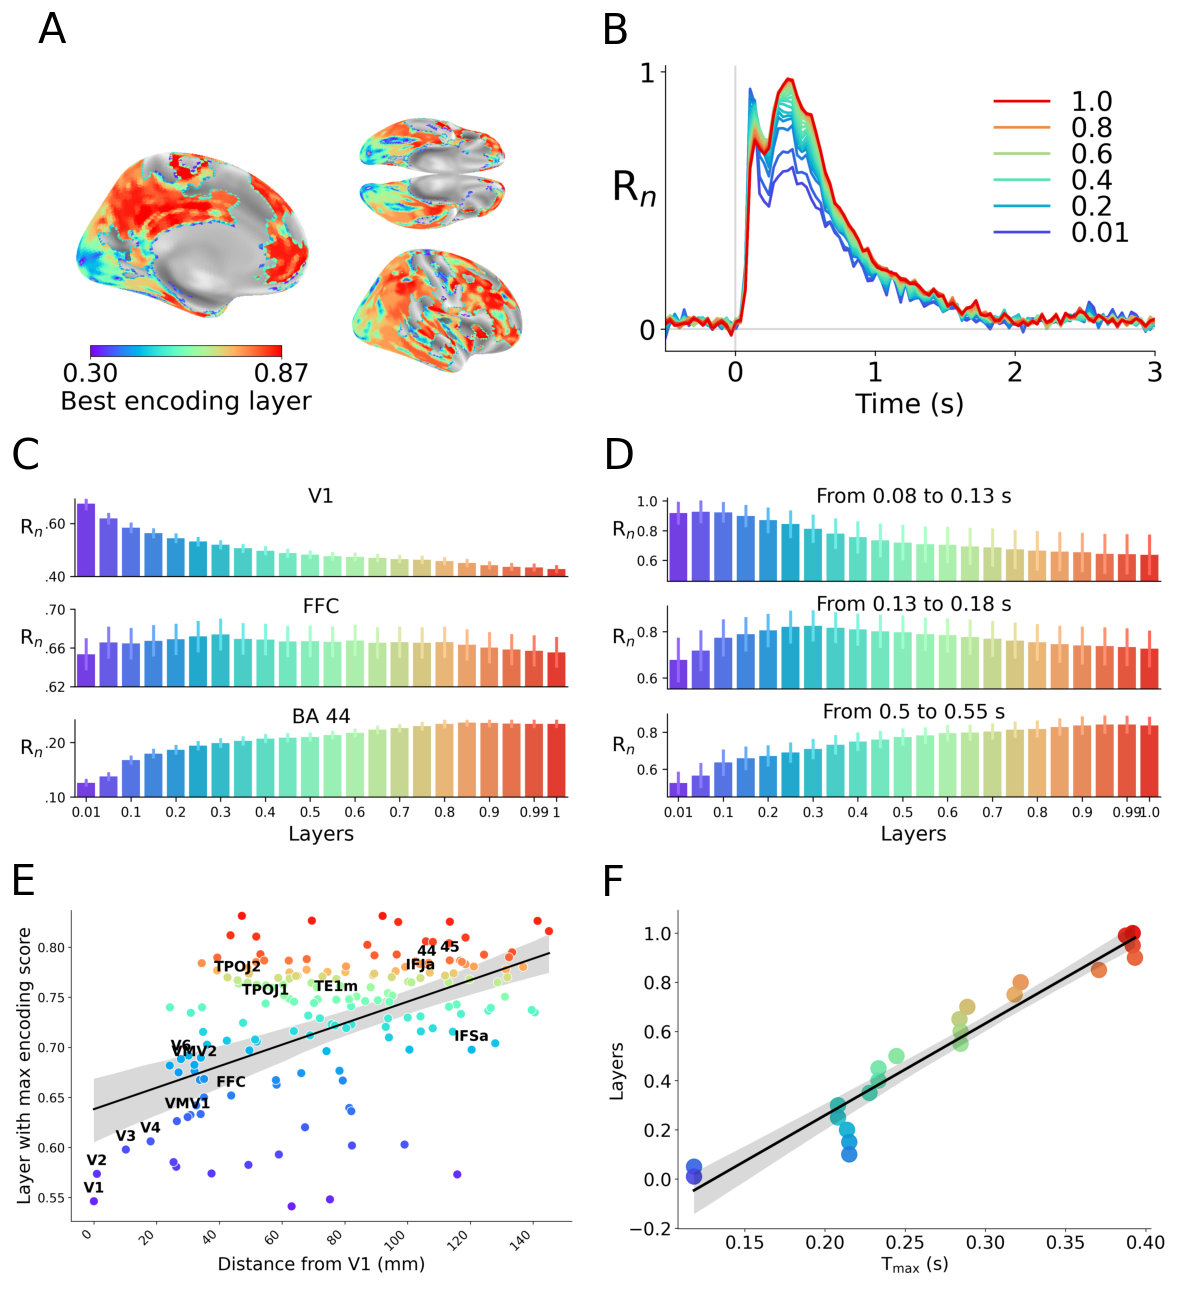
- Argmax-layer mapping biases: Using the “best” (argmax) layer per ROI/timepoint may obscure multi-layer contributions. Comparing single-layer vs learned linear combinations (layer mixing) and testing whether hierarchy effects persist under mixing would clarify the robustness of the hierarchy claims.
- Linear-only encoding: Similarity is assessed with linear ridge models. Potential nonlinear relationships, recurrent dynamics, and cross-layer interactions remain unexplored; RSA/CKA or nonlinear encoding could reveal additional structure.
- Noise ceilings and reliability: No explicit noise ceiling or split-half reliability is used for fMRI/MEG, making it hard to judge how close model performance is to the measurable upper bound and to compare ROIs fairly.
- Spatial autocorrelation controls: Correlations between half-time maps and cortical properties (thickness, myelin, expansion, timescales) are not corrected for spatial autocorrelation (e.g., spin tests). Results may be inflated by spatial smoothness.
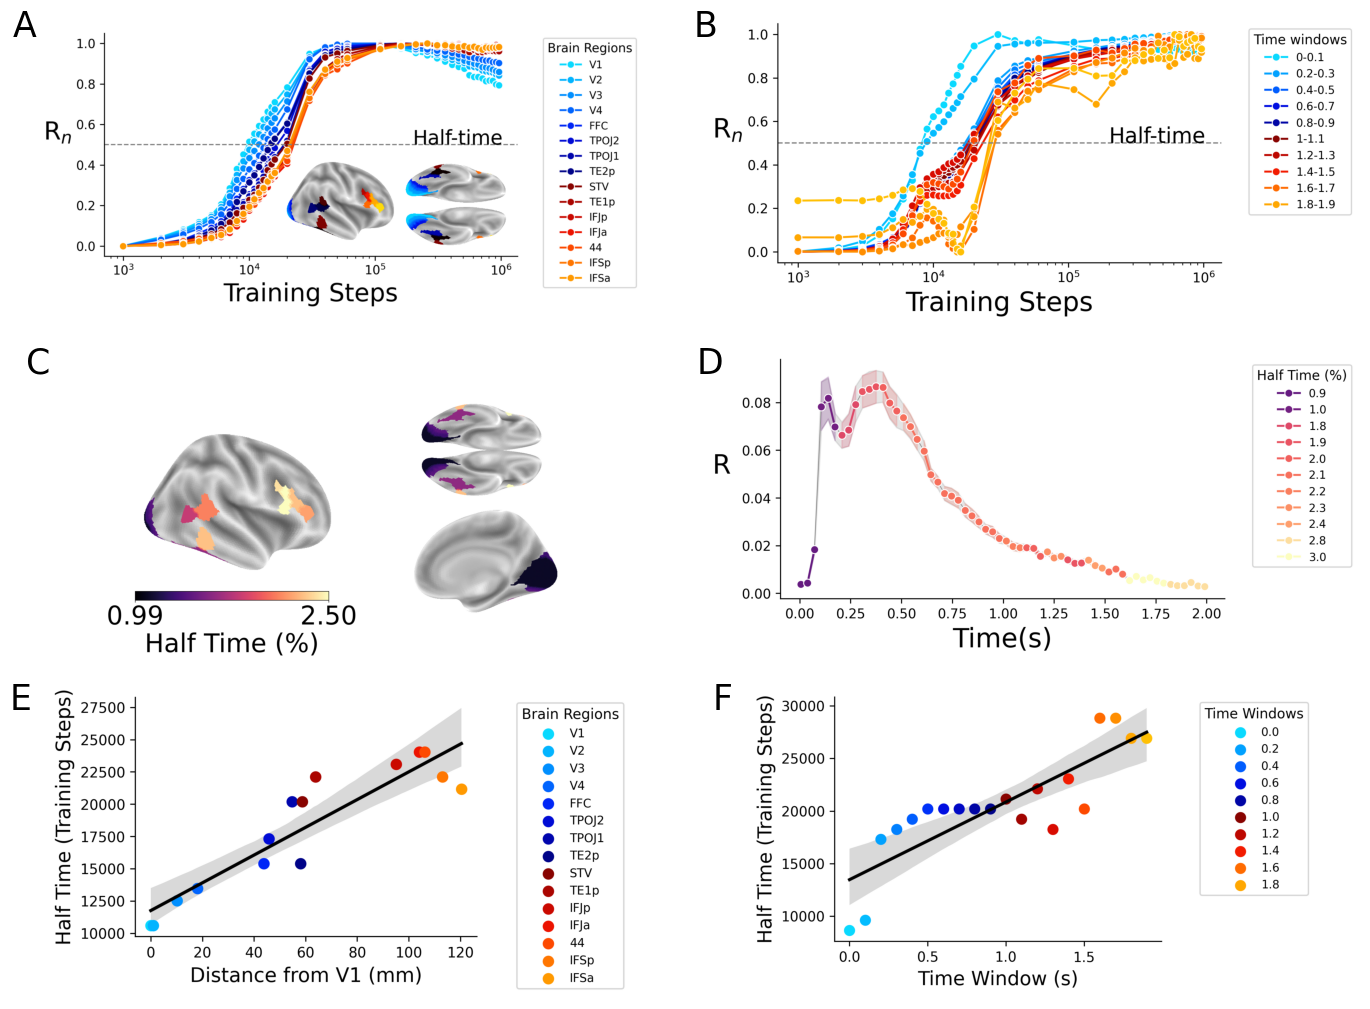
- Coarse spatial hierarchy proxy: The “distance from V1” is a very coarse proxy for cortical hierarchy. Testing against established anatomical/functional hierarchies (ventral vs dorsal stream parcellations, connectivity-based gradients, cytoarchitectonic maps) is needed.
- Limited cortical coverage: Analyses focus on 15 ROIs and largely on visual and prefrontal areas; dorsal stream, parietal, and multimodal association regions are undercharacterized. Whole-cortex, fine-grained parcellations could refine conclusions.
- MEG preprocessing ambiguities: The MEG description includes a likely typo (“time-lock to words”) and an unusual temporal-score definition (averaging windows where normalized brain-score ≥95%). A more standard treatment (e.g., latency of peak, onset, sustained responses; broader frequency content) is warranted.
- Temporal dynamics vs recurrence: ViTs are feedforward; yet late MEG responses and PFC alignment may depend on recurrent/feedback processes, attention, or task engagement in the brain. Testing recurrent or attention-modulated models could probe these mechanisms.
- Initial negative spatial/temporal scores: Deep layers of random networks initially best predict early/low-level responses. The mechanistic cause of this inversion remains unexplained—does it arise from positional embeddings, patch token statistics, or initialization?
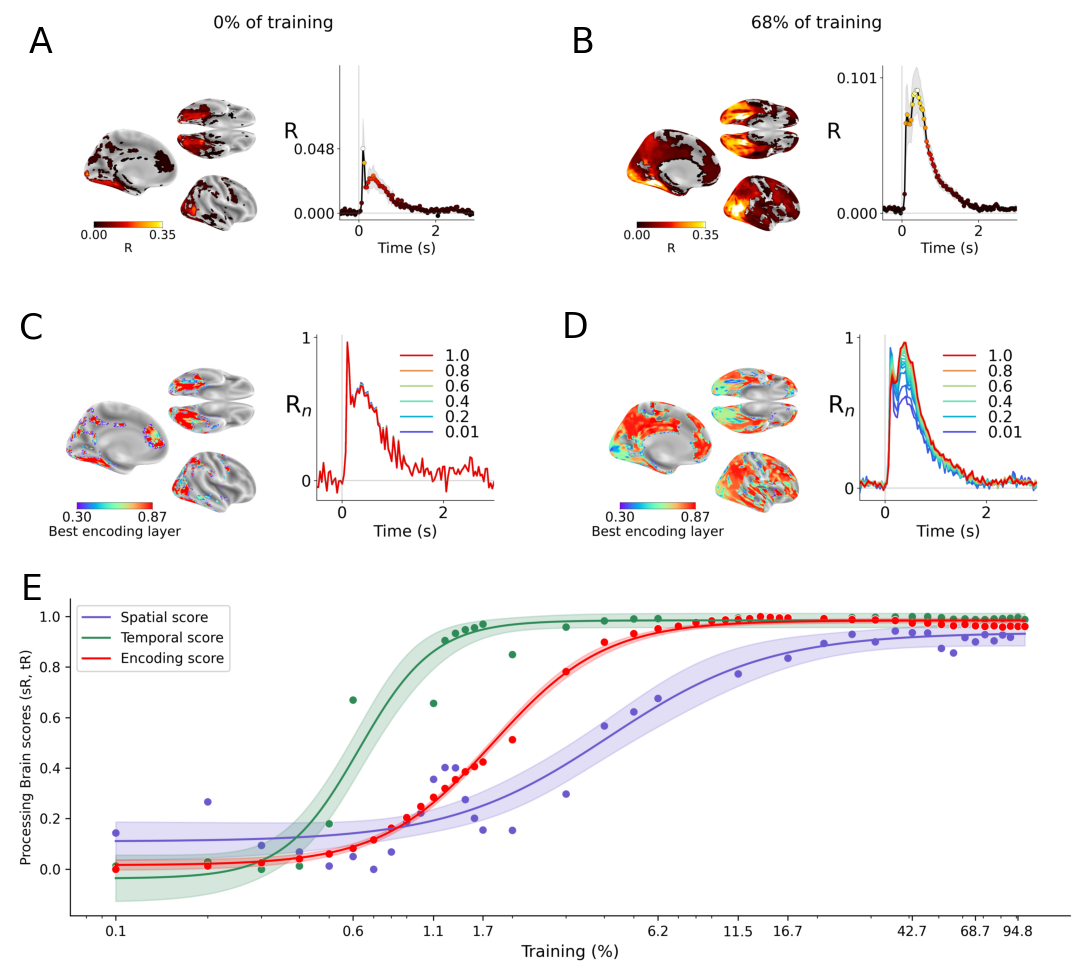
- Training chronology attribution: “Half-times” are reported as fractions of steps, but not normalized for the number of unique images, optimizer state, or augmentation intensity across models. The extent to which chronology reflects data exposure vs optimization dynamics remains unclear.
- Static image limitation: Stimuli are static. Alignment to motion, temporal integration, and dorsal-stream functions cannot be assessed without videos or dynamic stimuli.
- Adult-only brain data: The developmental interpretation is speculative without infant/child or longitudinal data to test whether model training trajectories mirror cortical maturation.
- Task and cognitive state mismatch: NSD involves a recognition task and THINGS-MEG involves fixation, while models are trained with self-supervised objectives. How attention, task demands, and behavioral goals modulate alignment is not tested.
- Generalization and OOD robustness: Alignment is measured on natural images similar to model training. Whether alignment persists for out-of-distribution stimuli (e.g., textures, adversarial patterns, illusions, synthetic shapes) is unknown.
- Semantic content drivers: The gain from human-centric data could be driven by faces, bodies, text, scene semantics, or social content. Systematic content-controlled experiments are needed to isolate which semantic factors boost alignment, especially in PFC.
- Cross-model reproducibility: Results rely on single training runs per variant. Variance across seeds, checkpoints, and random initializations is not reported, limiting claims about robustness of trends.
- Alignment vs task performance: No analysis links computer vision performance (e.g., segmentation, detection) to brain alignment. Are improvements in certain tasks predictive of alignment in specific ROIs?
- Multimodal augmentation: Prior work suggests high-level alignment with LLMs; testing vision–language pretraining (e.g., CLIP/SigLIP) could clarify whether multimodal objectives selectively improve alignment in associative cortex.
- Token-space topology and retinotopy: How patch-level attention and positional embeddings align to retinotopic maps (e.g., eccentricity, polar angle) is not examined.
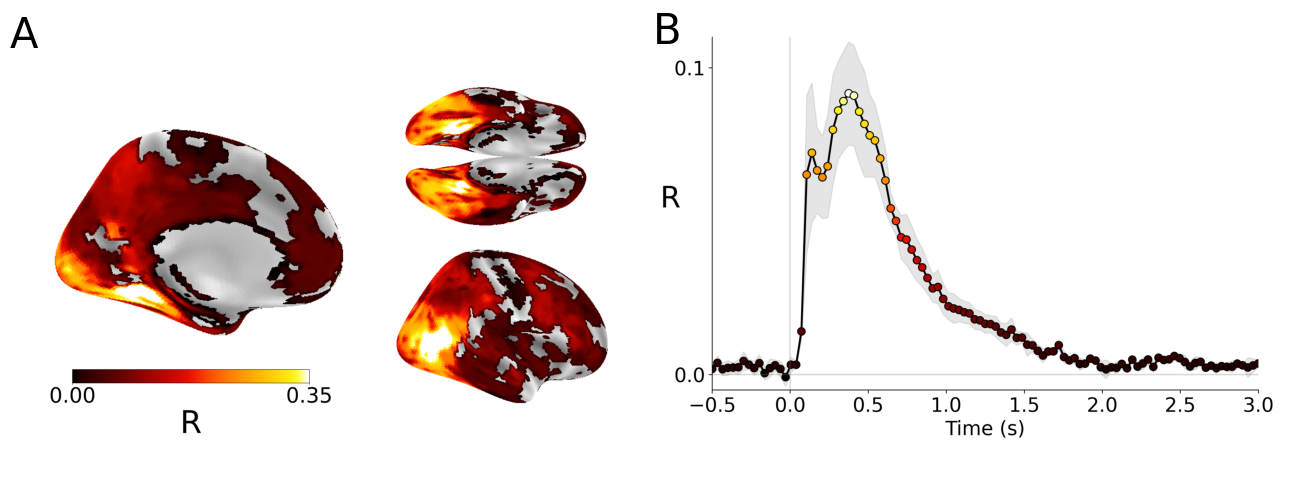
- Hemodynamic modeling: fMRI analyses use a fixed 5.5s post-onset sample. Region-specific HRF variability and deconvolution are not modeled, which may bias spatial conclusions.
- Parcellation and atlas dependence: ROI choices, surface mapping, and thresholding (FDR p<0.01) can affect which regions appear aligned. Testing across multiple parcellations and thresholds would assess robustness.
- Cellular/satellite preprocessing: Differences in channels (e.g., fluorescence) and preprocessing may degrade alignment in non-human-centric datasets. Matching photometric statistics and camera geometry could test whether low-level harmonization closes the gap.
- Depth-dependent timescales: The strong temporal-score correlation (R≈0.96) could partly reflect monotonic layer ordering rather than genuine neurophysiological mapping. Control analyses (e.g., shuffled layer indices, equalized feature dimensionality) are needed to rule out trivial order effects.
- Causal interventions: No causal tests (e.g., feature ablations, synthetic stimuli controlling shape/texture, phase scrambling) to identify which representational dimensions drive alignment across ROIs and time.
- Feedback/attention modeling: The paper does not test models with explicit top-down mechanisms (task signals, attention modules) that may be critical for aligning higher-order cortical regions (e.g., IFG/IFS).
- Species and modality generality: Alignment is only evaluated in human vision. Whether the identified principles extend to nonhuman primates or to other sensory modalities (audition, somatosensation) remains open.
Collections
Sign up for free to add this paper to one or more collections.