Are AI Capabilities Increasing Exponentially? A Competing Hypothesis
Abstract: Rapidly increasing AI capabilities have substantial real-world consequences, ranging from AI safety concerns to labor market consequences. The Model Evaluation & Threat Research (METR) report argues that AI capabilities have exhibited exponential growth since 2019. In this note, we argue that the data does not support exponential growth, even in shorter-term horizons. Whereas the METR study claims that fitting sigmoid/logistic curves results in inflection points far in the future, we fit a sigmoid curve to their current data and find that the inflection point has already passed. In addition, we propose a more complex model that decomposes AI capabilities into base and reasoning capabilities, exhibiting individual rates of improvement. We prove that this model supports our hypothesis that AI capabilities will exhibit an inflection point in the near future. Our goal is not to establish a rigorous forecast of our own, but to highlight the fragility of existing forecasts of exponential growth.

Paper Prompts
Sign up for free to create and run prompts on this paper using GPT-5.
Top Community Prompts
Explain it Like I'm 14
Are AI Capabilities Increasing Exponentially? A Simple Explanation
1) What is this paper about?
This paper asks a big question: Are AI systems getting better at an exponential rate (like doubling every few months), or is their progress starting to slow down? It challenges a popular report (by METR) that said AI has been improving exponentially since 2019. The authors argue that the data can also be explained by a different story: fast growth that now seems to be bending toward a plateau (slowing down).
2) What questions are the authors trying to answer?
- Is AI progress truly exponential, as some claim?
- Could recent AI gains be explained by two separate parts improving at different times: the base AI model and its “reasoning” add-on?
- If we model these two parts separately, does the curve of progress look like it will start slowing soon (an S-shaped “sigmoid” curve) rather than keep speeding up?
3) How did they study it? (Methods in plain language)
Think of measuring AI skill like measuring how high an athlete can jump. METR introduced a metric called the “50% model horizon.” In simple terms, they collected many real tasks (like software tasks or research problems) that take humans different amounts of time, and then asked: for each AI model, what is the hardest level of task it can get right about half the time? That “hardest level” is the model’s horizon.
- If the horizon grows exponentially, that means the “hardest level” is doubling in difficulty after a fixed number of months (like getting twice as hard every 7 months).
The authors re-used METR’s publicly shared data and tried different ways to “fit a curve” to it—that is, to draw a smooth line that best follows the data points. They compared several shapes:
- Exponential curve: keeps speeding up (like a snowball rolling faster and faster).
- Sigmoid (S-shaped) curve: starts slow, speeds up, then slows down and flattens (like a plant that grows fast at first and then levels off).
- Flexible splines: a very bendy curve that can fit many shapes.
They also proposed a new idea: split AI capability into two parts:
- Base capability: what the model can do out of the box (thanks to training on lots of data and bigger models).
- Reasoning capability: extra “think step-by-step” skills added during post-training (like teaching the model to show its work).
They treat overall capability as multiplicative: base × reasoning. In everyday terms, if your base skill is strong and your reasoning adds a multiplier, you get much better. But if either one flattens, the total improvement slows too.
They then:
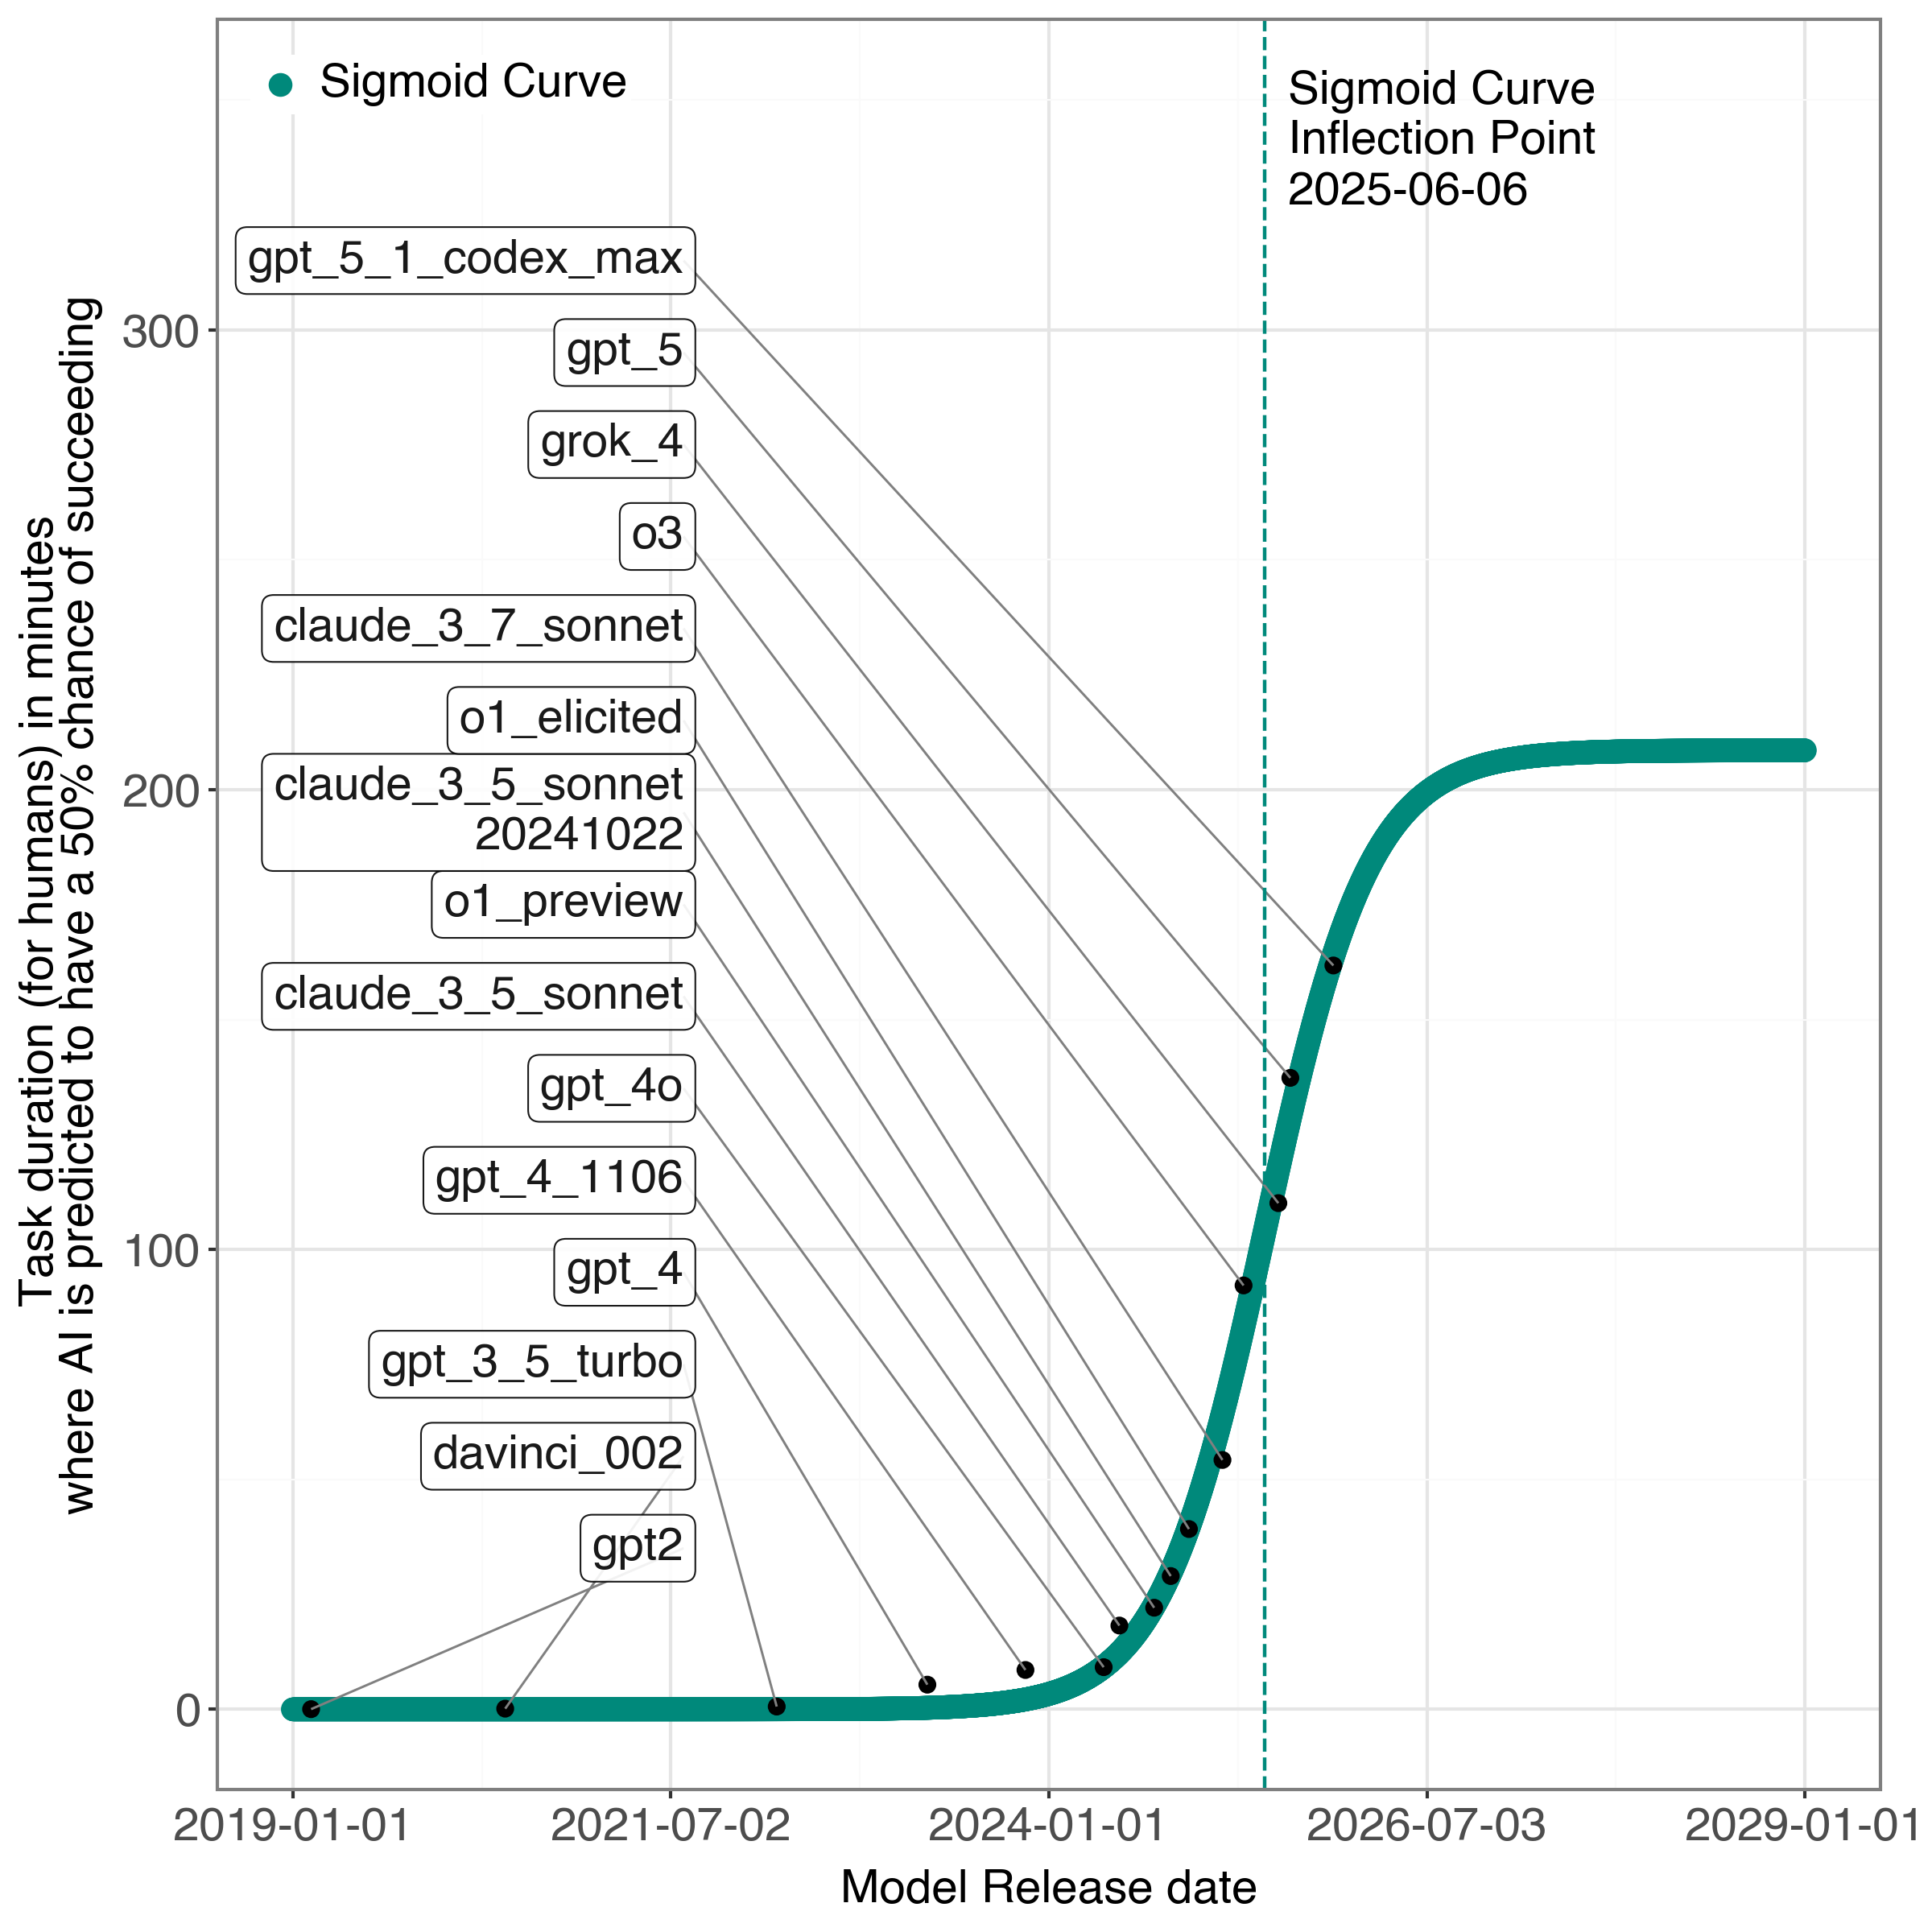
- Fit a single sigmoid curve directly to METR’s data (to see where the “inflection point” is—the turning point where growth starts to slow).
- Fit their two-part (base and reasoning) model using statistical tools (Stan) and compared how well each curve matched the data (using mean squared error, which measures how far the curve is from the points on average).
They also did a bit of math (theory) to show that when you multiply several S-shaped improvements that happen at different times, the total can look exponential for a while—but eventually it bends and plateaus.
Key terms in everyday language:
- Exponential growth: like a savings account that doubles at a steady rhythm—fast and keeps accelerating.
- Sigmoid (S-shaped) growth: like learning to ride a bike—first slow, then a quick improvement, then it levels off as you get close to your limit.
- Inflection point: the moment the curve changes from speeding up to slowing down.
- Multiplicative model: improvements stack like multipliers (2× then 3× makes 6×), not like simple addition.
4) What did they find, and why does it matter?
Main findings:
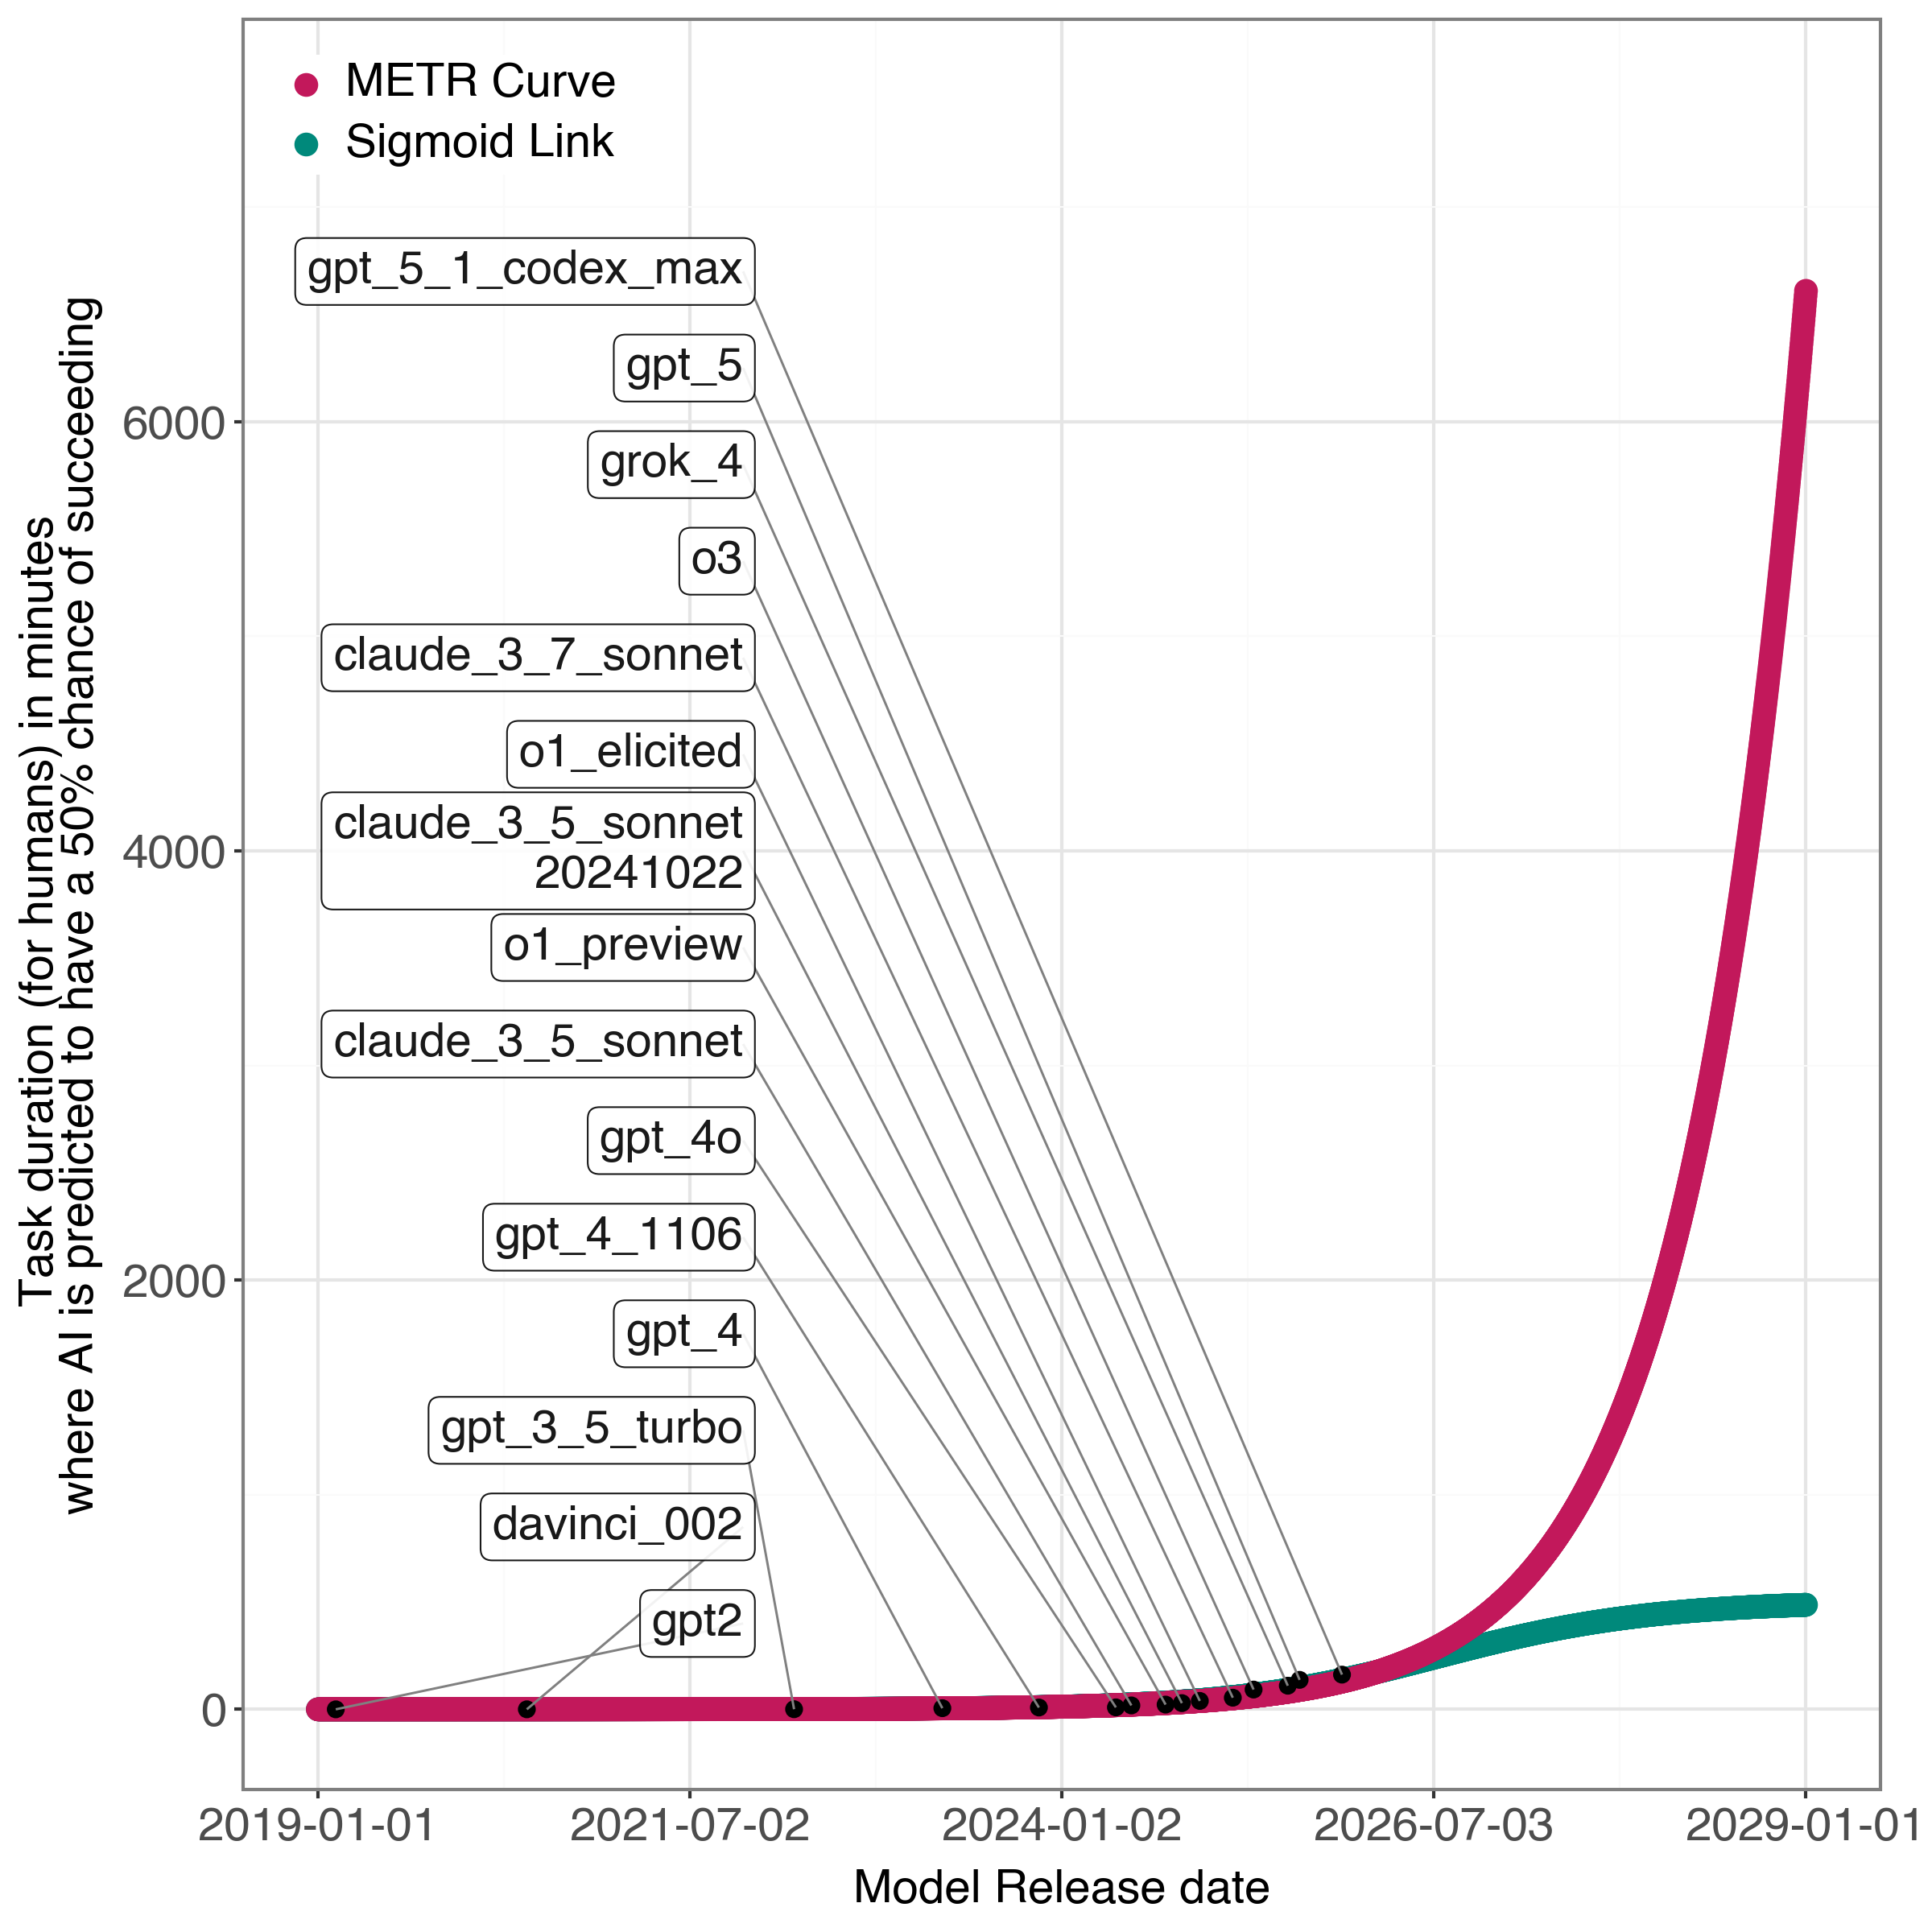
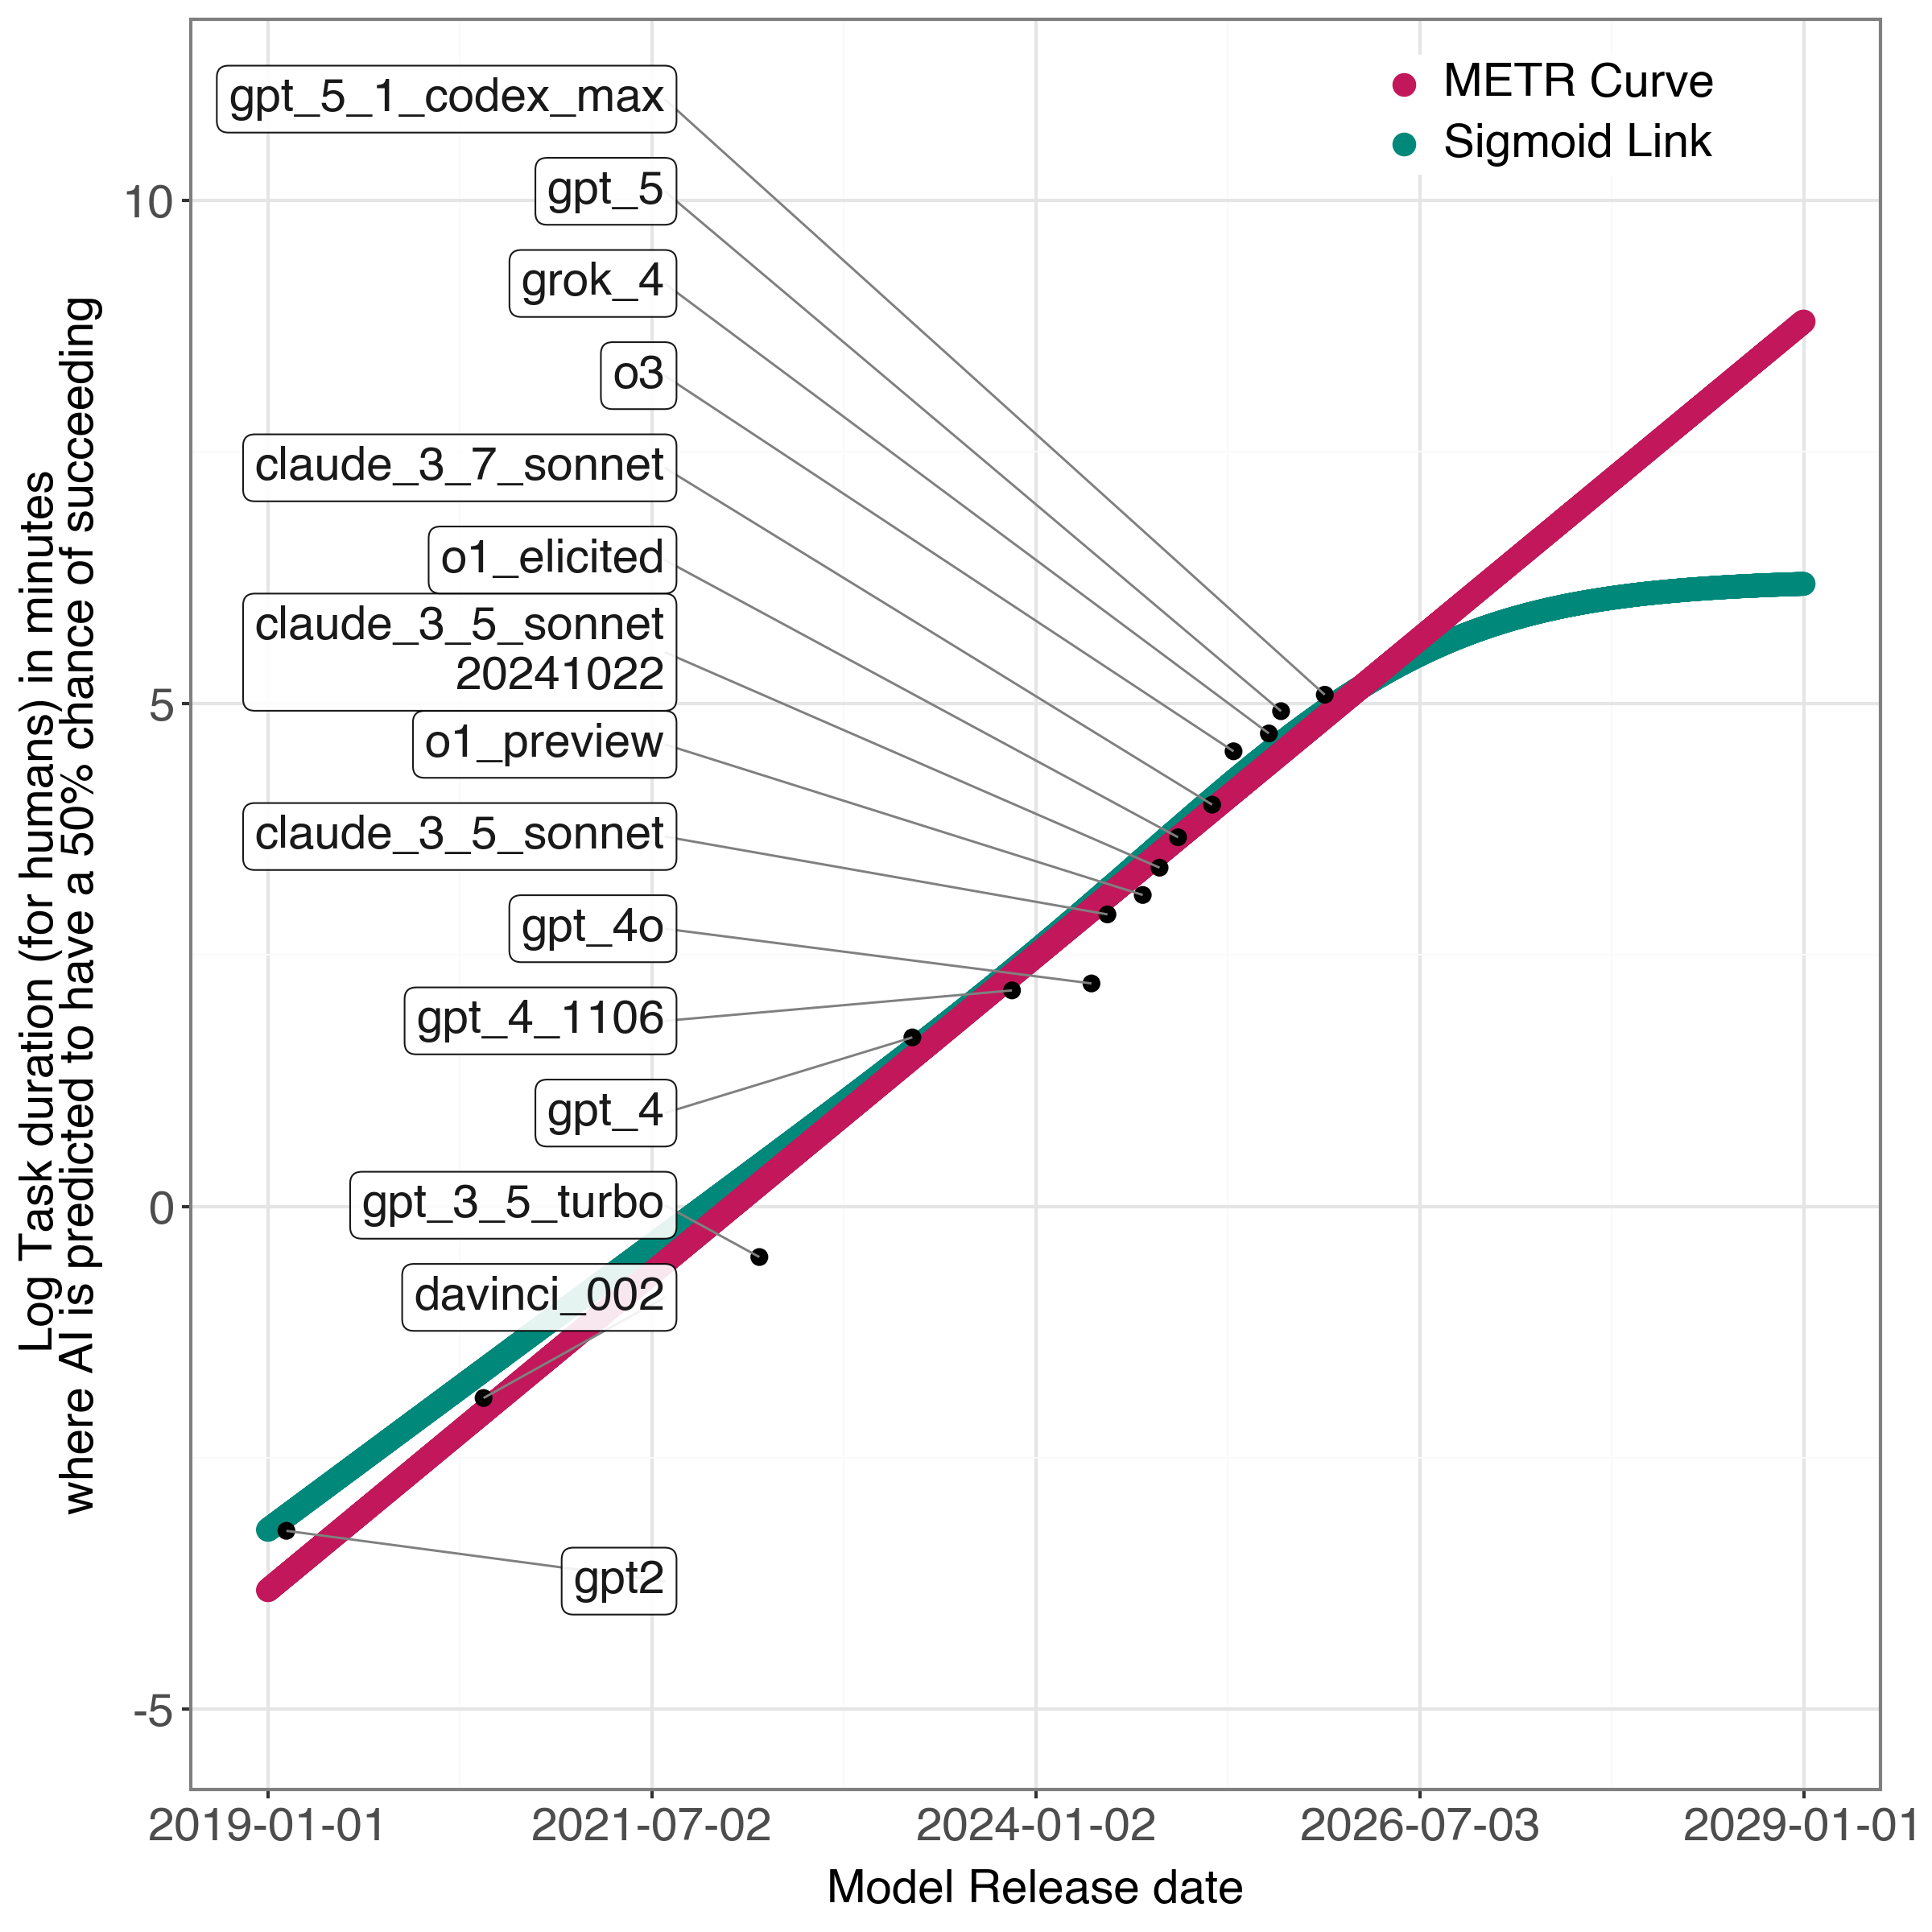
- A single S-shaped (sigmoid) curve fits the METR data very well and suggests the inflection point (the curve’s turn from speeding up to slowing down) already happened around mid-2025. In other words, the “fastest acceleration” may be behind us.
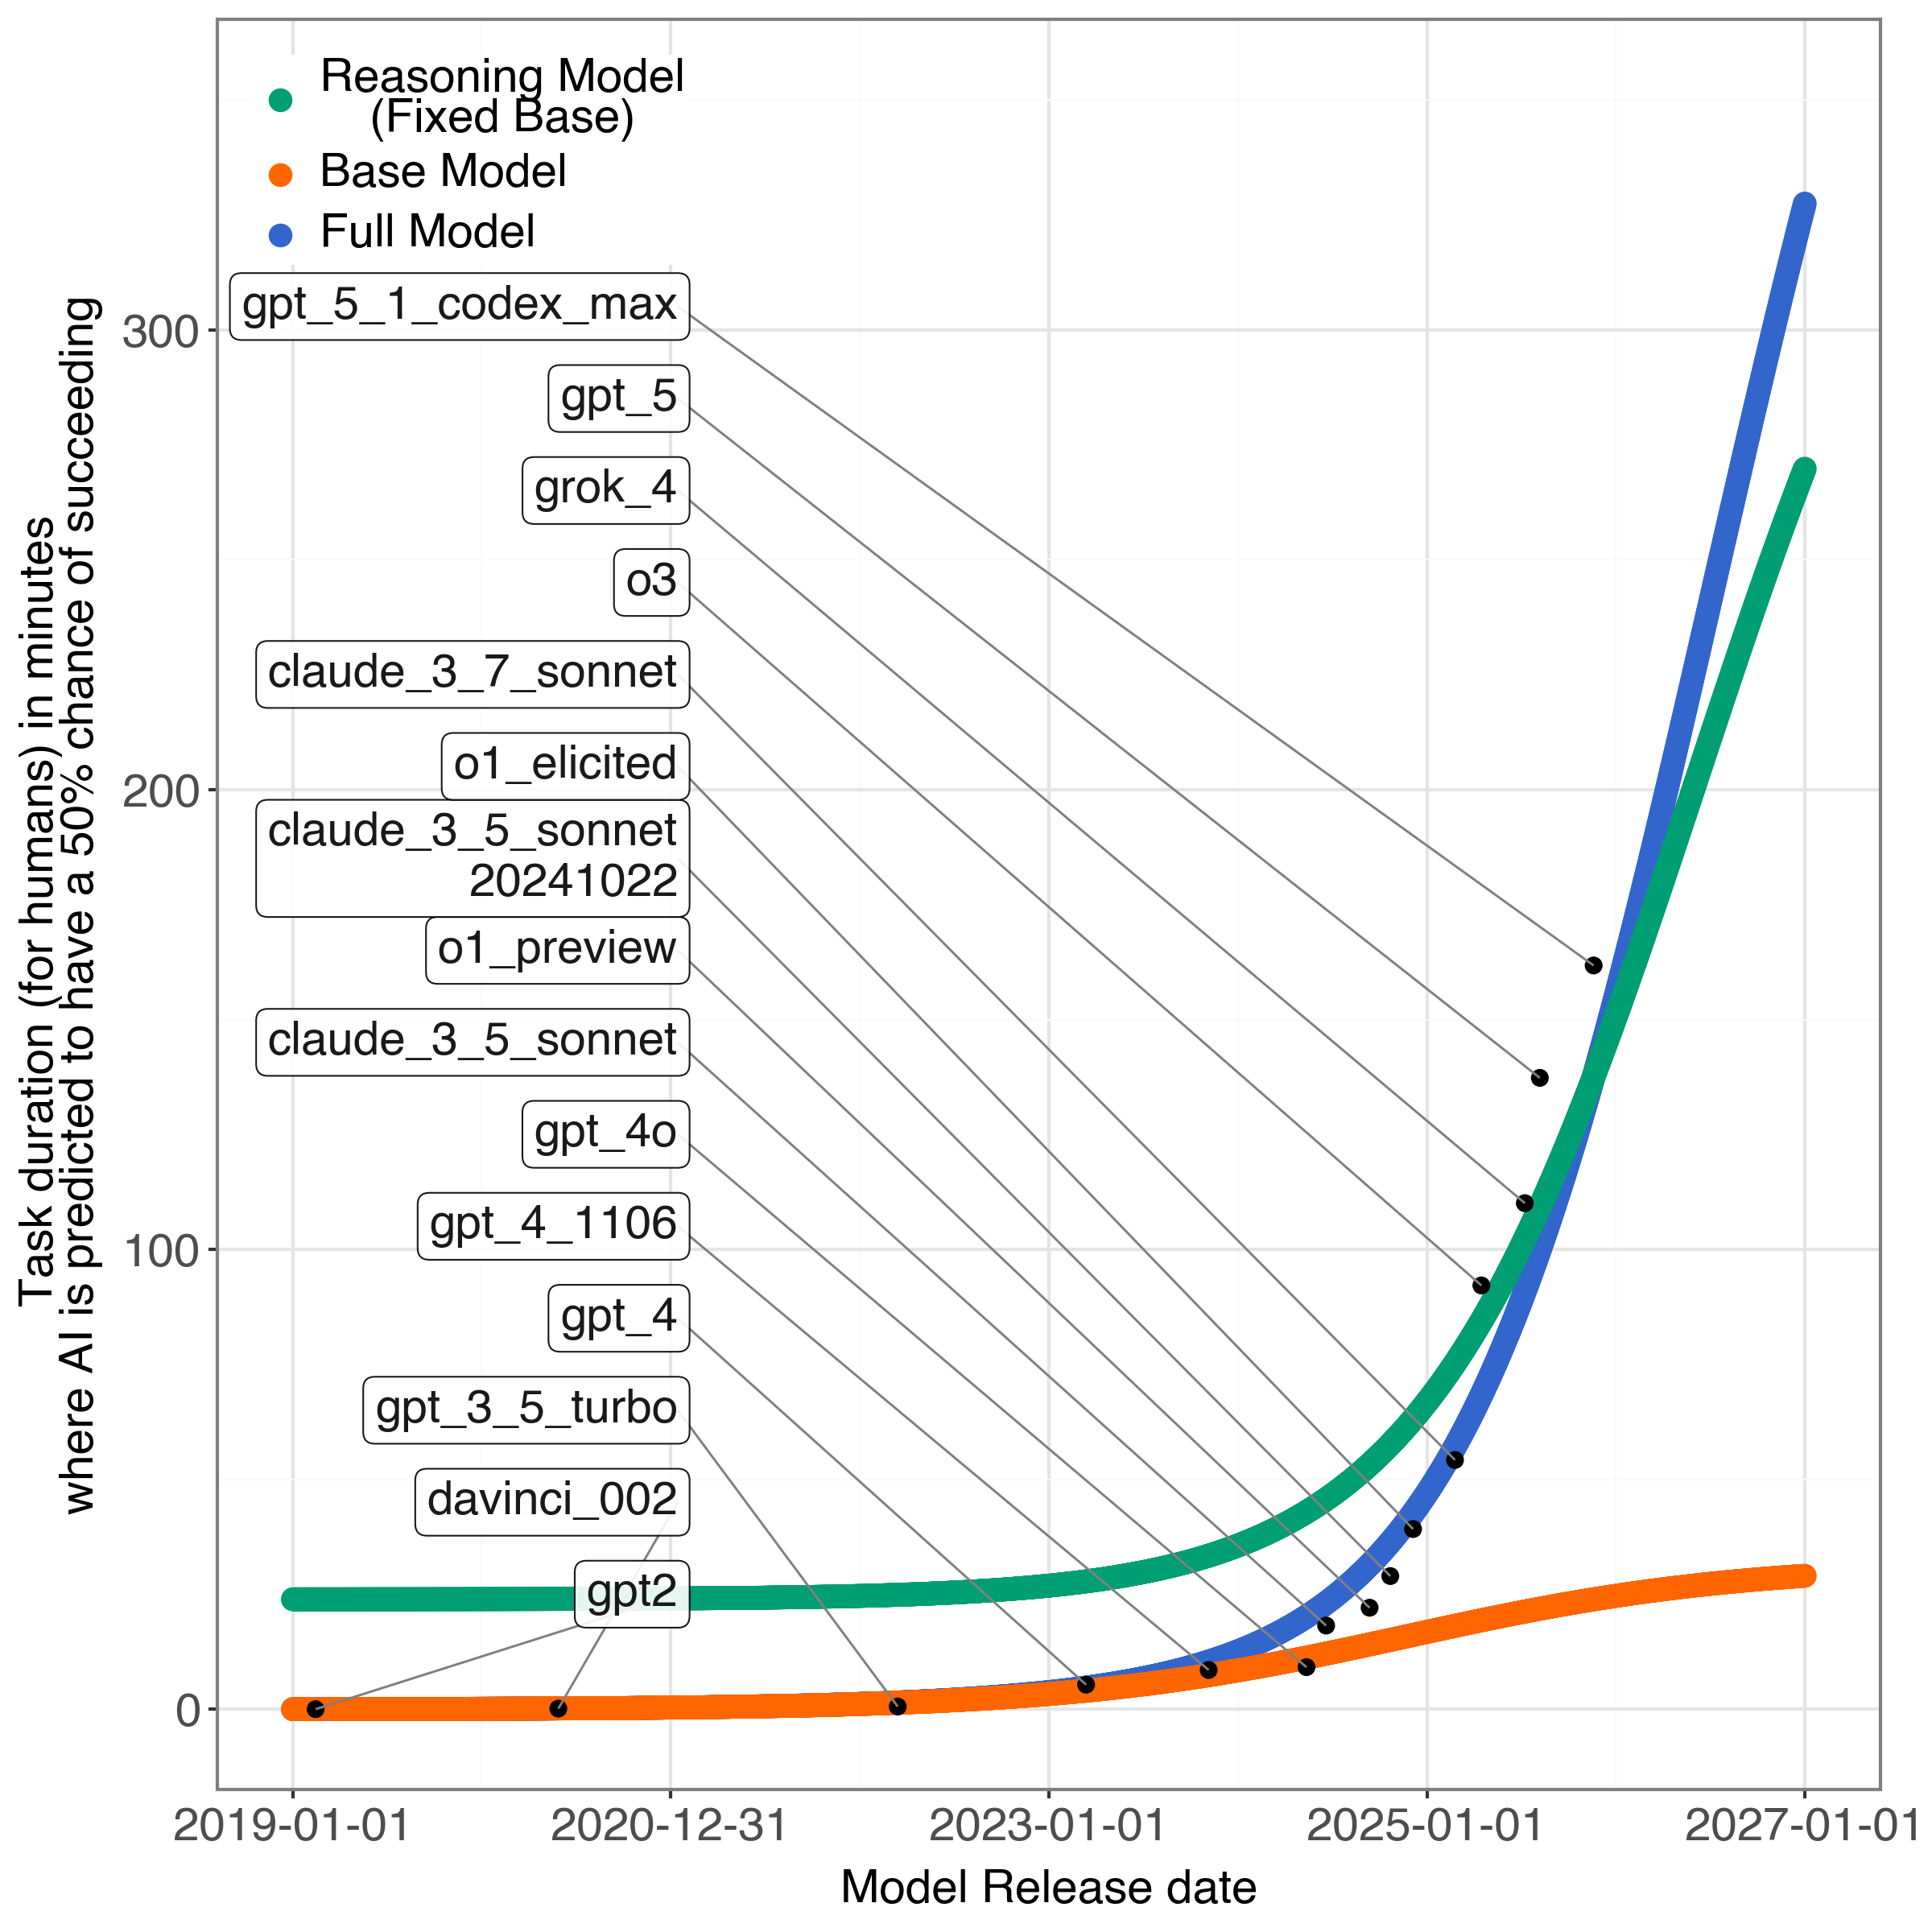
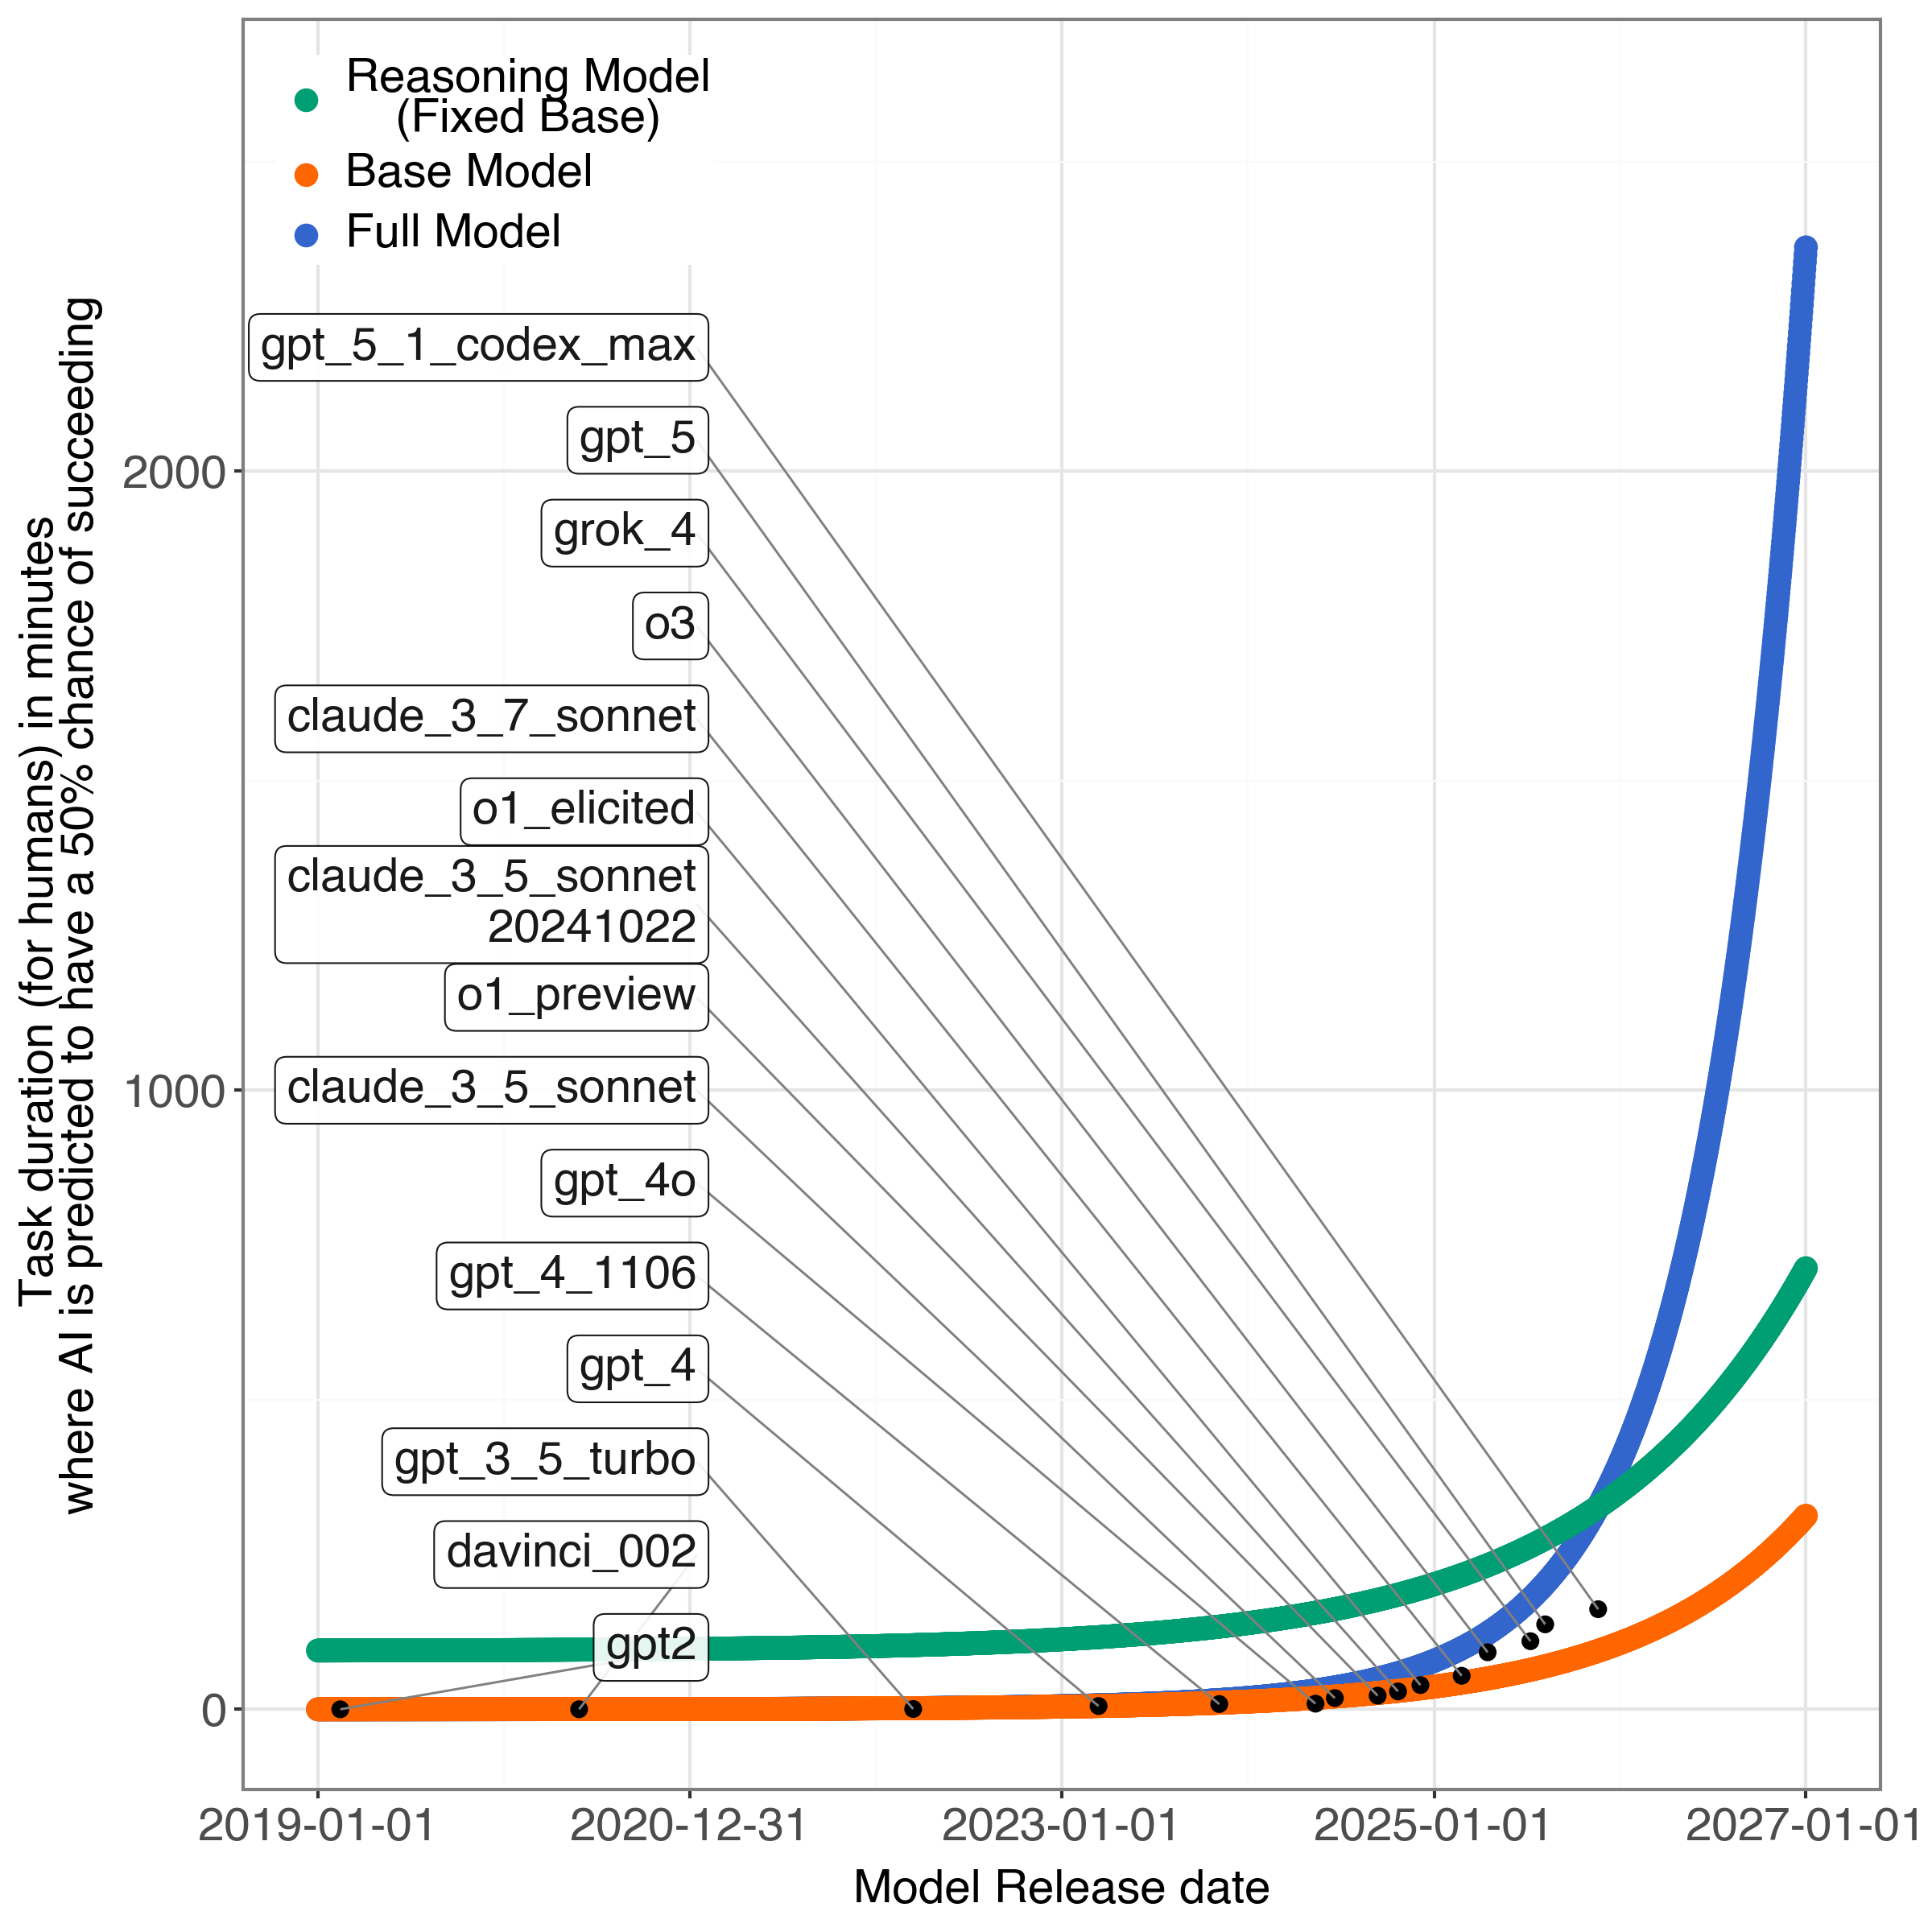
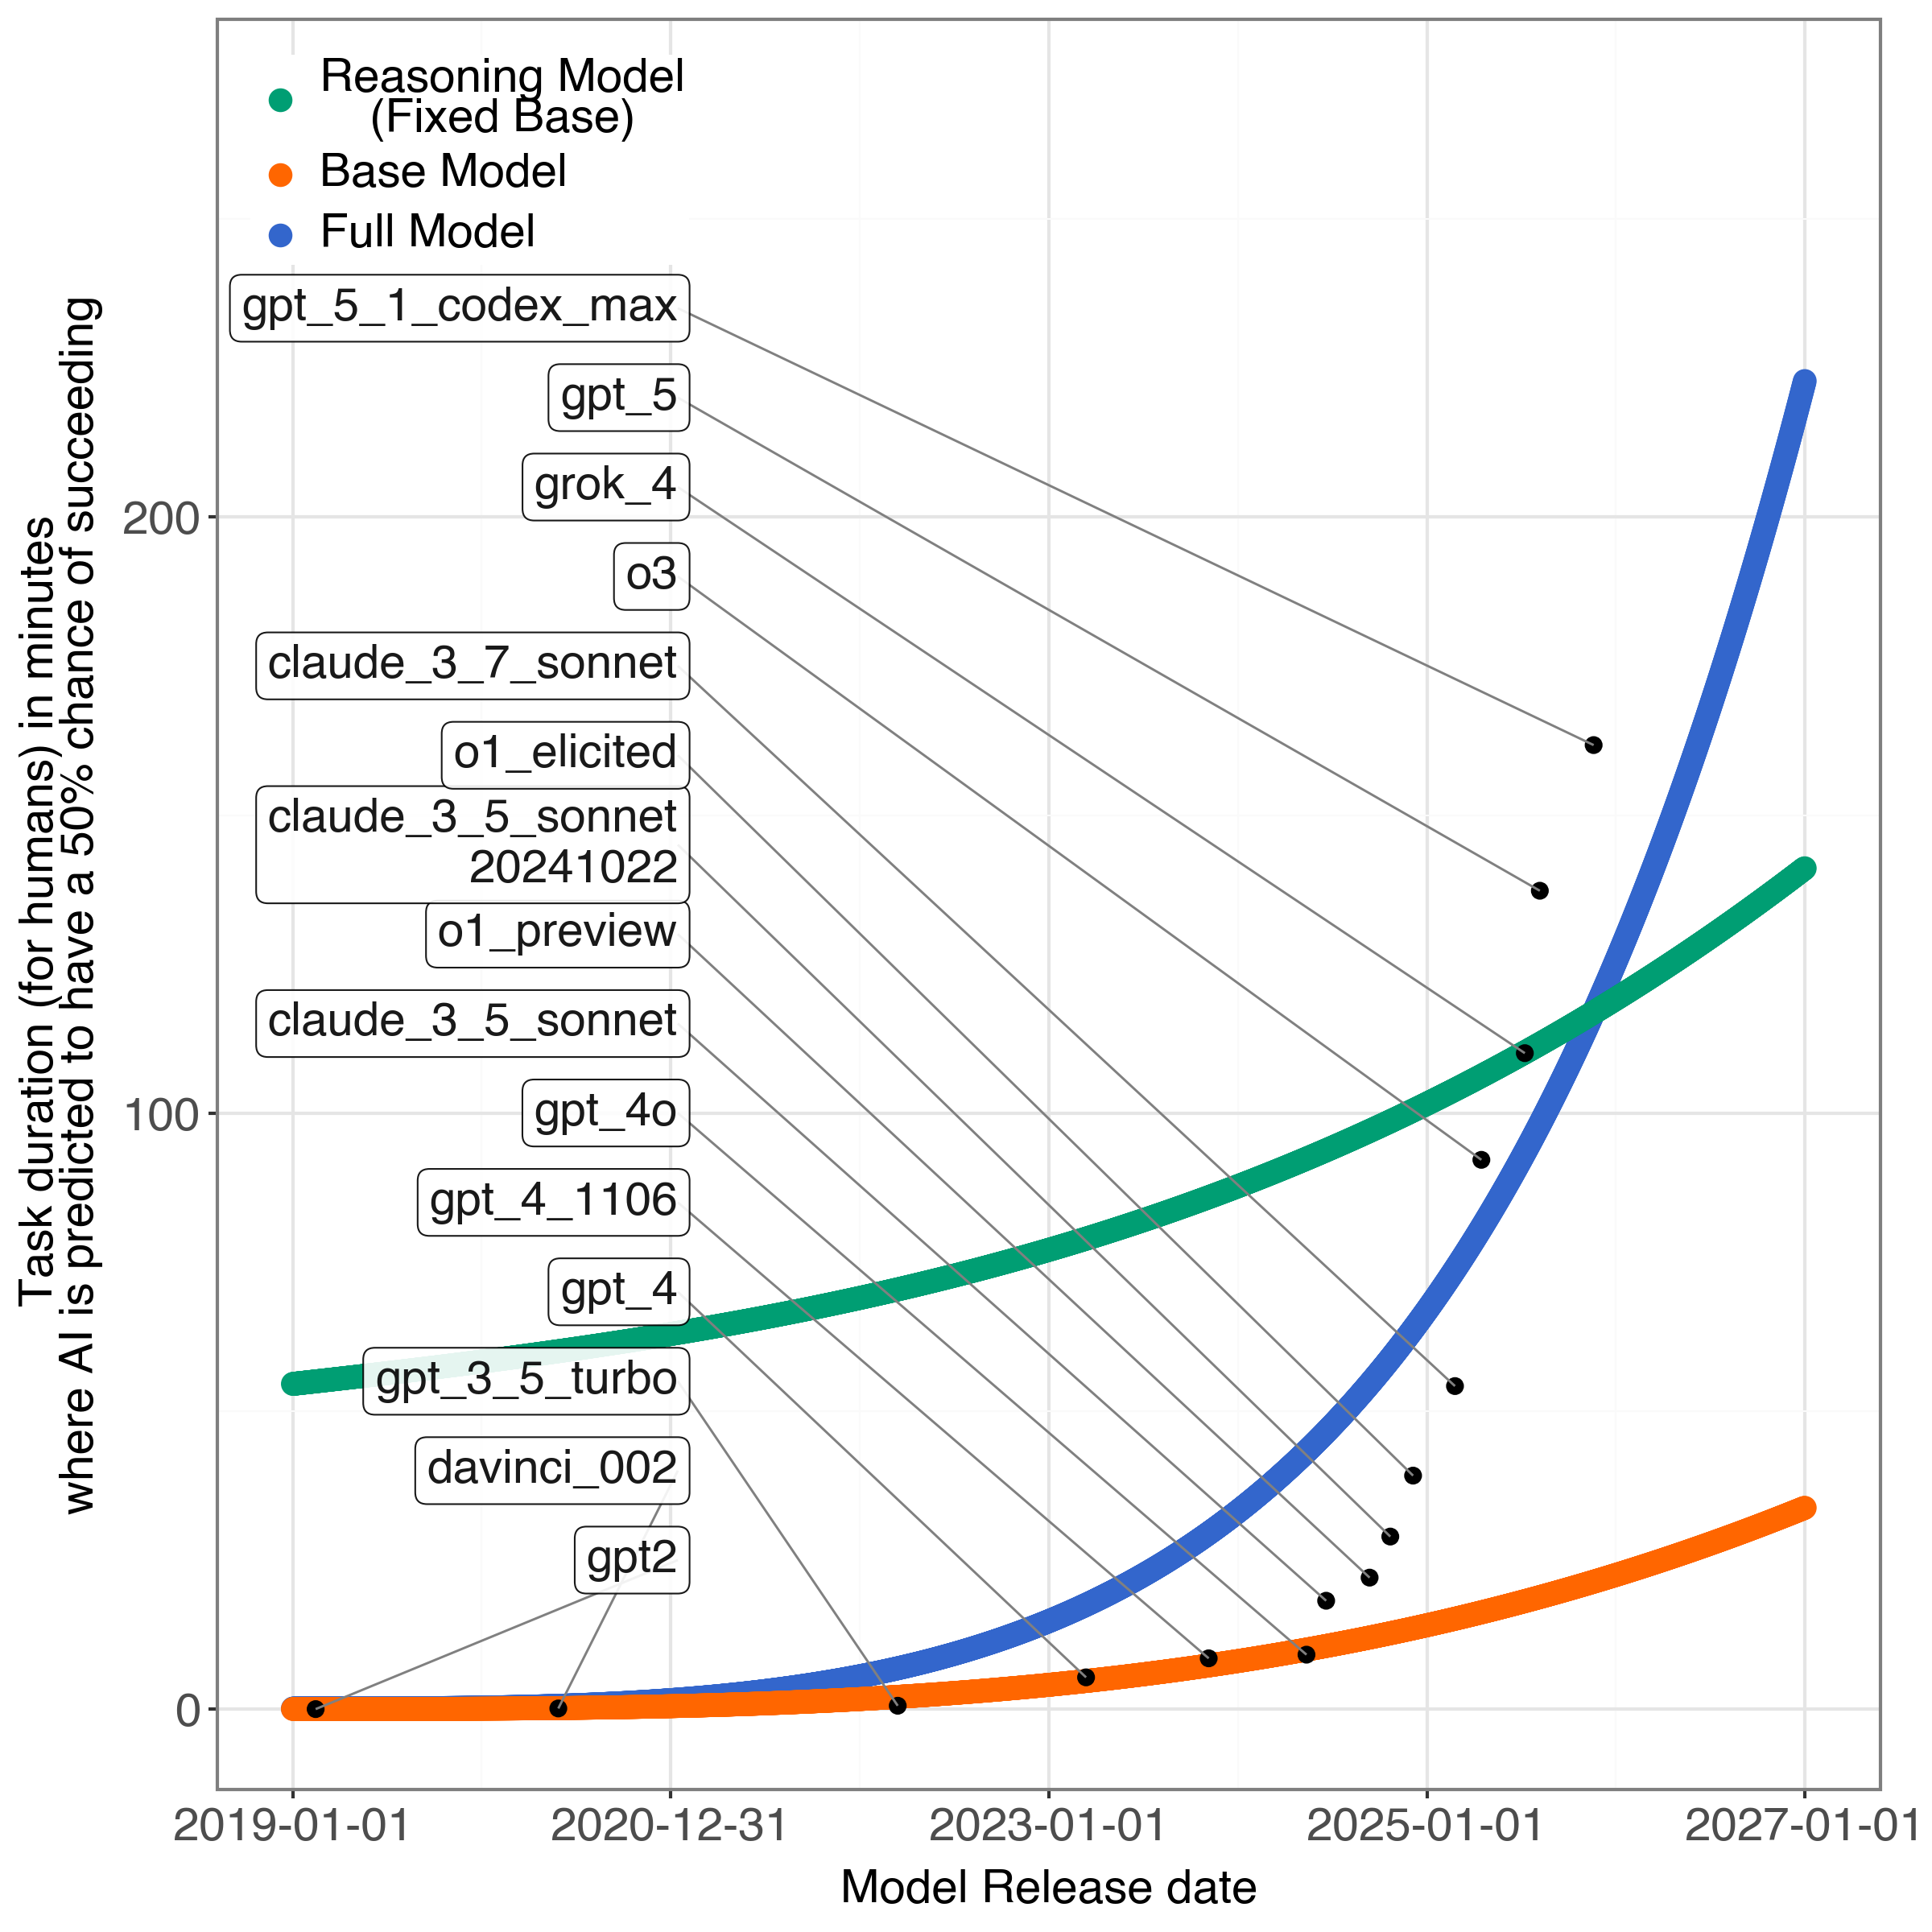
- Their two-part model (base × reasoning) also fits the data, and it indicates:
- Base capabilities likely hit their inflection point around late 2024 (near when “reasoning models” started to take off).
- Reasoning capabilities may hit their inflection point around mid-2026.
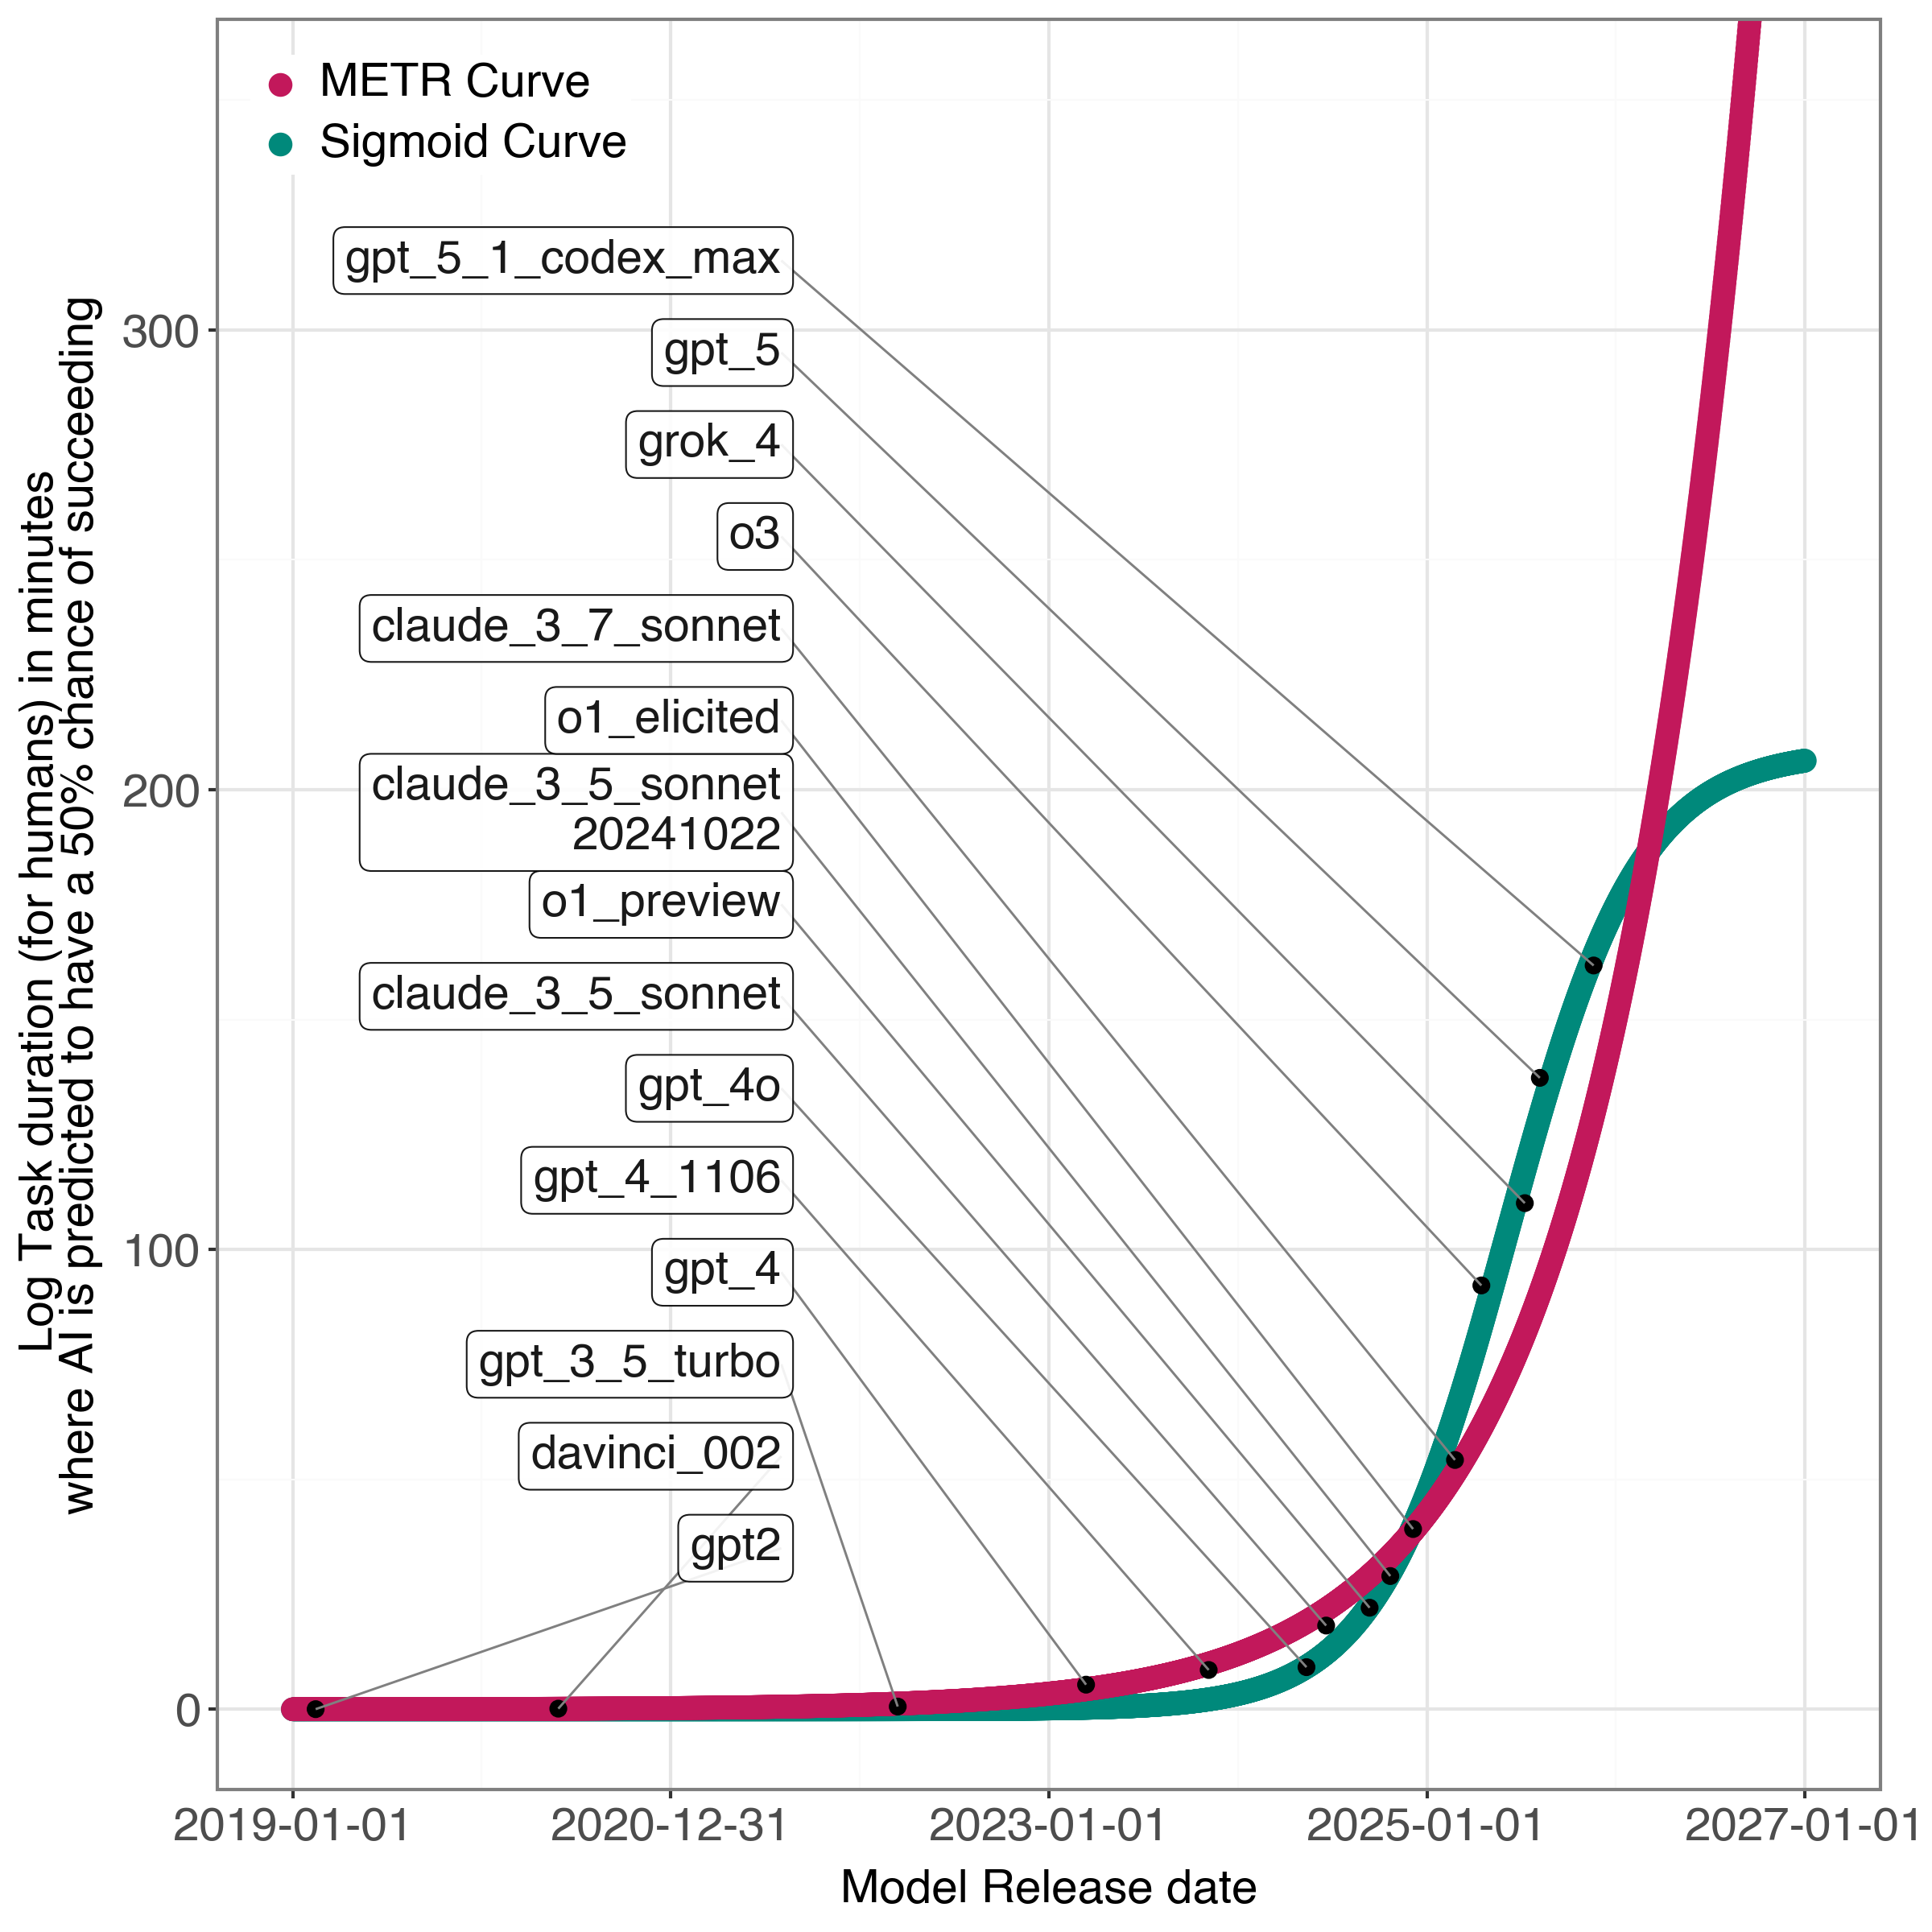
- Among the models they tried, the sigmoid-based versions matched the data better than the exponential one, suggesting a plateau in the near future is plausible.
- The “exponential-looking” period in recent years may be because reasoning (a new add-on) improved very quickly right after it was introduced—like a power-up added to a strong base model. But as reasoning matures, its improvement may also slow.
Why this matters:
- If progress is exponential, we should expect extremely fast advances soon, which could rapidly change jobs and raise safety concerns.
- If progress is bending toward a plateau, the near future may be less explosive. That changes how governments, schools, and workers plan and prepare.
- The paper’s message is not “exponential is impossible.” It’s “the data also supports a slowing trend—so be cautious about bold exponential forecasts.”
5) What does this mean for the future?
Implications:
- Forecasts are fragile: With limited data and new breakthroughs popping up, it’s hard to be certain. Exponential growth is possible—but not guaranteed.
- Breakthroughs drive curves: The recent jump likely came from adding reasoning. If another big breakthrough arrives, growth could speed up again. If not, progress may level off.
- Plan for multiple scenarios: Policymakers, educators, and companies should prepare both for rapid change and for a slowdown.
- Better forecasting methods are needed: The authors call for more careful, transparent ways to test forecasts, compare models fairly, and separate different components of AI progress (base vs. reasoning vs. other factors).
In short: The paper argues that recent AI progress can be explained by an S-shaped pattern—fast gains that start to level off—especially when you separate “base” ability from newer “reasoning” skills. That doesn’t rule out future leaps, but it does suggest we shouldn’t assume endless exponential growth without strong evidence.
Knowledge Gaps
Knowledge gaps, limitations, and open questions
Below is a focused list of concrete gaps and open questions that remain unresolved in the paper and could guide future research.
- Representativeness of the METR datasets: To what extent do HCAST, RE-Bench, and SWAA cover the capability space relevant to “AI capabilities” and long-horizon real-world work? Assess domain coverage, task diversity, and missing task families (e.g., multi-agent planning, embodied tasks, tool-augmented workflows).
- Validity and reliability of the 50% model horizon metric: How accurate and consistent are human-time difficulty estimates () across domains and raters? Quantify inter-rater reliability, measurement error, and downstream impact on and growth-curve inference.
- Selection bias from focusing on SOTA models: How sensitive are conclusions to including mid-tier or non-SOTA models? Evaluate whether SOTA-only sampling exaggerates stepwise gains and biases growth-model fits.
- Potential data leakage or timeline inconsistencies: The model list includes releases from late 2025; clarify whether those entries were in-sample at estimation time and ensure no forward-looking information contaminates fits.
- Small-sample limitations: With ~15 SOTA models, how reliable are multi-parameter fits (e.g., spline, two-link-function multiplicative models)? Perform power analyses and uncertainty quantification for parameter estimates and inflection dates.
- Lack of uncertainty quantification: Provide confidence/credible intervals for:
- the single-sigmoid inflection date,
- the base and reasoning inflection dates (, ),
- overall forecasts (prediction intervals), and
- model comparison metrics (e.g., standard errors on MSE differences).
- No out-of-sample validation: Implement rolling-origin or time-series cross-validation and backtesting to compare exponential, logistic, Gompertz/Richards, piecewise-linear, and spline models on predictive performance.
- Inconsistent loss functions across models: Re-evaluate all contenders under a unified scoring rule (e.g., negative log-likelihood via the full hierarchical model or a consistent MSE target) to enable fair comparison with METR’s approach.
- Unclear identifiability of base vs. reasoning components: In the multiplicative model , what guarantees identifiability of vs. with current data? Conduct identifiability analysis, posterior correlation checks, and sensitivity to priors.
- Definition and operationalization of “reasoning” and : How are “reasoning-capable” models and “activation” determined per evaluation? Provide criteria, per-task toggles, and document whether test-time CoT, “thinking tokens,” or specific prompting regimes were used.
- Confounding from test-time compute: Reasoning improvements often coincide with increased test-time compute (more tokens, deeper search). Disentangle architectural/post-training changes from test-time budget increases by controlling or matching on test-time compute.
- Confounding from tool use and agentic scaffolding: Separate gains due to external tools (code execution, web, REPLs) and agent frameworks from intrinsic model reasoning. Report tool-access configurations across evaluations.
- Mapping theory to measurement: Theorem assumptions (e.g., evenly spaced inflection points, identical sigmoids, ) are not empirically validated. Devise empirical tests to estimate the number, timing, and spacing of underlying “component technologies” and check whether data support those structural assumptions.
- Alternative interaction structures: The multiplicative assumption may be too restrictive. Test additive, CES/elasticity-of-substitution, or super/sub-multiplicative interactions among components and compare fit and interpretability.
- Alternative growth curves not evaluated: Compare logistic-with-flexible-carrying-capacity (Richards), Gompertz, piecewise-exponential, structural break models, and Bayesian nonparametrics (e.g., Gaussian processes) to assess robustness of “plateau in near future” claims.
- Heterogeneity across task families: Fit the model separately to HCAST, RE-Bench, and SWAA to test whether base/reasoning inflection dates and growth modes differ by domain; investigate domain-specific plateaus vs. generalized plateau.
- Sensitivity to priors and constraints: Report posterior sensitivity to:
- positivity constraints on parameters and spline coefficients,
- weakly-informative priors (),
- random-walk spline priors and breakpoint choices.
- Propagation of uncertainty from task-level outcomes: Ensure uncertainty in and the logistic task model is propagated to , growth-curve fits, and forecasts (e.g., via full Bayesian hierarchical modeling or bootstrap).
- Residual diagnostics and model misfit: Provide residual analyses over time and task difficulty (e.g., residuals vs. date and ) to reveal systematic misfit, heteroskedasticity, or nonstationarity.
- Robustness to evaluation settings: Document and control for prompt templates, temperatures, sampling strategies, context windows, and chain-of-thought policies across models/dates; quantify their impact on horizon estimates.
- Feature augmentation beyond release date: Incorporate compute, parameter count, data tokens, architecture class, and post-training regime as covariates to explain ; assess whether time alone is an adequate proxy.
- Task-construction drift over time: Evaluate whether newer tasks systematically differ in design or difficulty calibration, potentially biasing trend estimates; design procedures to stabilize task difficulty distribution over time.
- Deeper decomposition of “base” and “reasoning”: Empirically separate contributions of pretraining data/scale, architecture, instruction-tuning/RLHF, reasoning supervision, and search/planning; test whether the two-factor model is too coarse.
- Causal attribution of “reasoning-driven” gains: Conduct controlled ablations (e.g., same base model with and without reasoning finetuning; matched test-time compute) to causally attribute performance gains to reasoning vs. other factors.
- Generalization beyond the METR scope: Validate the plateau hypothesis on additional benchmarks (e.g., SWE-bench, BIG-bench Hard, math/contest problems, multimodal tool-use suites) and on economically valuable tasks outside METR.
- Forecast scenarios and uncertainty: Provide scenario analyses that vary breakthrough frequency/magnitude, compute availability, data constraints, and alignment advances, with explicit predictive intervals and structural break probabilities.
- Backtesting earlier eras: Apply the proposed framework to earlier model generations (pre-2019) to test whether the multiplicative + sigmoid decomposition retrospectively explains past waves of progress.
- Handling of long-horizon tasks and compounding errors: Examine whether the horizon metric’s growth can be driven by compounding small improvements in step-wise accuracy (vs. new capabilities), and whether this differs by domain.
- Reproducibility and transparency: Release full evaluation scripts (prompts, seeds, tool configurations), trained model metadata, and Stan code necessary to reproduce the exact fits and figures, including pre-processing of dates and normalization.
- Economic external validity: Connect changes in to real-world labor outcomes (cost, quality, reliability) to assess whether a plateau in the metric implies a plateau in economic automation potential.
- Detection of structural breaks: Apply formal structural break tests (e.g., Bai–Perron) to identify regime shifts in growth trends and align them with documented technological introductions (e.g., reasoning finetuning, test-time search).
- Robustness of inflection dates to time encoding: Report how choices for time scaling/normalization (days vs. months, origin, seasonality) affect the estimated inflection dates and plateau timing.
- Treatment of missing or censored outcomes: Specify handling of tasks/models with incomplete evaluations, low attempt counts, or ceiling/floor effects, and assess bias introduced by censoring.
Practical Applications
Immediate Applications
The following applications can be piloted or adopted now, leveraging the paper’s findings that (i) recent AI gains can be modeled as a multiplicative combination of base and reasoning capabilities, (ii) a sigmoid fit to frontier capability data places the inflection point near the present, and (iii) short-term projections should not assume unconstrained exponential growth.
Industry
- Software and IT: Cost-aware “reasoning gating” in production LLM systems
- What: Introduce controllers that decide when to activate expensive reasoning features (e.g., chain-of-thought, tool-use, test-time compute) only on cases with expected ROI, modeled after the paper’s k_thinking switch and multiplicative contribution of reasoning.
- Tools/workflows: “Reasoning budget manager” in inference pipelines; A/B tests calibrated on 50% model-horizon improvements; dynamic route-to-reasoning policies based on task difficulty estimates.
- Assumptions/dependencies: Requires reliable difficulty proxies or uncertainty estimators; vendor APIs that expose thinking modes; current tasks that benefit from reasoning.
- Software and IT: Decomposed KPI dashboards for capability tracking
- What: Build internal dashboards tracking base vs reasoning contributions to performance on task families (e.g., SWE-bench/SWAA-like tasks vs RE-bench-like reasoning tasks), aligning with the multiplicative model.
- Tools/workflows: Benchmark-as-a-service with “Reasoning Quality Index”; inflection-point detectors by fitting sigmoids (code base provided in the paper).
- Assumptions/dependencies: Access to relevant tasks, reproducible evaluation harnesses, and stable operator policies for reasoning modes.
- Finance and Strategy: Scenario planning with sigmoid vs exponential growth tracks
- What: Adopt dual-track forecasts (sigmoid and exponential) for revenue, gross margin, automation timelines, and hiring plans; stress test milestones against a near-term plateau.
- Tools/workflows: Portfolio and capex planning models with toggleable growth curvatures; procurement clauses tied to realized 50% horizon improvements.
- Assumptions/dependencies: Organizational acceptance of uncertainty; access to updated horizon metrics.
- Data/Compute Procurement: Rebalance near-term investments toward post-training and data quality
- What: Shift budget from pure scale-ups of base models to post-training pipelines, curation of reasoning datasets, retrieval/tool integration, and inference optimization—consistent with a slowing base capability and transitory reasoning gains.
- Tools/workflows: Data engineering roadmaps, toolformer-style integrations, retrieval augmentation, agent orchestration with human-in-the-loop gates.
- Assumptions/dependencies: Reasoning gains still accruing; diminishing returns to parameter count/compute implied by base inflection.
- HR and Operations: Workforce planning for augmentation-first workflows
- What: Prioritize AI+human co-pilot patterns in software/devops/customer ops rather than assuming full automation in the very near term.
- Tools/workflows: Pair-programming policies; structured hand-offs from agents to humans at “reasoning chokepoints.”
- Assumptions/dependencies: Plateau implies slower displacement; actual task mix must be benchmarked to confirm.
- Healthcare IT: Procurement criteria that separate base vs reasoning performance
- What: Require vendors to report performance under both standard and reasoning-activated modes on clinically relevant tasks (e.g., documentation, summarization, step-by-step care pathway planning).
- Tools/workflows: RFP language referencing a 50% model-horizon-like metric and subgroup analyses.
- Assumptions/dependencies: Availability of sector-specific tasks; compliance and safety review capacity.
- Energy/Cloud: Data center capacity planning aligned to plateau scenarios
- What: Calibrate near-term compute build-outs to the possibility of diminished returns from training larger base models, emphasizing inference efficiency.
- Tools/workflows: Power and GPU procurement models incorporating sigmoid projections and test-time compute trade-offs.
- Assumptions/dependencies: Vendor roadmaps; price/performance curves; electricity and chip availability.
Academia
- Evaluation science: Adopt decomposed capability reporting
- What: Publish results that separate base and reasoning contributions using link-function fits (sigmoid, splines), in addition to single-curve leaderboards.
- Tools/workflows: Re-analysis of public benchmarks with the paper’s modeling approach (Stan/PyTorch), open leaderboards reporting both components.
- Assumptions/dependencies: Reproducible datasets; shared protocols; agreement on what constitutes “reasoning activation.”
- Benchmark development: Task design with controllable reasoning load
- What: Create task suites where reasoning complexity can be toggled or scaled, enabling clean attribution to base vs reasoning capability.
- Tools/workflows: Curriculum-style datasets; long-horizon planning tasks with staged scaffolding.
- Assumptions/dependencies: Careful task validation; expert labeling costs.
- Forecasting methodology: Comparative model selection beyond exponential fits
- What: Require sigmoid and multiplicative alternatives in capability forecasting papers, with transparent in-sample/out-of-sample scoring and uncertainty intervals.
- Tools/workflows: Standardized fitting pipelines, cross-validation strategies, and community-agreed scoring rules.
- Assumptions/dependencies: Enough temporal datapoints; consistency in task definitions.
Policy and Governance
- AI governance pacing: Trigger-based oversight based on decomposed horizons
- What: Set review cadences or risk tiers tied to observed movement in base and reasoning horizons, not just aggregate claims of exponential growth.
- Tools/workflows: Regulator dashboards; procurement guardrails tied to component gains; living documents updating risk thresholds.
- Assumptions/dependencies: Access to evaluation data; industry cooperation.
- Labor and training programs: Update occupation risk models to reflect possible near-term plateau
- What: Adjust reskilling priorities toward augmentation-focused programs; recalibrate timelines for displacement and wage pressure.
- Tools/workflows: Sectoral analyses using horizon metrics; public grants for complementarity skills.
- Assumptions/dependencies: Validation that plateau holds in target sectors; continuous monitoring.
- Public procurement: Require vendors to disclose “reasoning activation” conditions and costs
- What: Contract language that specifies performance with/without reasoning, test-time compute budgets, and anticipated inflection points.
- Tools/workflows: Capability decomposition schedules; cost-per-solved-task clauses.
- Assumptions/dependencies: Vendor transparency; standardized audits.
Daily Life (Individuals and SMBs)
- Career planning: Prioritize complementary skill development
- What: Focus near-term upskilling on orchestration, domain judgment, and cross-functional collaboration rather than expecting imminent end-to-end automation.
- Tools/workflows: Micro-credentials in AI tool-use, prompt engineering with reasoning gates, and human-in-the-loop QA.
- Assumptions/dependencies: Plateau persists; availability of credible training programs.
- SMB adoption: Stepwise deployment of AI with ROI-based reasoning usage
- What: Use simpler base-model workflows for routine tasks and selectively enable reasoning on high-value, complex cases.
- Tools/workflows: Light-weight agent frameworks; cost dashboards linking reasoning usage to outcomes.
- Assumptions/dependencies: Clear task segmentation; accessible vendor tooling for “thinking” modes.
Long-Term Applications
These applications assume further maturation of evaluation ecosystems, standards, and data availability, or depend on breakthroughs beyond reasoning that could alter the trajectory.
Industry
- Product strategy: “Component-technology” roadmapping and M&A
- What: Build roadmaps around separate components (base, reasoning, planning, memory, tool-use), timing R&D and acquisitions as each component approaches inflection points.
- Tools/products: Component-level capability indices; portfolio optimizers that allocate R&D spend across components.
- Assumptions/dependencies: Emergence of additional components and stable ways to measure them; reliable inflection detection.
- Tooling: Market for “Reasoning Ops” platforms
- What: Commercial platforms that manage reasoning datasets, synthetic reasoning data generation, test-time compute governance, and compliance reporting.
- Tools/products: End-to-end ReasoningOps suites integrated with MLOps and observability.
- Assumptions/dependencies: Standardization of reasoning modes; proven performance gains.
- Cross-sector automation planning: Plateau-aware automation blueprints
- What: Design industry-specific automation stacks (healthcare documentation, legal drafting, finance analysis) that anticipate bounded reasoning gains and embed human checkpoints.
- Tools/workflows: Pre-validated, regulated automation playbooks; certification frameworks.
- Assumptions/dependencies: Regulatory approval; high-quality, domain-specific benchmarks.
Academia
- Standards and consortia: Formalize component-based capability reporting
- What: Establish community standards for decomposed metrics (base, reasoning, planning, etc.) and publish shared references akin to AI Index.
- Tools/workflows: Open data repositories, multi-institution leaderboards with time-series tracking, registered reports.
- Assumptions/dependencies: Funding and governance; consensus among benchmark maintainers.
- Methodological advances: Robust, uncertainty-aware forecasting
- What: Develop ensembles of link functions (sigmoid, splines, multiplicative models) with conformal or Bayesian uncertainty quantification for capability projections and inflection-point detection.
- Tools/workflows: Open-source libraries for capability forecasting; reproducibility checklists and standards.
- Assumptions/dependencies: Larger, cleaner longitudinal datasets; agreed-upon evaluation metrics.
- New research directions: Beyond-reasoning components
- What: Systematically study other multiplicative components (e.g., long-horizon planning, memory, tool-use, embodiment) and their interactions.
- Tools/workflows: Modular benchmarks where components can be toggled; ablation-ready training pipelines.
- Assumptions/dependencies: Vendor collaboration; interpretable training regimes.
Policy and Governance
- Compute governance calibrated to component trajectories
- What: Policy frameworks that monitor and cap compute by component (e.g., training vs test-time reasoning compute) as opposed to undifferentiated thresholds.
- Tools/workflows: Reporting standards for reasoning compute budgets; audits tied to component growth.
- Assumptions/dependencies: Technical feasibility of measuring component-specific compute; international cooperation.
- Adaptive regulation: Capability-contingent rules
- What: Dynamic regulation that tightens or relaxes oversight based on observed movement in component inflection points and associated risk models (e.g., autonomy in cyber, bio, or critical infrastructure).
- Tools/workflows: Regulatory sandboxes; early-warning indicators derived from decomposed metrics.
- Assumptions/dependencies: High-frequency, trusted evaluation signals; clear risk thresholds.
- Labor market instruments: Plateau-informed transitions
- What: Long-horizon programs for reskilling and wage insurance that are triggered by observed plateau or re-acceleration, minimizing whiplash from over- or under-reacting to hype.
- Tools/workflows: Conditional grants, tax incentives tied to augmentation investments.
- Assumptions/dependencies: Administrative capacity; reliable forecasting signals.
Daily Life (Individuals and SMBs)
- Education systems: Curricula for modular AI literacy
- What: Teach students to identify when reasoning modes are helpful, how to supervise AI agents, and how to interface with tools that control reasoning compute and costs.
- Tools/workflows: Classroom sandboxes with reasoning gates; project-based learning with metric dashboards.
- Assumptions/dependencies: Availability of safe, affordable classroom tools; teacher training.
- Household finance and career navigation tools with capability forecasts
- What: Personal planning apps that integrate sigmoid-based capability scenarios to advise on retraining timing, career switches, or entrepreneurial opportunities.
- Tools/products: Forecast-informed upskilling planners; automation risk monitors by occupation.
- Assumptions/dependencies: Credible, updated capability feeds; user trust and comprehension.
- Consumer protection: Transparency labels for AI services
- What: Labels that disclose when a product’s performance depends on reasoning activation and associated costs/latency, helping users choose cost-effective options.
- Tools/workflows: Standards organizations and watchdog dashboards.
- Assumptions/dependencies: Industry adoption; regulatory backing.
Notes on feasibility and cross-cutting assumptions:
- The paper’s conclusions rely on METR-style horizon data, small samples, and in-sample fits; inflection dates are uncertain and sensitive to new releases.
- The multiplicative assumption (overall capability as base × reasoning) is a modeling choice; different sectors may have different decompositions.
- “Reasoning activation” must be operationally defined (e.g., chain-of-thought, test-time compute, tool-use), and vendors must expose controllable modes for many applications to work.
- Breakthroughs beyond reasoning could re-ignite faster growth, changing timelines; plans should incorporate contingency ranges rather than single-point forecasts.
Glossary
- 50% model horizon: A metric indicating the task difficulty at which a model succeeds with 50% probability. Example: "They propose a novel metric: 50\% model horizon, which measures the difficulty of tasks that a model can solve successfully 50\% of the time."
- B-spline basis function: A piecewise-polynomial basis function used to construct flexible spline curves. Example: "B-spline basis function (which we take to be a degree polynomial)"
- Chain-of-thought reasoning: Training or prompting that elicits intermediate reasoning steps to improve problem-solving. Example: "chain-of-thought reasoning has been popular for some time now"
- Exponential link: A modeling choice where capabilities are assumed to grow exponentially with time. Example: "Exponential Link"
- Gradient descent: An iterative optimization algorithm that updates parameters in the direction of the negative gradient of a loss. Example: "We use gradient descent in PyTorch for parameter estimation."
- HCAST: A benchmark suite with diverse tasks in cybersecurity, machine learning, software engineering, and general reasoning. Example: "HCAST contains a diverse set of challenges in cybersecurity, machine learning, software engineering, and general reasoning."
- Indicator function: A function that equals 1 if a condition holds and 0 otherwise, used to toggle components in a model. Example: "1{k_{\text{thinking} = 1}"
- Inflection point: The point on a curve where the curvature changes sign, often marking the transition from accelerating to decelerating growth. Example: "the inflection point has already passed."
- Link function: A function mapping inputs (e.g., release date) to model components or outcomes within a regression framework. Example: "The link functions encode how the base and reasoning capabilities depend on the model's release date"
- Log-likelihood: The natural logarithm of the likelihood function, maximized to estimate model parameters. Example: "We perform estimation by maximizing the log-likelihood of the probabilistic model"
- Mean-squared error (MSE): The average of squared differences between predicted and observed values, used to assess fit. Example: "minimizing the mean-squared error (MSE)"
- Multiplicative model: A modeling assumption where overall capability is the product of multiple component technologies. Example: "technologies are multiplicative"
- Positivity constraints: Parameter constraints requiring certain coefficients to be strictly positive during estimation. Example: "impose positivity constraints on $\gamma_1, \gamma_2, \delta_1, \theta_1,\beta_{\text{model}$."
- R2: The coefficient of determination measuring the proportion of variance explained by a regression model. Example: "METR reports an value of $0.98$ for this regression"
- Random-walk priors: Bayesian priors that tie successive parameters together to encourage smoothness and reduce overfitting. Example: "we regularize the spline coefficients using random-walk priors"
- RE-Bench: A benchmark of open-ended research engineering tasks intended to take human experts multiple hours. Example: "RE-Bench consists of challenging open-ended machine learning research engineering environments, each of which are intended to take a human expert approximately 8 hours to complete."
- Sigmoid function: The logistic function , often used to model saturating growth with an inflection point. Example: "is the sigmoid function."
- Sigmoid link: A link function using the sigmoid to model growth that accelerates then plateaus. Example: "Sigmoid Link"
- SOTA: Abbreviation for “state-of-the-art,” referring to the leading models at a given time. Example: "state-of-the-art (SOTA)"
- Stan: A probabilistic programming language for Bayesian inference and optimization. Example: "using Stan"
- SWAA: A benchmark of small software engineering tasks used to evaluate model capabilities. Example: "SWAA comprises 66 small tasks commonly performed in software engineering work."
- Weakly informative prior: A Bayesian prior that mildly regularizes parameters without overwhelming the data. Example: "the weakly informative prior "
Collections
Sign up for free to add this paper to one or more collections.